

1 引言
2 资料来源和方法介绍
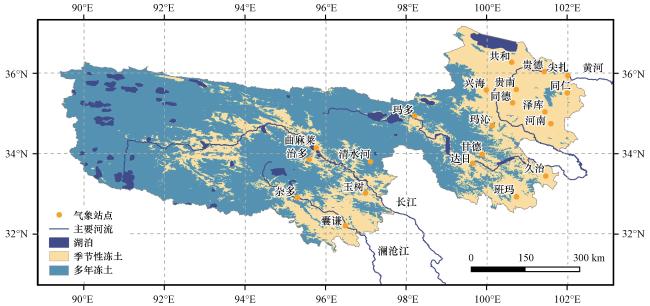
图1 三江源地区气象站点及冻土分布(引自Zou et al, 2017)Fig.1 Spatial distribution of meteorological stations and the seasonally frozen ground in the three River Source (TRS) region (from Zou et al, 2017) |
表1 三江源地区21个气象站点基本信息Table1 Information of 21 meteorological stations in the Three River Source (TRS) region |
| 序 号 | 站名 | 站号 | 纬度 /(°N) | 经度 /(°E) | 测站 高度/m | 冻土观测起 始月(年-月) |
|---|---|---|---|---|---|---|
| 1 | 共和 | 52856 | 36.27 | 100.62 | 2835.0 | 1961-01 |
| 2 | 贵德 | 52868 | 36.02 | 101.37 | 2273.0 | 1961-01 |
| 3 | 兴海 | 52943 | 35.59 | 99.98 | 3323.2 | 1961-01 |
| 4 | 贵南 | 52955 | 35.59 | 100.74 | 3120.0 | 1961-01 |
| 5 | 同德 | 52957 | 35.24 | 100.60 | 3148.2 | 1961-01 |
| 6 | 尖扎 | 52963 | 35.94 | 102.01 | 2175.5 | 1961-01 |
| 7 | 泽库 | 52968 | 35.03 | 101.47 | 3662.8 | 1961-01 |
| 8 | 同仁 | 52974 | 35.54 | 102.03 | 2475.0 | 1961-01 |
| 9 | 杂多 | 56018 | 32.88 | 95.28 | 4066.4 | 1961-01 |
| 10 | 玉树 | 56029 | 33.00 | 96.96 | 3716.9 | 1961-01 |
| 11 | 玛沁 | 56043 | 34.48 | 100.23 | 3719.0 | 1961-01 |
| 12 | 达日 | 56046 | 33.75 | 99.65 | 3967.5 | 1961-09 |
| 13 | 河南 | 56065 | 34.73 | 101.60 | 3500.0 | 1961-01 |
| 14 | 囊谦 | 56125 | 32.20 | 96.47 | 3643.7 | 1961-12 |
| 15 | 班玛 | 56151 | 32.93 | 100.75 | 3530.0 | 1965-09 |
| 16 | 久治 | 56067 | 33.43 | 101.48 | 3628.5 | 1973-09 |
| 17 | 甘德 | 56045 | 33.96 | 99.89 | 4050.0 | 1975-09 |
| 18 | 治多 | 56016 | 33.85 | 95.62 | 4179.0 | 1980-01 |
| 19 | 曲麻莱 | 56021 | 34.13 | 95.81 | 4175.0 | 1980-01 |
| 20 | 玛多 | 56033 | 34.92 | 98.22 | 4272.3 | 1980-01 |
| 21 | 清水河 | 56034 | 33.80 | 97.13 | 4415.4 | 1989-09 |
3 结果分析
3.1 时空分布特征
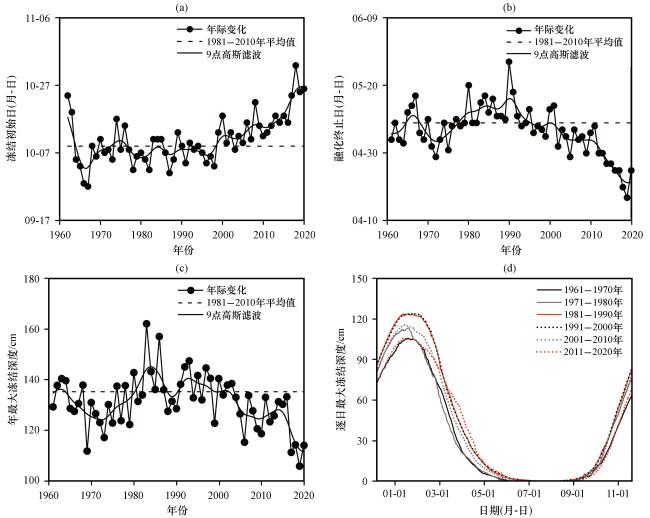
图2 1961 -2020年三江源地区季节性冻土平均冻结初始日(a)、 融化终止日(b)、 年最大冻结深度(c)及逐日最大冻结深度(d)的时间序列Fig.2 Time series of the averaged freezing start date (a), thawing end date (b), annual maximum freezing depth (c) and daily freezing depth (d) of the seasonally frozen ground in the TRS region from 1961 to 2020 |
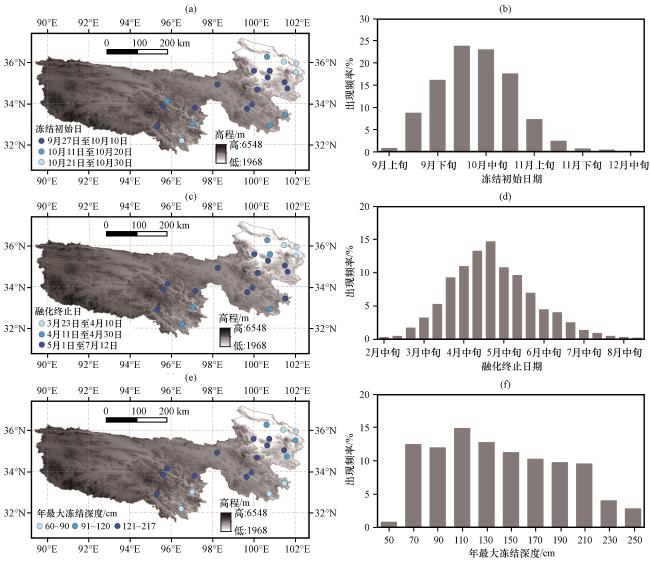
图3 1961 -2020年三江源地区季节性冻土冻结初始日(a, b)、 融化终止日(c, d)、 年最大冻结深度(e, f)平均值空间分布(左)及出现频率分布(右)Fig.3 Spatial distribution of the average value (left) and frequency distribution (right) for the freezing start date (a, b), the thawing end date (c, d) and the annual maximum freezing depth (e, f) of the seasonally frozen ground in the TRS region from 1961 to 2020 |
3.2 冻土冻融与海拔的关系
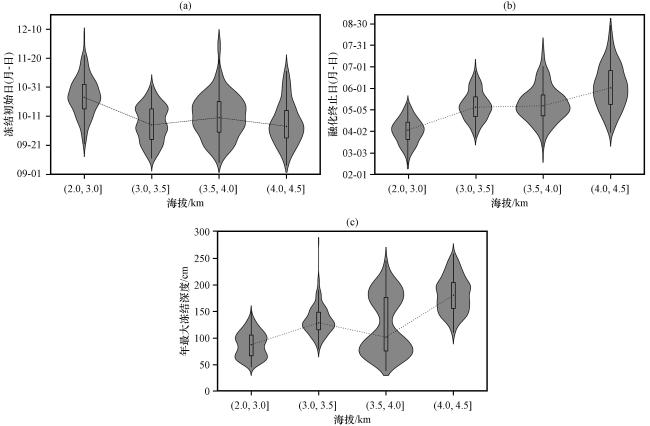
图4 1961 -2020年三江源地区不同海拔范围内冻结初始日(a)、 融化终止日(b)及年最大冻结深度(c)的小提琴图箱图代表每个间隔内的最大值、 最小值、 75%、 25%分位数以及中位数; 灰色阴影区域代表概率密度分布 Fig.4 The violin plots for the freezing start date (a), the thawing end date (b) and the annual maximum freezing depth (c) at different elevation intervals in the TRS region from 1961 to 2020.Boxes represent the maximum, minimum, 75%, 25%, median of the data at individual intervals and the gray shading areas represent the probabilities of samples |
3.3 冻土冻融与气温、 降水的关系
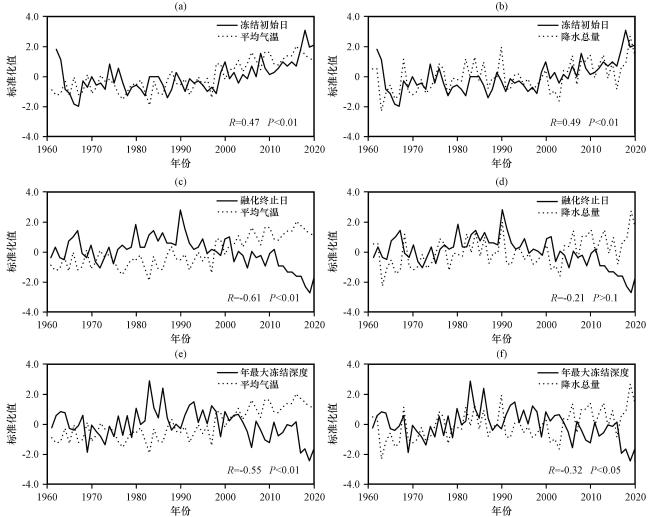
图5 1961 -2020年三江源地区季节性冻土平均冻结初始日(a, b)、 融化终止日(c, d)、 年最大冻结深度(e, f)与2 m平均气温(左)和降水量(右)的标准化序列Fig.5 Time series of the standardized freezing start date (a, b), thawing end date (c, d), annual maximum freezing depth (e, f) of the seasonally frozen ground and the 2-metre air temperature (left), the precipitation (right) in the TRS region from 1961 to 2020 |
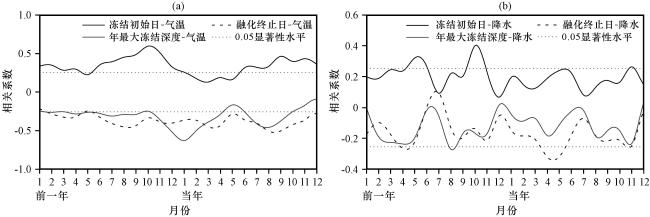
图6 1961 -2020年三江源地区季节性冻土平均冻结初始日、 融化终止日、 年最大冻结深度与逐月平均气温(a)和月降水量(b)的相关图Fig.6 The correlations between the freezing start date, thawing end date, the annual maximum freezing depth of the seasonally frozen ground with the monthly 2-metre air temperature (a) and the precipitation (b) in the TRS region from 1961 to 2020 |
3.4 冻融异常年份北半球500 hPa大气环流特征
表2 三江源地区季节性冻土平均冻结初始日、 融化终止日、 年最大冻结深度异常年份Table 2 Abnormal years of the freezing start date, thawing end date and annual maximum freezing depth of seasonally frozen ground in the TRS region |
| 要素 | 类型 | 年份 |
|---|---|---|
| 冻结初始日 | 异常偏早年 | 1965, 1966, 1967, 1978, 1982, 1987, 1998 |
| 异常偏晚年 | 1962, 1963, 2008, 2017, 2018, 2019, 2020 | |
| 融化终止日 | 异常偏早年 | 1972, 2005, 2014, 2015, 2016, 2017, 2018, 2019, 2020 |
| 异常偏晚年 | 1966, 1967, 1980, 1983, 1984, 1986, 1990, 1991, 2001 | |
| 年最大冻结深度 | 异常偏小年 | 1969, 1973, 2006, 2009, 2010, 2017, 2018, 2019, 2020 |
| 异常偏大年 | 1980, 1983, 1984, 1986, 1992, 1993, 1997 |
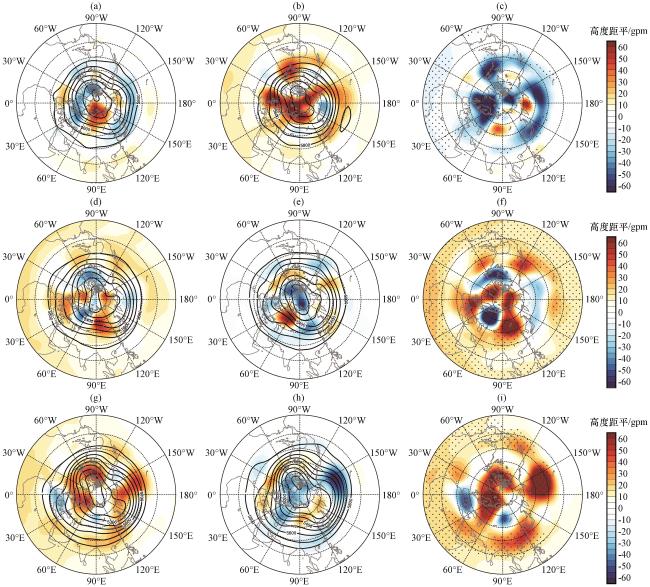


图7 三江源地区冻结初始日异常偏早(a)及偏晚年(b)北半球10月500 hPa高度场(等值线)、 距平场(彩色区)及差值t检验(c); 融化终止日异常偏早(d)及偏晚年(e)北半球4月500 hPa高度场(等值线)、 距平场(彩色区)及差值的t检验(f); 年最大冻结深度异常偏小(g)及偏大年(h)北半球1月500 hPa高度场(等值线)、 距平场(彩色区)及差值的t检验(i)(单位: gpm)点状阴影区表示差值通过0.05的显著性水平检验 Fig.7 The composites of 500 hPa geopotential height (lines) and anomalies map (color area) in the northern hemisphere in October of earlier (a) and later (b) years for the freezing start date and their difference with t-test (c), in April of earlier (d) and later (e) years for the thawing end date and their difference with t-test (f), in January of smaller (g) and larger (h) years for the annual maximum freezing depth and their difference with t-test (i).Unit: gpm.Dotted shadows that the difference passed 0.05 significance level |