

1 引言
2 资料来源与研究方法
2.1 研究区概况
2.2 资料概况
2.3 数据预处理及研究方法
2.3.1 NDVI数据预处理
2.3.2 植被覆盖度的计算
2.3.3 趋势分析
2.3.4 相关分析
2.3.5 多元线性回归
3 结果分析
3.1 植被覆盖度的时空变化特征
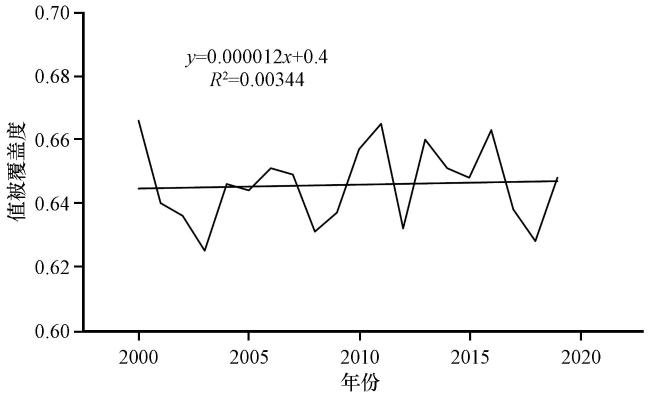
图2 2000 -2019年若尔盖湿地植被生长季(5 -9月)植被覆盖度变化趋势Fig.2 Change trend of vegetation coverage in the growing season (May to September) of Zoige wetland from 2000 to 2019 |
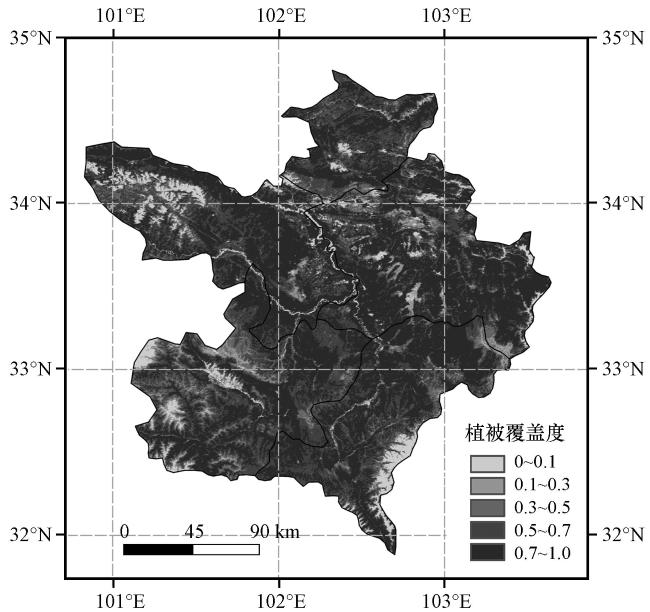
图3 2000 -2019年若尔盖湿地植被生长季(5 -9月)植被覆盖度均值分级Fig.3 Average fractional plot of vegetation coverage in the growing season (May to September) of Zoige wetland from 2000 to 2019 |
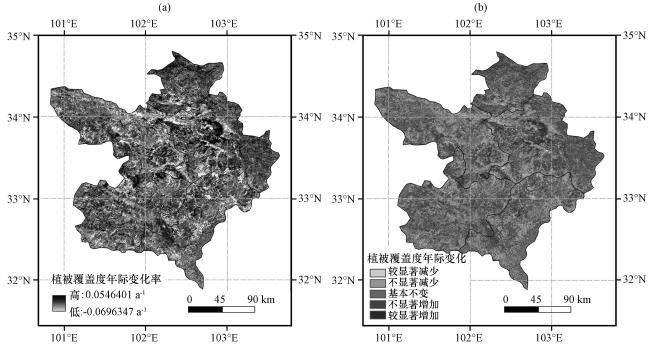
表1 2000 -2019年若尔盖湿地植被生长季(5 -9月)植被覆盖度面积Table 1 The area of vegetation coverage in the growing season (from May to September) of Zoige Wetland from 2000 to 2019 |
| 植被覆盖情况 | 面积/km2 | 占比 |
|---|---|---|
| 无植被覆盖(0~0.1) | 1643.44 | 4.16% |
| 低植被覆盖(0.1~0.3) | 1902.56 | 4.82% |
| 较低植被覆盖(0.3~0.5) | 4218.63 | 10.69% |
| 较高植被覆盖(0.5~0.7) | 12173.31 | 30.84% |
| 高植被覆盖(0.7~1) | 19539.06 | 49.49% |
表2 2000 -2019年若尔盖湿地植被生长季(5 -9月)植被覆盖度面积变化趋势Table 2 area change trend of vegetation coverage in the growing season (from May to September) of Zoige wetland from 2000 to 2019 |
| 植被覆盖度变化趋势 | 面积/km2 | 占比 |
|---|---|---|
| 较显著减少 | 388.69 | 0.99% |
| 不显著减少 | 10209.13 | 25.86% |
| 几乎不变 | 17790.99 | 45.07% |
| 不显著增加 | 10657.00 | 26.99% |
| 较显著增加 | 431.19 | 1.09% |
3.2 气候因子的时空变化特征
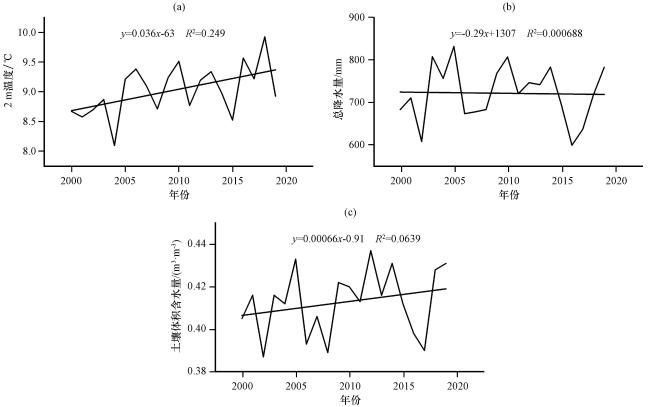
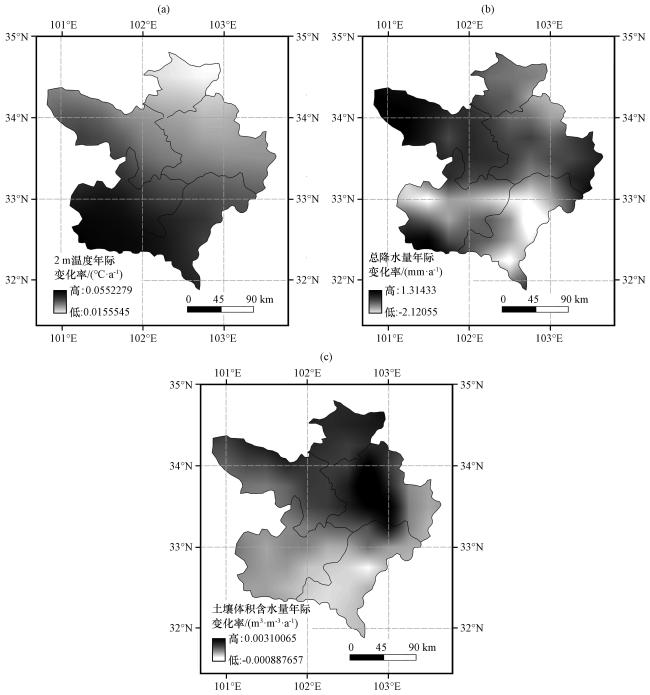
图6 2000 -2019年若尔盖湿地植被生长季(5 -9月)2 m温度(a, 单位: ℃·a-1)、 总降水量(b, 单位: mm·a-1)和土壤体积含水量(c, 单位: m³·m-3·a-1)年际变化率分布Fig.6 The annual change of temperature (a, unit: ℃·a-1), total precipitation (b, unit: mm·a-1) and soil water content (c, unit: m³·m-³·a-1) during the vegetation growing season (from May to September) in Zoige wetland from 2000 to 2019 |
3.3 植被覆盖度与气候因子的关系
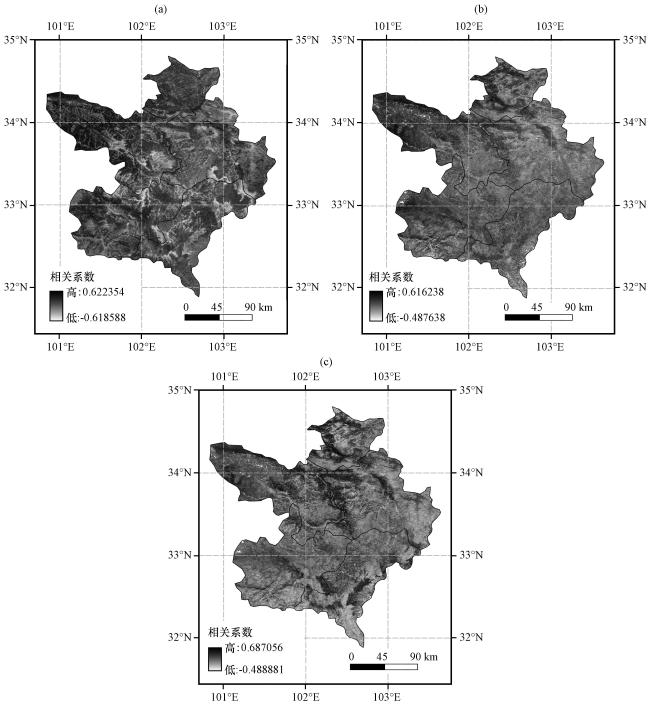


图7 2000 -2019年若尔盖湿地植被生长季(5 -9月)植被覆盖度与温度(a)、 总降水量(b)、 土壤体积含水量(c)的相关系数分布Fig.7 Spatial distribution of correlation coefficients between vegetation coverage and temperature (a), total precipitation (b) and soil water content (c) in the growing season (from May to September) of Zoige wetland from 2000 to 2019 |
表3 2000—2019年若尔盖湿地植被生长季(5—9月)植被覆盖度与气候因子多元线性回归的系数统计Table 3 Coefficient statistics of multiple linear regression between vegetation coverage and climate factors during vegetation growing season (from May to September) in Zoige wetland from 2000 to 2019 |
| 模型参数 | 未标准化系数 | 标准化系数 | t | 显著性水平 | |
|---|---|---|---|---|---|
| B | 标准误差 | Beta | |||
| 常量 | 0.321 | 0.064 | 5.022 | 0.000 | |
| 2 m温度 | 0.012 | 0.001 | 0.601 | 7.955 | 0.000 |
| 总降水量 | 3.943×10⁻⁵ | 0.000 | 0.028 | 0.273 | 0.786 |
| 土壤体积含水量 | 0.508 | 0.179 | 0.289 | 2.833 | 0.006 |
表4 2000—2019年若尔盖湿地植被生长季(5—9月)植被覆盖度与气候因子多元线性回归模型参数评估Table 4 Model parameter evaluation of multiple linear regression between vegetation coverage and climate factors during vegetation growing season (May to September) in Zoige wetland from 2000 to 2019 |
| R | R 2 | 调整后R 2 | 标准估算的误差 |
|---|---|---|---|
| 0.684 | 0.468 | 0.451 | 0.033 |