
1 引言
2 资料选取和方法介绍
2.1 资料选取
表1 18个CMIP6模式概况Table 1 A introduction of 18 CMIP6 models |
| 模式名称 | 国家 | 水平分辨率 (nlon×nlat) | 陆面过程模式 |
|---|---|---|---|
| ACCESS-CM2 | 澳大利亚 | 1.25°×1.875° | CABLE2.5 |
| ACCESS-ESM1-5 | 澳大利亚 | 1.875°×1.24° | CABLE2.4 |
| CanESM5 | 加拿大 | 2.8°×2.8° | CLASS3.6\CTEM1.2 |
| CAS-ESM2-0 | 中国 | 1.41°×1.41° | CoLM |
| CESM2-WACCM | 美国 | 1.25°×0.94° | CLM5 |
| CIESM | 中国 | 1.25°×0.94° | CIESM-LM1.0 |
| CMCC-CM-SR5 | 意大利 | 1.25°×0.9375° | CLM4.5 |
| CMCC-ESM2 | 意大利 | 1.25°×0.9375° | CLM4.5 |
| EC-Earth3 | 欧盟 | 0.7°×0.7° | HTESSEL |
| EC-Earth3-Veg | 欧盟 | 0.7°×0.7° | HTESSEL |
| EC-Earth3-Veg-LR | 欧盟 | 1.125°×1.125° | HTESSEL |
| FGOALS-f3-L | 中国 | 1.25°×1° | CLM4.0 |
| GFDL-ESM4 | 美国 | 1.25°×1° | GFDL-LM4.1 |
| IPSL-CM6A-LR | 法国 | 2.5°×1.26° | ORCHIDEE |
| KIOST-ESM | 韩国 | 1.875°×1.875° | CLM4 |
| MIROC6 | 日本 | 1.41°×1.41° | MATSIRO6.0 |
| MPI-ESM1-2-LR | 德国 | 1.875°×1.875° | JSBACH3.20 |
| MRI-ESM2-0 | 日本 | 1.125°×1.125° | HAL 1.0 |
2.2 方法介绍
3 青藏高原近地面气温、 积雪深度分析和冻土面积评估
3.1 近地面气温、 积雪深度变化分析
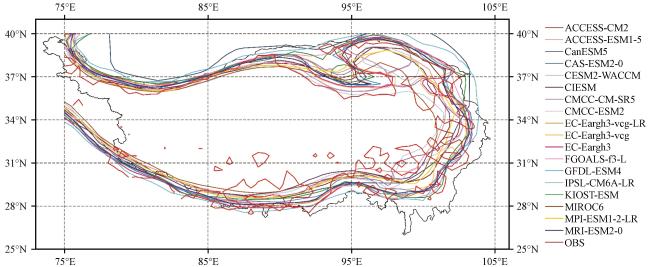
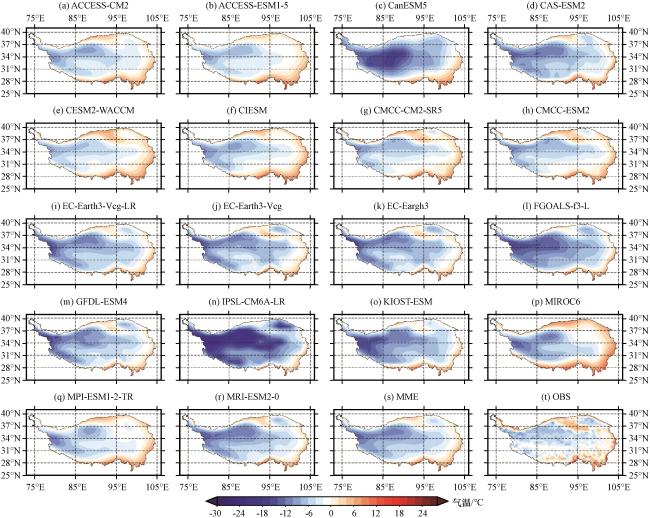
图2 各模式与观测资料在1985 -2014年年均气温空间分布Fig.2 Spatial distributions of annual mean temperature over the Qinghai-Xizang Plateau during 1985 -2014 in each model and observation |
表2 1985 -2014年CMIP6模式模拟的近地面气温与观测值的相关系数和RMSETable 2 Correlation coefficients and RMSEs of the simulated surface-air temperature with the CMIP6 models and observation over the QXP during 1985 -2014 |
| 模式名称 | 时间相关 系数 | 空间相关 系数 | RMSE /℃ |
|---|---|---|---|
| ACCESS-CM2 | 0.495* | 0.631 | 1.112 |
| ACCESS-ESM1-5 | 0.600* | 0.617 | 0.506 |
| CanESM5 | 0.744* | 0.555 | 5.260 |
| CAS-ESM2-0 | 0.671* | 0.647 | 3.581 |
| CESM2-WACCM | 0.787* | 0.687 | 0.429 |
| CIESM | 0.226 | 0.652 | 0.766 |
| CMCC-CM-SR5 | 0.578* | 0.694 | 0.786 |
| CMCC-ESM2 | 0.353 | 0.694 | 1.025 |
| EC-Earth3-LR | 0.374 | 0.665 | 3.748 |
| EC-Earth3-Veg | 0.329 | 0.726 | 3.584 |
| EC-Earth3 | 0.528* | 0.727 | 4.073 |
| FGOALS-f3-L | 0.529* | 0.683 | 5.257 |
| GFDL-ESM4 | 0.219 | 0.699 | 3.798 |
| IPSL-CM6A-LR | 0.581* | 0.701 | 9.460 |
| KIOST-ESM | 0.637* | 0.600 | 4.432 |
| MIROC6 | 0.352 | 0.560 | 0.720 |
| MPI-ESM1-2-LR | 0.550 | 0.561 | 0.818 |
| MRI-ESM2-0 | 0.053 | 0.701 | 3.411 |
| MME | 0.766* | 0.684 | 2.862 |
*表示通过了0.01水平显著性检验 |
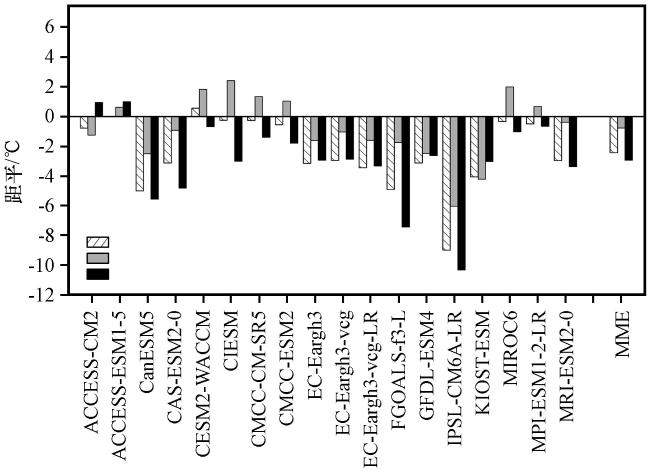
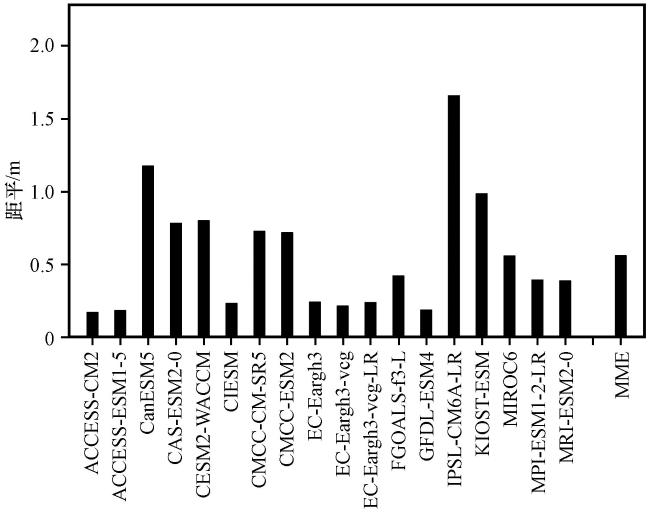
图4 1985 -2014年各模式、 多模式集合平均的年平均气温、 年均最高和最低气温与观测资料的距平Fig.4 The anomalies between the average annual average temperature, the average annual maximum and minimum temperature of each model and multi-model ensemble (MME) and the observation data from 1985 to 2014 |
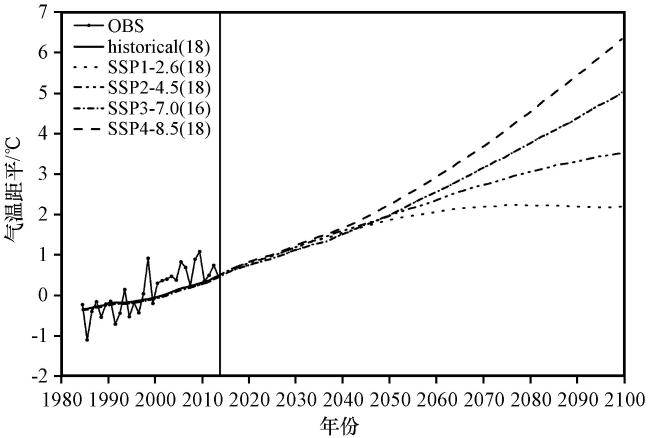
3.2 青藏高原气温变化趋势分析
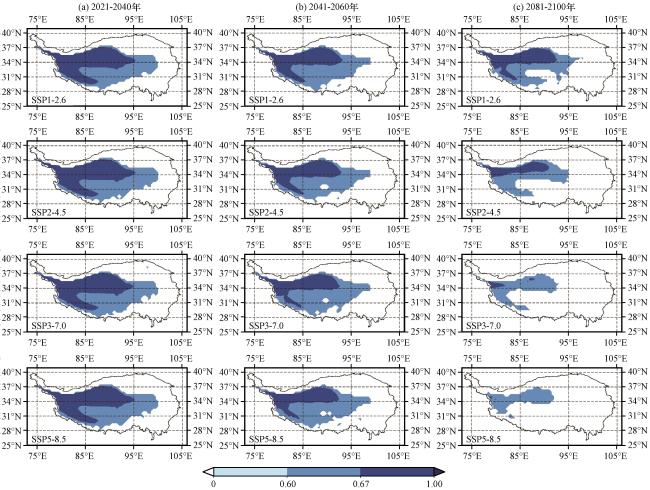
3.3 青藏高原多年冻土面积的评估
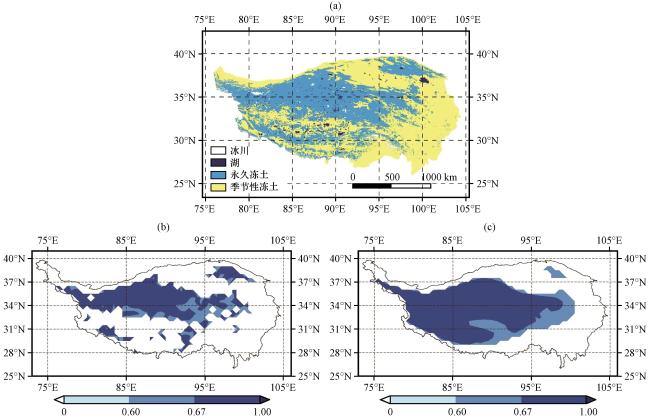
图7 青藏高原多年冻土分布现状图件(2003)(引自牛富俊和尹国安, 2018)(a)、 观测资料模拟的1985 -2014年多年冻土分布(b)和多模式集合平均模拟的1985 -2014年多年冻土分布(c)Fig.7 Map of the frozen soil in the Tibetan Plateau (2003) (From Niu and Yin, 2018)(a)、 Permafrost distribution during 1985 -2014 simulated by observation(b) and Permafrost distribution during 1985 -2014 simulated by multi-model ensemble mean on Qinghai-Xizang Plateau |