
1 引言
2 研究区域及研究模型
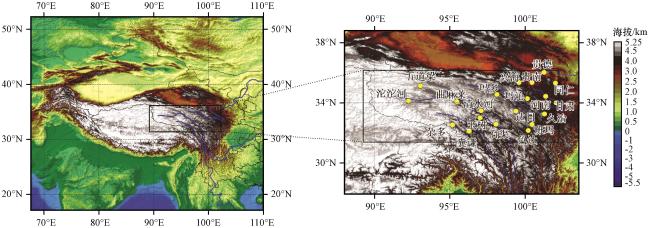
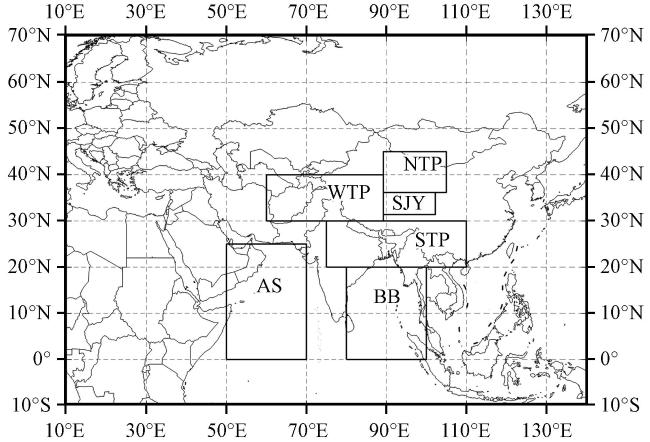
2.1 研究区域概况
2.2 降水观测数据
2.3 研究模型和参数设置
3 研究方法
3.1 降水异常的分析方法
3.2 水汽蒸发源地的计算方法
3.3 潜在水汽源地对研究区域降水量贡献率的计算方法
4 结果分析
4.1 月降水异常分析
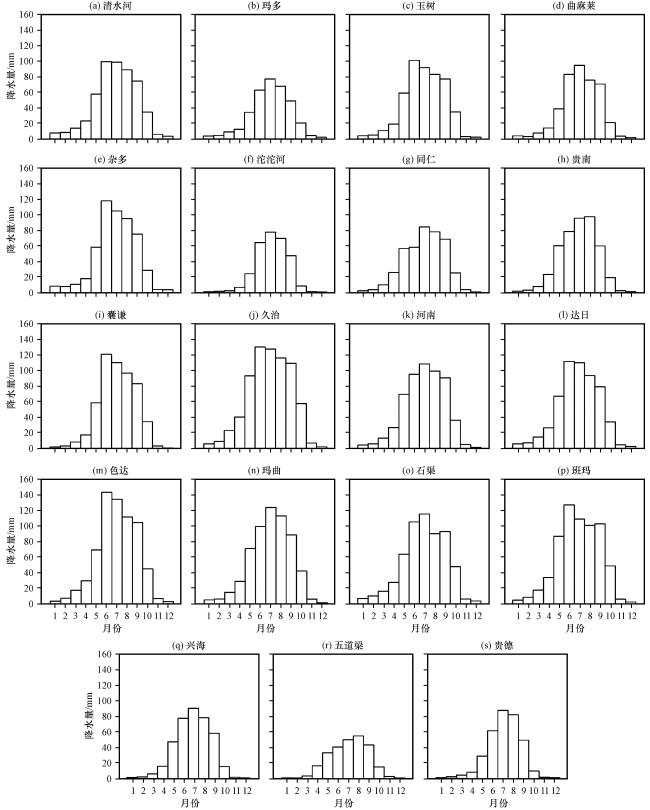
图2 1994 -2019年三江源区域各站点月平均降水量Fig.2 Monthly average precipitation of each station in the Sanjiangyuan region from 1994 to 2019 |
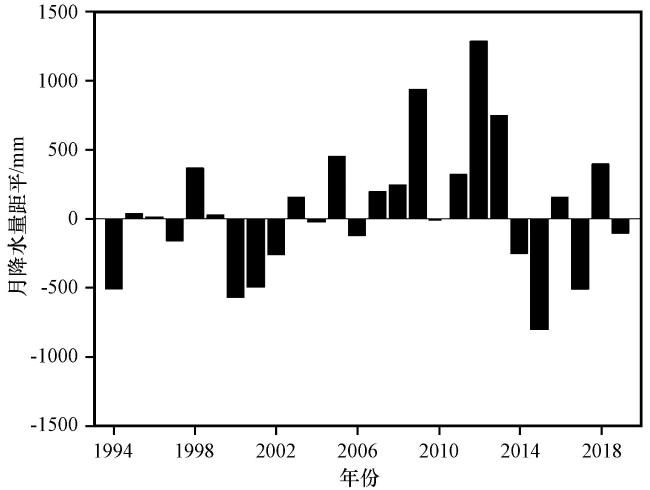
图3 1994 -2019年三江源区域平均7月降水量的距平序列Fig.3 Anomaly sequence of the average July precipitation in Sanjiangyuan region from 1994 to 2019 |
表1 2012年7月和2015年7月三江源区域降水分类Table 1 Classification of precipitation in Sanjiangyaun region in July 2012 and July 2015 |
| 日期 | 降水类型 | 时长 /月 | 降水量 /mm | 降水 占比/% |
|---|---|---|---|---|
| 2012年7月 | 小型降水(S) | 4 | 5.75 | 5.0 |
| 中型降水(M) | 7 | 38.65 | 34.1 | |
| 大型降水(L) | 20 | 68.92 | 61.9 | |
| 2015年7月 | 小型降水(S) | 16 | 6.17 | 10.0 |
| 中型降水(M) | 7 | 11.69 | 19.0 | |
| 大型降水(L) | 9 | 43.59 | 71.0 |
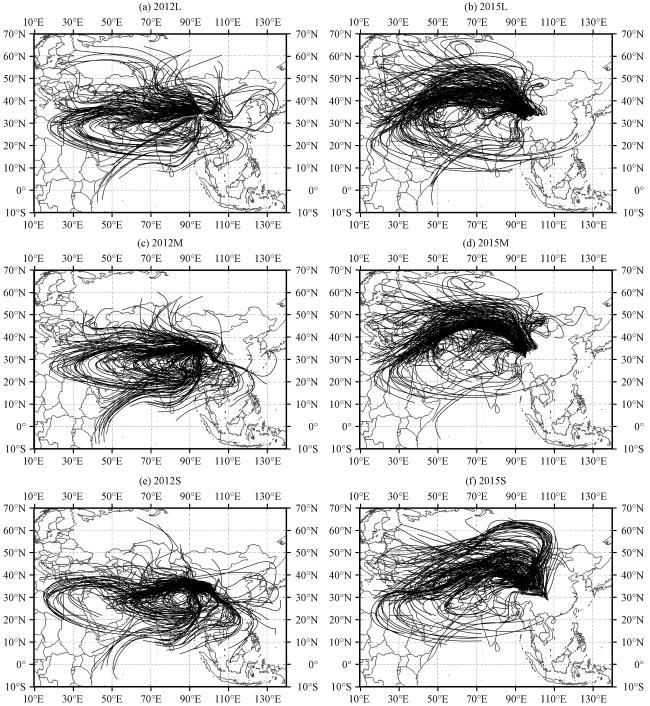
4.2 降水异常对应的水汽传输路径
4.3 潜在水汽源地的蒸发特征
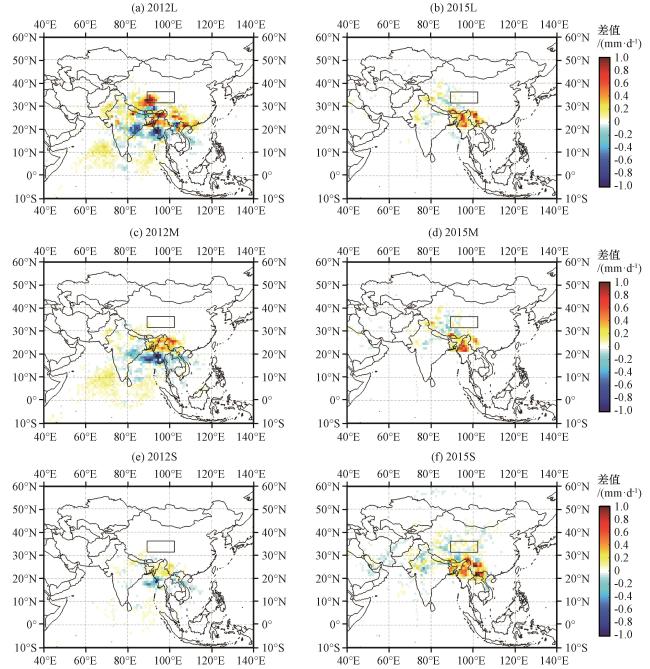
图5 2012年7月和2015年7月三江源区域内三类降水类型(L, M和S)对应的面积平均的蒸发和降水的差值(E-P)(单位: mm·d-1)矩形为三江源区域 Fig.5 The difference in area average evaporation and precipitation (E-P) corresponding to the three types of precipitation (large precipitation L, medium precipitation M, and small precipitation S) in Sanjiangyuan region in July 2012 and July 2015.Unit: mm·d-1.The rectangle is the Sanjiangyuan area |
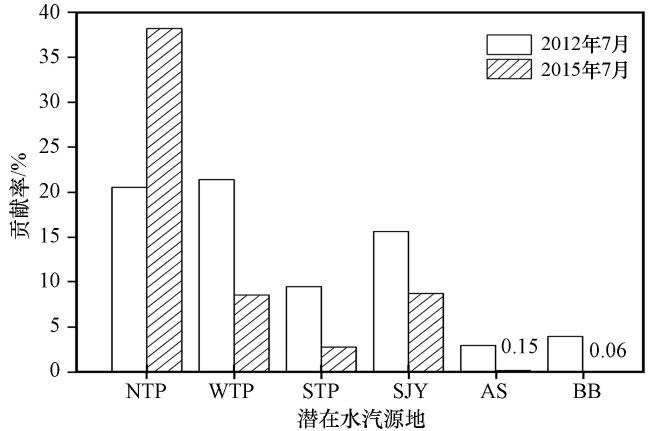
4.4 不同水汽潜在源地对三江源区域降水的贡献
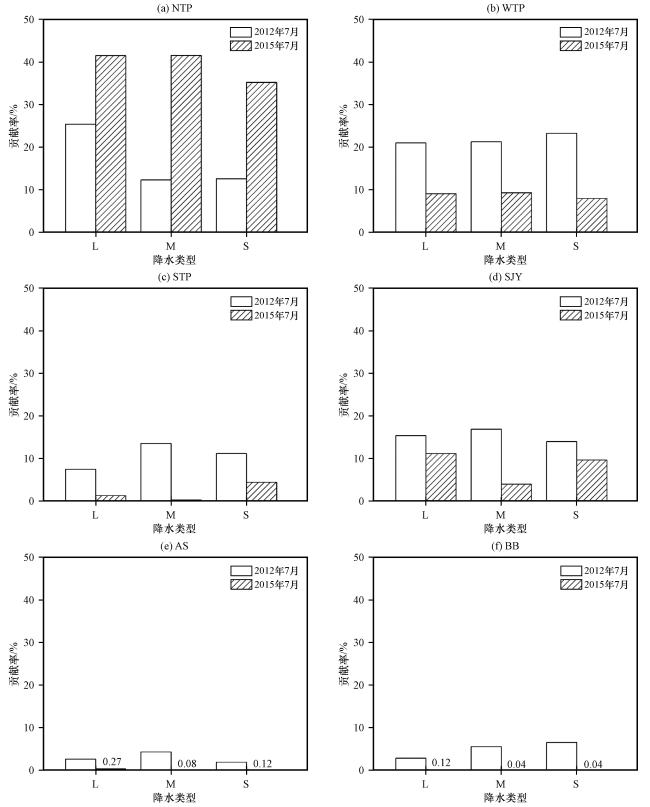
图8 各水汽潜在源地分别对三江源区域2012年7月和2015年7月三类降水类型(大型降水L, 中型降水M, 小型降水S)的贡献率Fig.8 The contribution rate of each potential source of water vapor to the three types of precipitation (large precipitation L, medium precipitation M, and small precipitation S) in Sanjiangyuan region in July 2012 and July 2015, respectively |