
1 引言
2 资料来源和方法介绍
3 引起陕北暴雨的西北涡时空分布特征
表1 2010 -2019年陕北暴雨个例逐月分布Table 1 Monthly distribution of torrential rains in northern Shaanxi from 2010 to 2019 |
| 气象要素 | 5月 | 6月 | 7月 | 8月 | 9月 | 10月 | 总计 |
|---|---|---|---|---|---|---|---|
| 暴雨/次 | 0 | 1 | 22 | 14 | 3 | 1 | 41 |
| 西北涡暴雨/次 | 0 | 0 | 8 | 6 | 1 | 0 | 15 |
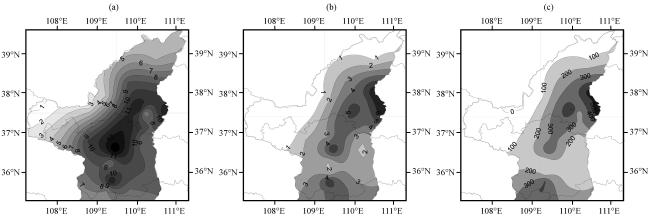
图1 2010 -2019年陕北各气象站暴雨日数 (a, 单位: d)、 西北涡暴雨日数 (b, 单位: d)和西北涡暴雨总雨量 (c, 单位: mm) 分布Fig.1 Days of torrential rain (a, unit: d), days of torrential rain caused by Northwest vortex (b, unit: d) and precipitation of torrential rain caused by Northwest vortex (c, unit: mm) in northern Shaanxi from 2010 to 2019 |
表2 2010 -2019年陕北西北涡暴雨个例Table 2 Torrential rain cases caused by Northwest vortex in northern Shaanxi from 2010 to 2019 |
| 出现日期 (年-月-日) | 暴雨 站数/个 | 最大 日降雨量/mm | 主要降水时段 | 其他影响系统 |
|---|---|---|---|---|
| 2010-07-23 | 7 | 131.3 | 23日上午和24日凌晨 | 500 hPa两高之间低压、 西南低空急流、 台风“灿都” |
| 2010-08-18 | 4 | 83.8 | 18日凌晨至傍晚 | 500 hPa西风槽、 副高外围西南气流、 西南低空急流 |
| 2010-08-21 | 8 | 81.7 | 21日凌晨至上午 | 500 hPa两高之间西风槽、 西南低空急流 |
| 2011-08-20 | 3 | 64.2 | 20日清晨至21日凌晨 | 500 hPa两高合并北侧纬向气流、 低层偏东风 |
| 2012-07-28 | 3 | 63.8 | 28日凌晨 | 500 hPa高空槽、 西南低空急流 |
| 2013-07-04 | 4 | 81.6 | 3日夜间至4日凌晨 | 500 hPa东北冷涡后部西风槽、 850 hPa低涡 |
| 2013-07-25 | 6 | 140.5 | 25日清晨至下午 | 500 hPa副高外围西南气流、 南海热带气旋 |
| 2014-09-11 | 6 | 84.3 | 10日夜间至11日下午 | 500 hPa副高北侧纬向气流、 850 hPa低涡、 偏东风急流 |
| 2016-07-08 | 8 | 117.0 | 8日凌晨至9日中午 | 500 hPa低压、 850 hPa低涡、 低层偏东气流、 台风“尼伯特” |
| 2017-07-26 | 7 | 206.6 | 26日凌晨至清晨 | 500 hPa副高外围西南气流、 西南低空急流、 台风“桑卡”“洛克” |
| 2017-08-22 | 4 | 105.4 | 22日凌晨至下午 | 500 hPa副高西北侧西南气流、 西南低空急流、 台风“天鸽” |
| 2018-07-16 | 2 | 58.2 | 15日夜间和16日傍晚 | 500 hPa副高外围西南气流、 西南低空急流 |
| 2018-08-31 | 2 | 73.2 | 30日夜间 | 500 hPa副高外围西南气流、 南海热带气旋 |
| 2019-07-22 | 8 | 100.3 | 21日夜间至22日清晨 | 500 hPa西风槽、 850 hPa低涡、 西南低空急流 |
| 2019-08-03 | 7 | 81.1 | 3日清晨至傍晚 | 500 hPa低压、 西南低空急流、 850 hPa低涡、 台风“韦帕” |
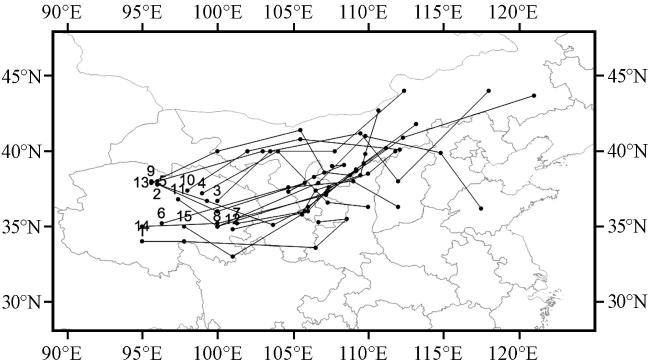
4 西北涡东移路径
5 环流场特征
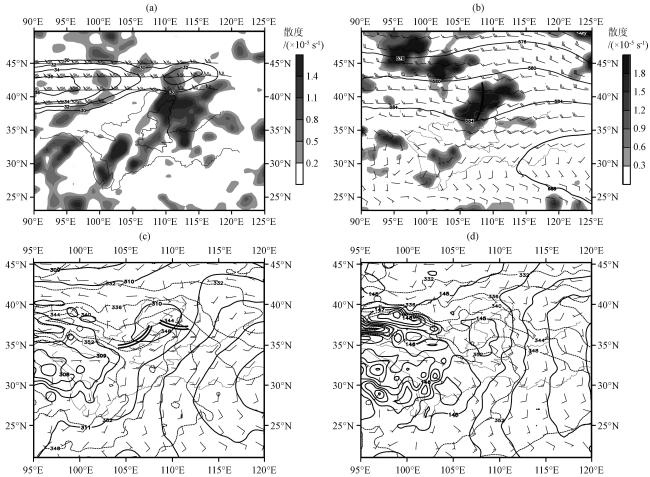
图3 2010 -2019年陕北西北涡暴雨的200 hPa急流(风羽和实线, 单位: m·s-1)和散度(阴影, 单位: ×10-5 s-1)(a), 500 hPa位势高度(实线, 单位: dagpm)、 风场(风羽, 单位: m·s-1)和涡度(阴影, 单位: ×10-5 s-1)(b), 以及700 hPa (c)和850 hPa (d)位势高度(实线, 单位: dagpm)、 风场(风羽, 单位: m·s-1)和假相当位温(虚线, 单位: K)(b)中单实线为500 hPa高空槽线; (c)中双实线为700 hPa切变线 Fig.3 200 hPa upper-level jet (barb and solid line, unit: m·s-1) and divergence (shaded, unit: ×10-5 s-1) (a), 500 hPa geopotential height (solid line, unit: dagpm), wind field (barb, unit: m·s-1) and vorticity (shaded, unit: ×10-5 s-1) (b), 700 hPa (c) and 850 hPa (d) geopotential height (solid line, unit: dagpm), wind field (barb, unit: m·s-1) and pseudo-equivalent potential temperature (dotted line, unit: K) during torrential rains caused by Northwest vortex in northern Shaanxi from 2010 to 2019.Single solid line is 500 hPa trough in (b) and double solid line is 700 hPa shear line in (c) |
6 西北涡结构特征
6.1 散度场和涡度场特征
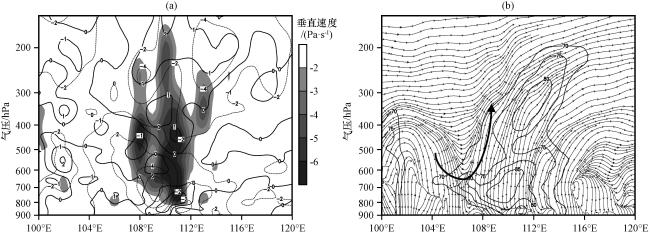
图4 2010 -2019年陕北西北涡暴雨沿38°N的散度(实线, 单位: ×10-5 s-1)、 涡度(虚线, 单位: ×10-5 s-1)和垂直速度(阴影, 单位: Pa·s-1)(a), 以及相对湿度(实线, 单位: %)和流场(流线, v单位: m·s-1, w单位: ×10-2 m·s-1)(b)的垂直剖面图(b)中黑色粗箭头表示垂直环流 Fig.4 Vertical cross sections of divergence (solid line, unit: ×10-5 s-1), vorticity(dotted line, unit: ×10-5 s-1) and vertical velocity (shaded, unit: Pa·s-1) (a) and relative humidity (solid line, unit: %) and flow field (streamline, v-unit: m·s-1, w-unit: ×10-2 m·s-1) (b) along 38°N during torrential rains caused by Northwest vortex in northern Shaanxi from 2010 to 2019.Black arrow indicates vertical circulation in (b) |
6.2 假相当位温和锋生场特征
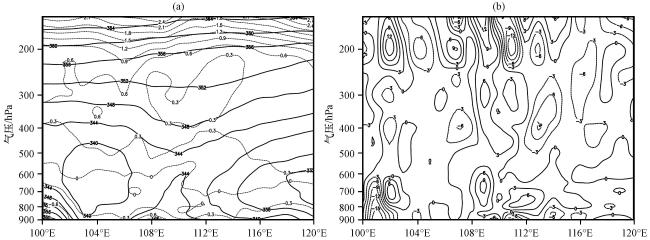
图5 2010 -2019年陕北西北涡暴雨沿38°N的假相当位温(实线, 单位: K)和湿位涡(虚线, 单位: PVU)(a)以及锋生函数(单位: ×10-10 K·m-1·s-1)(b)的垂直剖面Fig.5 Vertical cross sections of pseudo-equivalent potential temperature (solid line, unit: K), wet potential vorticity (dotted line, unit: PVU) (a) and frontgenesis function (unit: ×10-10 K·m-1·s-1) (b) along 38°N during torrential rains caused by Northwest vortex in northern Shaanxi from 2010 to 2019 |
7 西北涡水汽特征
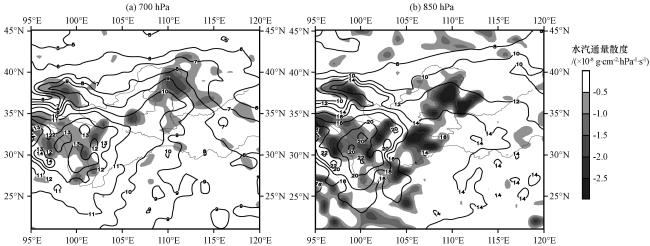
图6 2010 -2019年陕北西北涡暴雨700 hPa(a)和850 hPa(b)比湿(实线, 单位: g·kg-1)和水汽通量散度(阴影, 单位: ×10-8 g·cm-2·hPa-1·s-1)分布Fig.6 700 hPa (a) and 850 hPa (b) specific hunidity (solid line, unit: g·kg-1) and moisture flux divergence (the shaded, unit: ×10-8 g·cm-2·hPa-1·s-1) during torrential rains caused by Northwest vortex in northern Shaanxi from 2010 to 2019 |
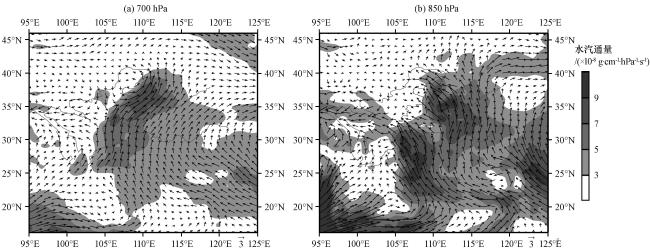
图7 2010 -2019年陕北西北涡暴雨700 hPa(a)和850 hPa(b)水汽通量(阴影和矢量, 单位: ×10-8 g·cm-1·hPa-1·s-1)分布Fig.7 The distribution of 700 hPa (a) and 850 hPa (b) moisture flux (shaded and vector, unit: ×10-8 g·cm-1·hPa-1·s-1) during torrential rains caused by Northwest vortex in northern Shaanxi from 2010 to 2019 |