
1 引言
2 数据选取与方法介绍
2.1 模式介绍与设置
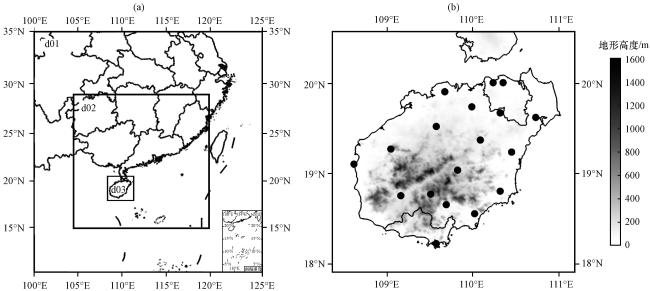
表1 数值模式试验Table 1 Numerical simulation test |
| 数值试验 | 植被覆盖度 | 土地利用 | 地形 | 土壤类型 |
|---|---|---|---|---|
| BASE | MODIS FPAR | 2001年MODIS | GMTED2010 | FAO 5 min |
| SEN1 | 2013年MODIS | 2001年MODIS | GMTED2010 | FAO 5 min |
| SEN2 | MODIS FPAR | 2013年MODIS | GMTED2010 | FAO 5 min |
| SEN3 | MODIS FPAR | 2001年MODIS | SRTM3 | FAO 5 min |
| SEN4 | MODIS FPAR | 2001年MODIS | GMTED2010 | HWSD |
| SEN5 | 2013年MODIS | 2013年MODIS | SRTM3 | HWSD |
2.2 下垫面数据集
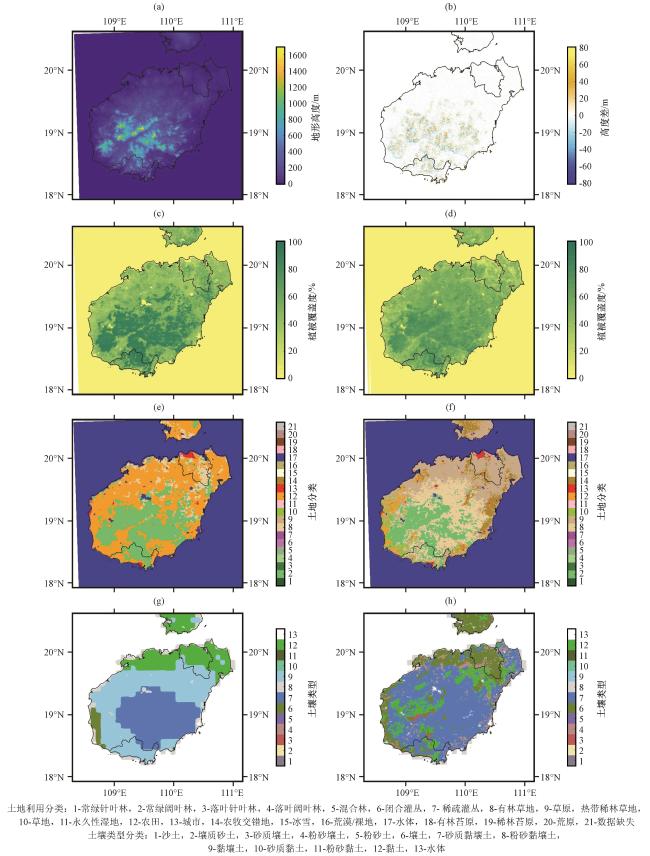
图2 WRF模式默认地形(a)及SRTM与默认地形的差异(b), WRF模式默认的植被覆盖度(c)和更新的植被覆盖度(d), WRF模式默认的土地利用(e)和更新的土地利用(f), WRF模式默认的土壤类型(g)和更新的土壤类型(h)资料的对比Fig.2 The default terrain (a) and the difference between SRTM and default terrain (b), the comparison of default vegetation fraction (c) and newly vegetation fraction (d), default land use (e) and newly land use (f), default soil type (g) and newly soil type (h) |
2.3 模式评估
3 结果与讨论
3.1 近地面温度
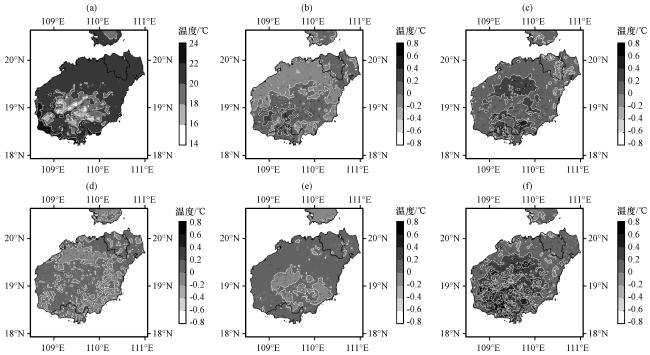
图3 BASE试验模拟2013年2月平均2 m温度(a)和各敏感性试验[SEN1(b), SEN2(c), SEN3(d), SEN4(e)和SEN5(f)]与BASE试验模拟2 m温度的差异(单位: ℃)Fig.3 The 2 m average temperature of BASE (a), and the mean 2 m temperature change between BASE and different sensitivity tests: SEN1 (b), SEN2 (c), SEN3 (d), SEN4 (e) and SEN5 (f) in February 2013.Unit: ℃ |
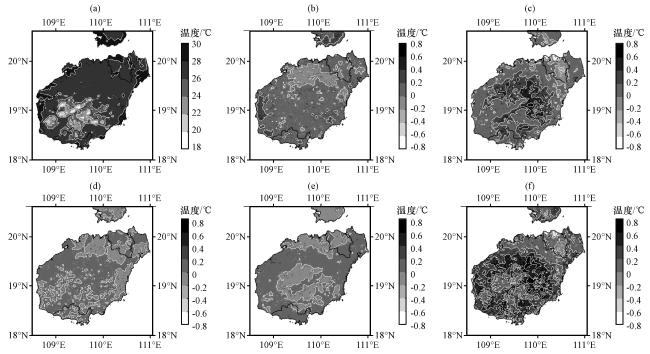
图4 BASE试验模拟2013年7月平均2 m温度(a)和各敏感性试验[SEN1(b), SEN2(c), SEN3(d), SEN4(e)和SEN5(f)]与BASE试验模拟2 m温度的差异(单位: ℃)Fig.4 The 2 m average temperature of BASE (a), and the mean 2 m temperature change between BASE and different sensitivity tests: SEN1 (b), SEN2 (c), SEN3 (d), SEN4 (e) and SEN5 (f) in July 2013.Unit: ℃ |
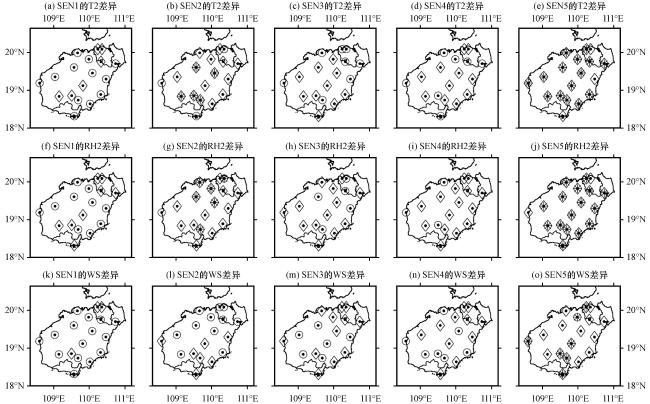
图5 BASE试验与敏感性试验(SEN1~SEN5)模拟的2013年2月各气象因子RMSE的比较圆点代表各气象站点, 菱形代表有改进, 空心圆代表模拟效果变差, 星号代表RMSE变化显著 Fig.5 Comparison of RMSE between BASE and sensitivity simulation (SEN1-SEN5) for different meteorological factors in February 2013 |
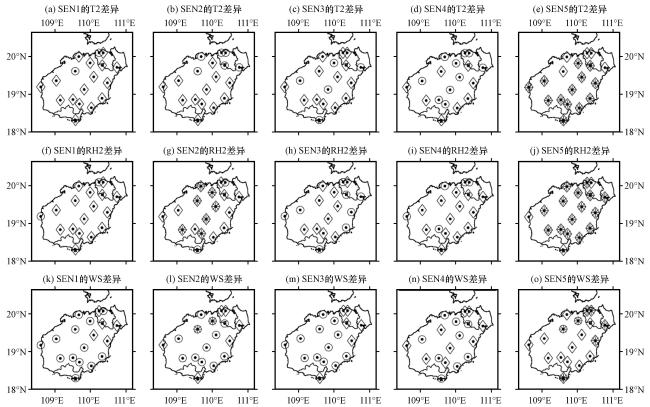
图6 BASE试验与敏感性试验(SEN1~SEN5)模拟2013年7月各气象因子RMSE的比较圆点代表各气象站点, 菱形代表有改进, 空心圆代表模拟效果变差, 星号代表RMSE变化显著 Fig.6 Comparison of RMSE between BASE and sensitivity simulation (SEN1~SEN5) for different meteorological factors in July 2013. Dots represent weather stations, diamonds represent improvements, open circles represent worsening simulation effects, and asterisks represent significant changes in RMSE |
表2 2013年2月模式模拟的T2, RH2, WS的统计结果Table 2 Statistic performance of simulated T2, RH2 and WS in February 2013 |
| R | RMSE | MB | HR/% | IA | ||
|---|---|---|---|---|---|---|
| T2 | BASE | 0.870 | 1.728 ℃ | -0.863 ℃ | 76.90 | 0.902 |
| SEN1 | 0.870 | 1.723 ℃ | -0.852 ℃ | 77.27 | 0.903 | |
| SEN2 | 0.875 | 1.617 ℃ | -0.685 ℃ | 80.21 | 0.915 | |
| SEN3 | 0.868 | 1.728 ℃ | -0.852 ℃ | 77.11 | 0.902 | |
| SEN4 | 0.869 | 1.714 ℃ | -0.827 ℃ | 77.36 | 0.904 | |
| SEN5 | 0.875 | 1.603 ℃ | -0.650 ℃ | 80.56 | 0.916 | |
| RH2 | BASE | 0.799 | 8.584 % | 3.109 % | 78.17 | 0.861 |
| SEN1 | 0.802 | 8.520 % | 3.068 % | 78.46 | 0.864 | |
| SEN2 | 0.798 | 8.196 % | 1.675 % | 80.45 | 0.881 | |
| SEN3 | 0.800 | 8.563 % | 3.038 % | 78.33 | 0.862 | |
| SEN4 | 0.800 | 8.478 % | 2.862 % | 78.70 | 0.864 | |
| SEN5 | 0.810 | 8.060 % | 1.506 % | 81.32 | 0.885 | |
| WS | BASE | 0.522 | 2.382 m·s-1 | 1.464 m·s-1 | 33.90 | 0.636 |
| SEN1 | 0.529 | 2.315 m·s-1 | 1.396 m·s-1 | 35.14 | 0.646 | |
| SEN2 | 0.522 | 2.328 m·s-1 | 1.393 m·s-1 | 35.23 | 0.643 | |
| SEN3 | 0.525 | 2.388 m·s-1 | 1.472 m·s-1 | 33.04 | 0.637 | |
| SEN4 | 0.522 | 2.386 m·s-1 | 1.471 m·s-1 | 33.48 | 0.635 | |
| SEN5 | 0.533 | 2.291 m·s-1 | 1.365 m·s-1 | 35.96 | 0.652 | |
表3 2013年7月模式模拟的T2, RH2, WS的统计结果Table3 Statistic performance of simulated T2, RH2 and WS in July 2013 |
| R | RMSE | MB | HR/% | IA | ||
|---|---|---|---|---|---|---|
| T2 | BASE | 0.790 | 1.829 ℃ | 0.381 ℃ | 77.17 | 0.864 |
| SEN1 | 0.793 | 1.720 ℃ | 0.471 ℃ | 79.78 | 0.878 | |
| SEN2 | 0.789 | 1.784 ℃ | 0.633 ℃ | 78.18 | 0.870 | |
| SEN3 | 0.790 | 1.717 ℃ | 0.388 ℃ | 80.05 | 0.879 | |
| SEN4 | 0.790 | 1.716 ℃ | 0.402 ℃ | 79.96 | 0.879 | |
| SEN5 | 0.791 | 1.711 ℃ | 0.756 ℃ | 79.94 | 0.880 | |
| RH2 | BASE | 0.702 | 10.047 % | 0.026 % | 72.45 | 0.827 |
| SEN1 | 0.724 | 9.221 % | -0.459 % | 76.05 | 0.847 | |
| SEN2 | 0.703 | 9.839 % | -1.753 % | 73.43 | 0.832 | |
| SEN3 | 0.718 | 9.297 % | 0.005 % | 75.35 | 0.843 | |
| SEN4 | 0.722 | 9.215 % | -0.050 % | 75.76 | 0.845 | |
| SEN5 | 0.720 | 9.270 % | -2.453 % | 75.31 | 0.844 | |
| WS | BASE | 0.511 | 2.184 m·s-1 | 1.246 m·s-1 | 36.37 | 0.620 |
| SEN1 | 0.515 | 2.135 m·s-1 | 1.310 m·s-1 | 37.99 | 0.628 | |
| SEN2 | 0.506 | 2.144 m·s-1 | 1.330 m·s-1 | 37.11 | 0.623 | |
| SEN3 | 0.518 | 2.089 m·s-1 | 1.259 m·s-1 | 39.03 | 0.635 | |
| SEN4 | 0.518 | 2.075 m·s-1 | 1.239 m·s-1 | 39.20 | 0.636 | |
| SEN5 | 0.515 | 2.086 m·s-1 | 1.380 m·s-1 | 39.28 | 0.634 | |
3.2 近地面相对湿度
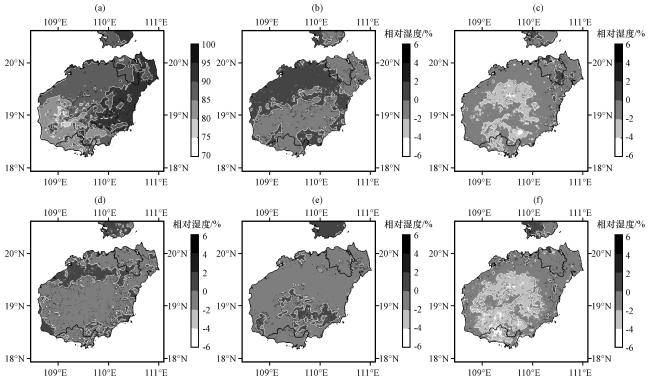
图7 BASE试验模拟2013年2月平均2 m相对湿度(a)和各敏感性试验[SEN1(b), SEN2(c), SEN3(d), SEN4(e)和SEN5(f)]与BASE试验模拟2 m相对湿度的差异(单位: %)Fig.7 The 2 m average relative humidity of BASE (a), and the mean 2 m relative humidity change of BASE and different sensitivity tests: SEN1 (b), SEN2 (c), SEN3 (d), SEN4 (e) and SEN5 (f) in February 2013.Unit: % |
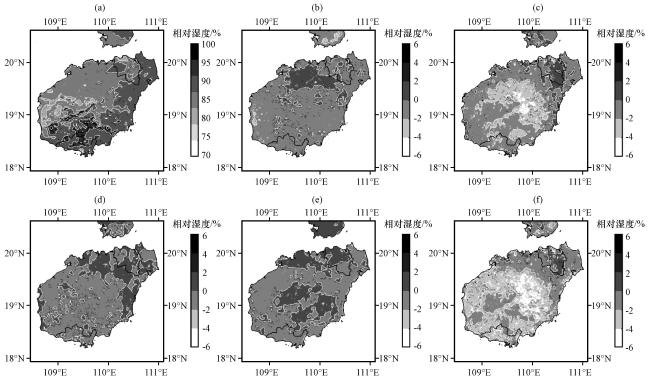
图8 BASE试验模拟2013年7月平均2 m相对湿度(a)和各敏感性试验[SEN1(b), SEN2(c), SEN3(d), SEN4(e)和SEN5(f)]与BASE试验模拟2 m相对湿度的差异(单位: %)Fig.8 The 2-m average relative humidity of BASE (a), and the mean 2-m relative humidity change of BASE and different sensitivity tests: SEN1 (b), SEN2 (c), SEN3 (d), SEN4 (e) and SEN5 (f) in July 2013.Unit: % |
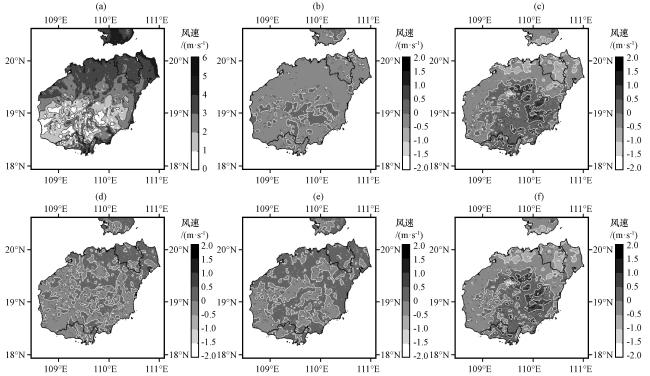
图9 BASE实验模拟2013年2月平均10 m风速(a)和各敏感性试验[SEN1(b), SEN2(c), SEN3(d), SEN4(e)和SEN5(f)]与BASE试验模拟10-m风速的差异(单位: m·s-1)Fig.9 The 10 m average wind of BASE (a), and the mean 10 m wind speed change of BASE and different sensitivity tests: SEN1 (b), SEN2 (c), SEN3 (d), SEN4 (e) and SEN5 (f) in February 2013.Unit: m·s-1 |
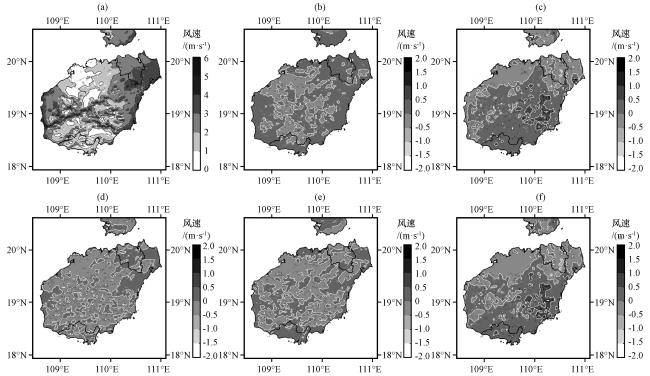
图10 BASE实验模拟2013年7月平均10 m风速(a)和各敏感性试验[SEN1(b), SEN2(c), SEN3(d), SEN4(e)和SEN5(f)]与BASE试验模拟10-m风速的差异(单位: m·s-1)Fig.10 The 10 m average wind of BASE (a), and the mean 10 m wind speed change of BASE and different sensitivity tests: SEN1 (b), SEN2 (c), SEN3 (d), SEN4 (e) and SEN5 (f) in July 2013.Unit: m·s-1 |