

1 引言
2 资料来源和方法介绍
2.1 资料来源和处理
2.2 方法介绍
2.2.1 单多普勒雷达风场反演的VAP方法
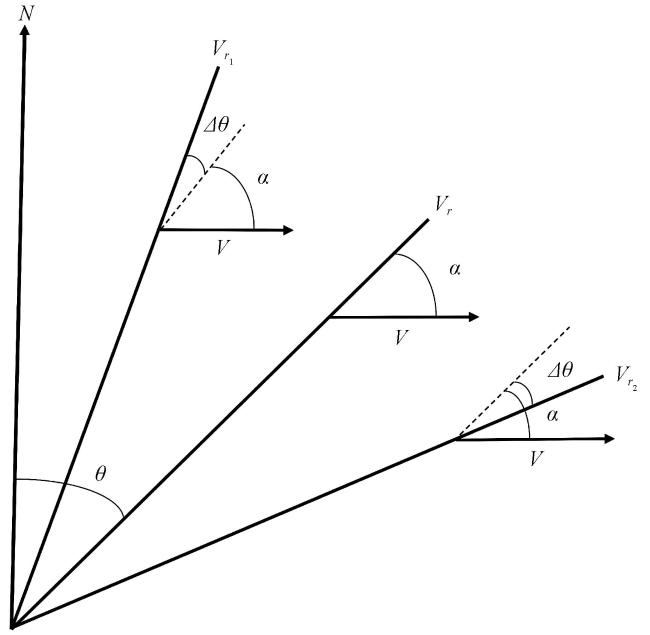
2.2.2 数据融合方法
3 对流实况与天气形势
3.1 2019年7月6日江苏强对流天气概况
3.2 天气形势分析
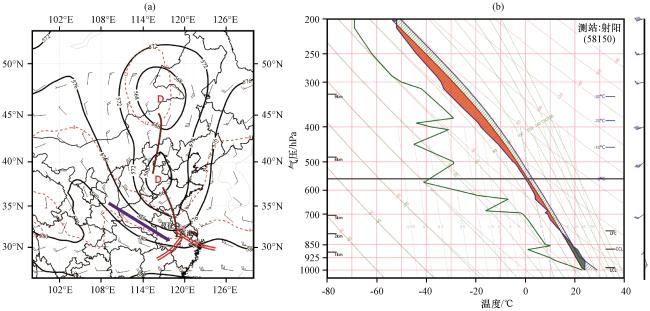
图2 2019年7月6日14:00 500 hPa天气形势(a)和射阳站时间订正到14:00的探空曲线(b)(a)中黑色实线为等位势线(单位: dagpm), 红色虚线为等温线(单位: ℃), 棕色实线为槽线, 紫色箭头为200 hPa急流轴, 红色双实线为850 hPa切变线, 风羽表示500 hPa风场(单位: m∙s-1) Fig.2 500 hPa synoptic situation at 14:00 (a) and sounding diagram with the time revised to 14:00 at Sheyang station (b) on 6 July 2019.In Fig.2(a), black solid lines are contours of geopotential height (unit: dagpm), red dotted lines are contours of temperature (unit: ℃), brown solid lines are trough lines, purple arrow is jet axis at 200 hPa, red double solid lines are shear lines at 850 hPa, barb denotes the wind field at 500 hPa (unit: m∙s-1) |
4 雷达回波演变特征
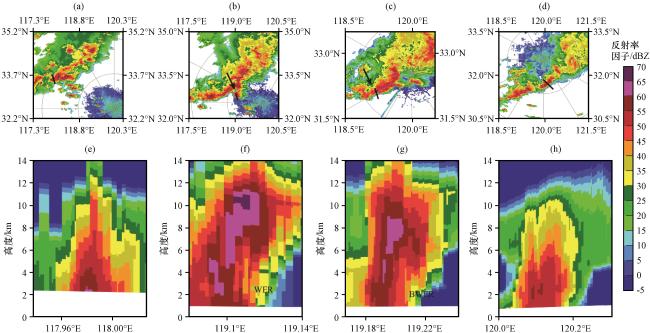
图3 2019年7月6日泰州雷达0.5°仰角 14:00(a, e)、 16:05(b, f)、 18:04(c, g)、 20:04(d, h)的反射率因子(a~d)及其对应的垂直剖面(e~h)(单位: dBZ)上图中黑色实线为下图中对应的剖面位置 Fig.3 Reflectivity at 0.5° elevation angle (a~d) and vertical cross sections of reflectivity (e~h) from Taizhou radar at 14:00 (a, e), 16:05 (b, f), 18:04 (c, g) and 20:04 (d, h) on 6 July 2019.Unit: dBZ.The solid black lines in up figures are positions of vertical cross section in down figures |
5 多源数据融合算法试验
5.1 多源数据融合算法可行性探讨
5.2 多源数据融合结果分析
5.2.1 14:00融合风场分析
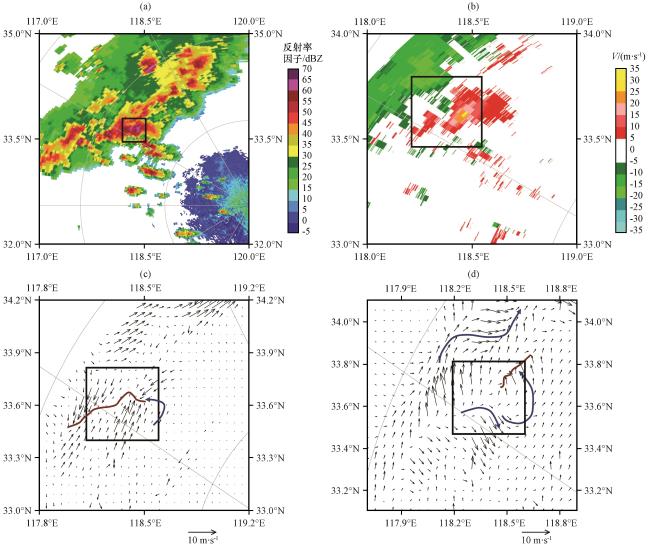
图5 2019年7月6日14:00泰州雷达0.5°仰角的反射率因子(a, 单位: dBZ)、 径向速度(b, 单位: m∙s-1)、 径向速度反演的风场(c, 矢量, 单位: m∙s-1)及多源数据融合的风场(d, 矢量, 单位: m∙s-1)分布黑色矩形框勾画了关键区域, 棕色实线为气流辐合线, 蓝色带箭头实线勾画了流场动向 Fig.5 The distribution of reflectivity (a, unit: dBZ) and radial velocity (b, unit: m∙s-1) of Taizhou radar at 0.5° elevation angle, wind field retrieved by radial velocity (c, vector, unit: m∙s-1) and wind field of multi-source data fusion (d, vector, unit: m∙s-1) at 14:00 on 6 July 2019.The black rectangular box outlines the key areas, the brown solid lines are the flow convergence lines, and the blue solid lines with arrows outline the flow field trend |
5.2.2 16:00融合风场分析
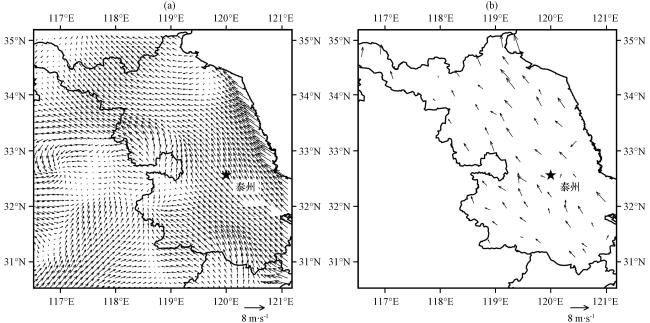
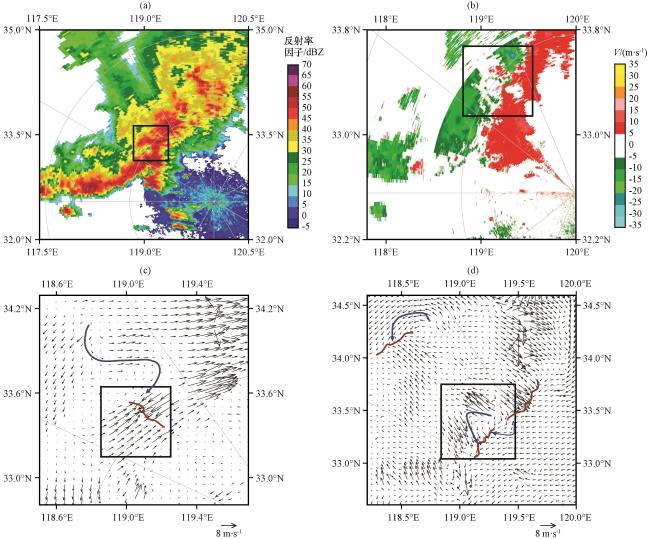
图7 2019年7月6日16:00泰州雷达0.5°仰角的反射率因子(a, 单位: dBZ)、 径向速度(b, 单位: m∙s-1)径向速度反演的风场(c, 矢量, 单位: m∙s-1)及多源数据融合的风场(d, 矢量, 单位: m∙s-1)分布黑色矩形框勾画了关键区域, 棕色实线为气流辐合线, 蓝色带箭头实线勾画了流场动向 Fig.7 The distribution of reflectivity (a, unit: dBZ) and radial velocity (b, unit: m∙s-1) of Taizhou radar at 0.5° elevation angle, wind field retrieved by radial velocity (c, vector, unit: m∙s-1), wind field of multi-source data fusion (d, vector, unit: m∙s-1) at 16:00 on 6 July 2019.The black rectangular box outlines the key areas, the brown solid lines are the flow convergence lines, and the blue solid lines with arrows outline the flow field trend |
5.2.3 18:00融合风场分析
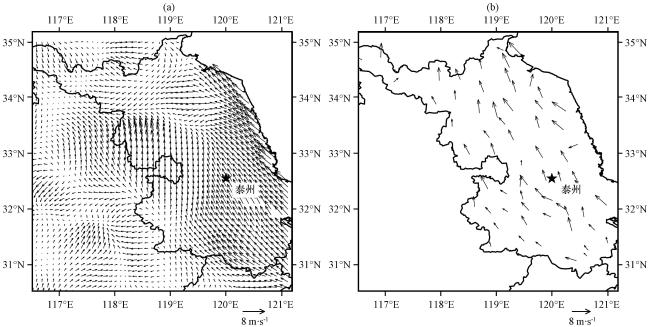
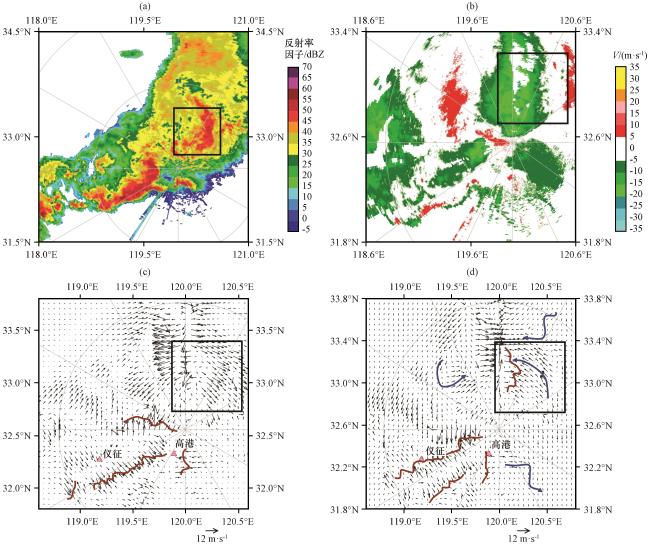


图9 2019年7月6日18:00泰州雷达0.5°仰角的反射率因子(a, 单位: dBZ)、 径向速度(b, 单位: m∙s-1)、 径向速度反演的风场(c, 矢量, 单位: m∙s-1)及多源数据融合的风场(d, 矢量, 单位: m∙s-1)分布黑色矩形框勾画了关键区域, 棕色实线为气流辐合线, 蓝色带箭头实线勾画了流场动向, 红色三角形标注了降雹区域 Fig.9 The distribution of Reflectivity (a, unit: dBZ) and radial velocity (b, unit: m∙s-1) of Taizhou radar at 0.5° elevation angle, wind field retrieved by radial velocity (c vector, unit: m∙s-1) and wind field of multi-source data fusion (d, vector, unit: m∙s-1) at 18:00 on 6 July 2019.The black rectangular box outlines the key areas, the brown solid lines are the flow convergence lines, and the blue solid lines with arrows outline the flow field trend, the red triangles show hail areas |