
1 引言
2 天气实况、 模式及数值模拟试验
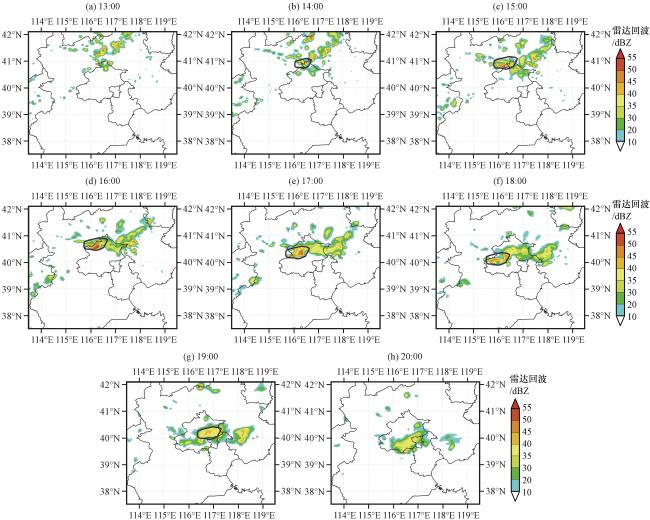
2.1 天气实况介绍
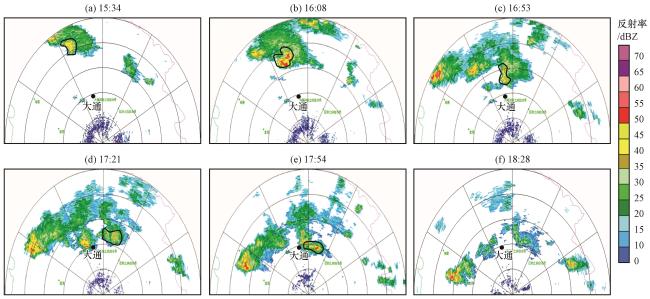
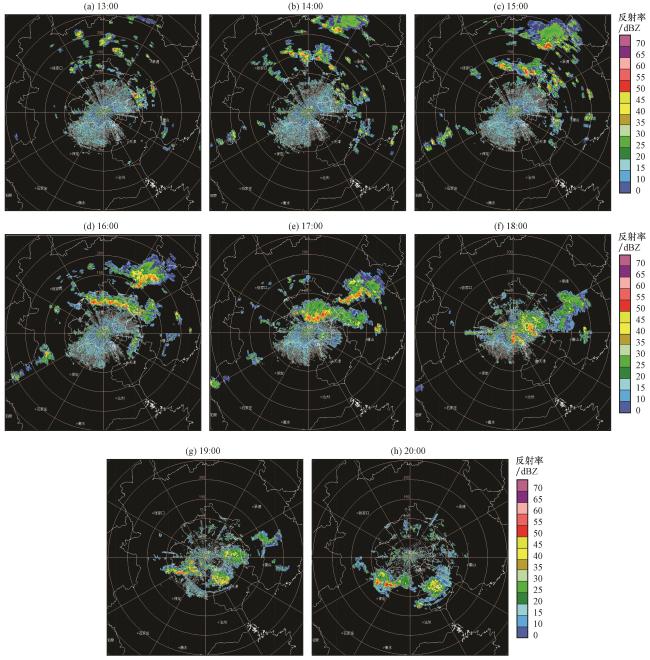
图1 2009年8月6日15:30 -18:30雷暴移动过程各时段西宁C波段天气雷达基本反射率(单位: dBZ)相邻两圈之间的距离为20 km, 黑线标记范围是研究的雷暴云 Fig.1 Radar base reflectivity at different time measured by CINRAD-CC Doppler weather radar at Xining from 15:30 to 18:30 on 6 August 2009.Unit: dBZ.Distance between the two adjacent circles is 20 km.Black circles represent storm clouds in the study area |
2.2 模式及数值模拟试验
表1 数值试验物理过程参数化方案Table 1 The physical parameterization schemes |
| 物理参数化方案 | 三重嵌套网格 | ||
|---|---|---|---|
| 第一重 | 第二重 | 第三重 | |
| 感应/非感应起电机制 | - | - | 感应机制+非感应BSP机制 |
| 微物理方案 | NSSL 2 | NSSL 2 | NSSL 2 |
| 陆面方案 | Unified Noah | Unified Noah | Unified Noah |
| 边界层方案 | YSU | YSU | YSU |
| 对流参数化方案 | Kain-Fritsch scheme | - | - |
| 长/短波辐射方案 | Goddard scheme | Goddard scheme | Goddard scheme |
-表示不开启该参数化方案 |
3 结果分析
3.1 模拟雷达回波与观测雷达回波
3.2 两个雷暴个例不同阶段雷暴云总电荷结构特征对比
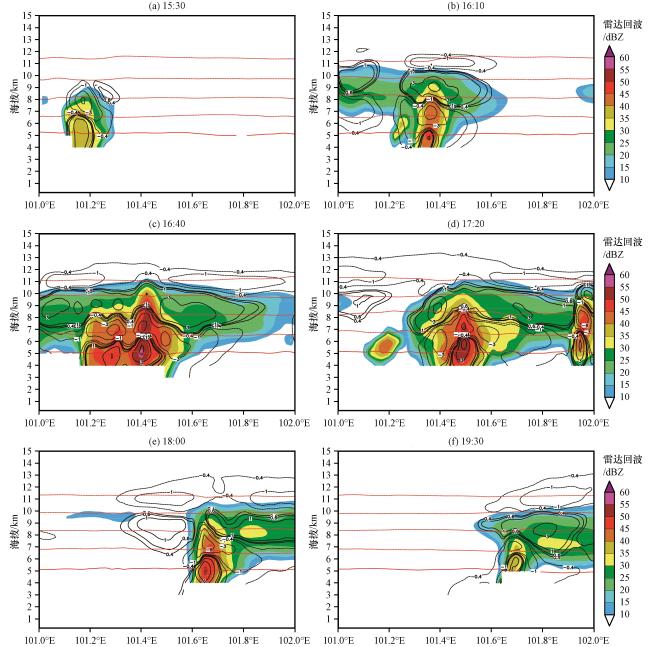
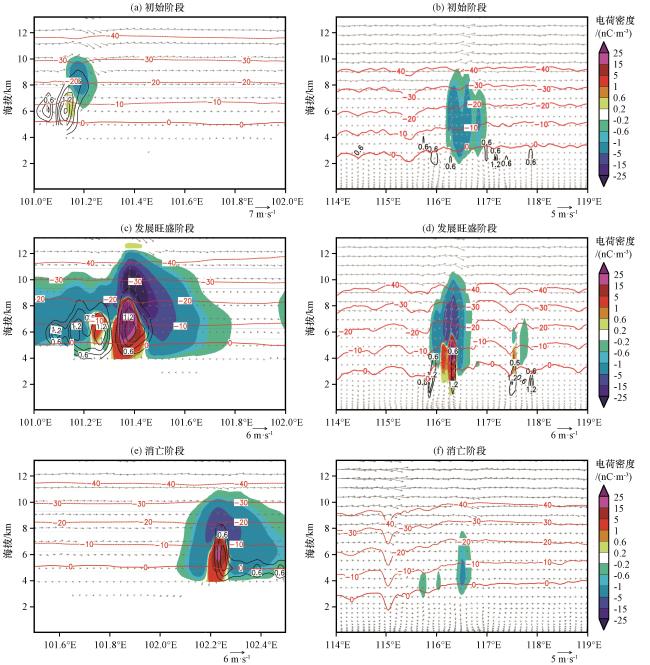
图6 模拟的高原雷暴个例不同时段雷暴云电荷结构黑色等值线为电荷密度分布(单位: nC·m-3), 红色虚线自下而上依次为0 ℃、 -10 ℃、 -20 ℃, -30 ℃和-40 ℃等温线, 彩色区为雷达回波(单位: dBZ) Fig.6 Simulated charge density distribution in different stages of thunderstorm occurred at Qinghai.The black contour indicates charge density (unit: nC·m-3), red contour indicates 0 ℃, -10 ℃, -20 ℃, -30 ℃ and -40 ℃ emperatures from low to high levels, color area indicates radar reflectivity (unit: dBZ) |
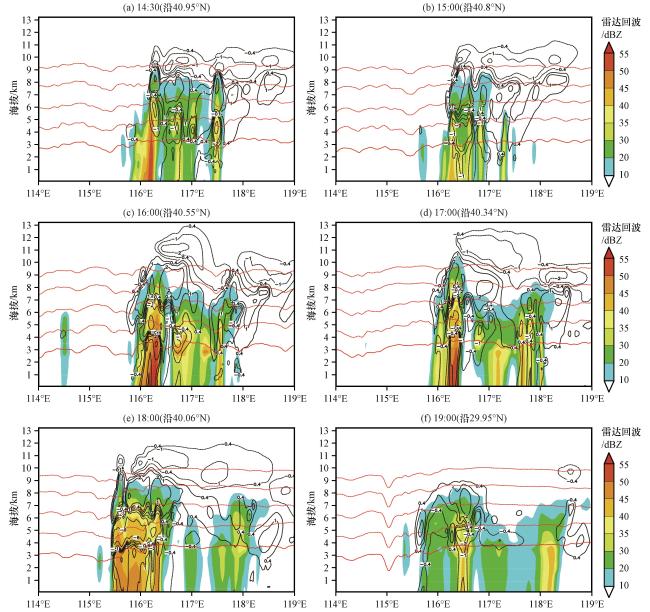
图7 模拟的北京个例不同时刻沿不同纬度作的强回波区雷暴云总电荷密度的经度—高度剖面图中黑色等值线为电荷密度分布(单位: nC·m-3), 红色虚线自下而上依次为0 ℃、 -10 ℃、 -20 ℃, -30 ℃和-40 ℃等温线, 彩色区为雷达回波(单位: dBZ) Fig.7 Longitude and height profile of the simulated charge density in different stages of thunderstorm occurred at Beijing.The black contour indicates charge density (unit: nC·m-3), red contour indicates 0 ℃, -10 ℃, -20 ℃, -30 ℃ and -40 ℃ temperatures from low to high levels, color area indicates radar reflectivity (unit: dBZ) |
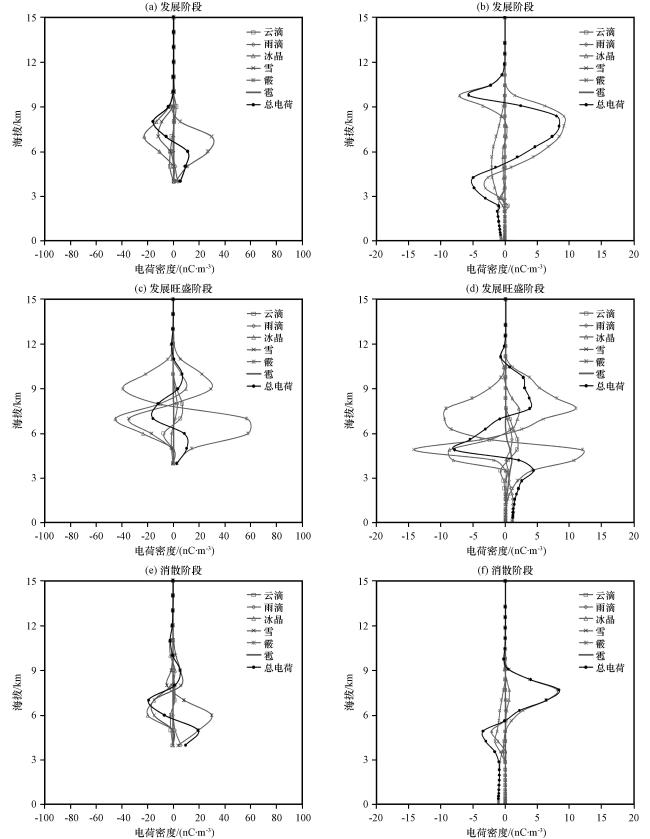
3.3 两个雷暴个例不同阶段不同水成物粒子所带电荷情况对比
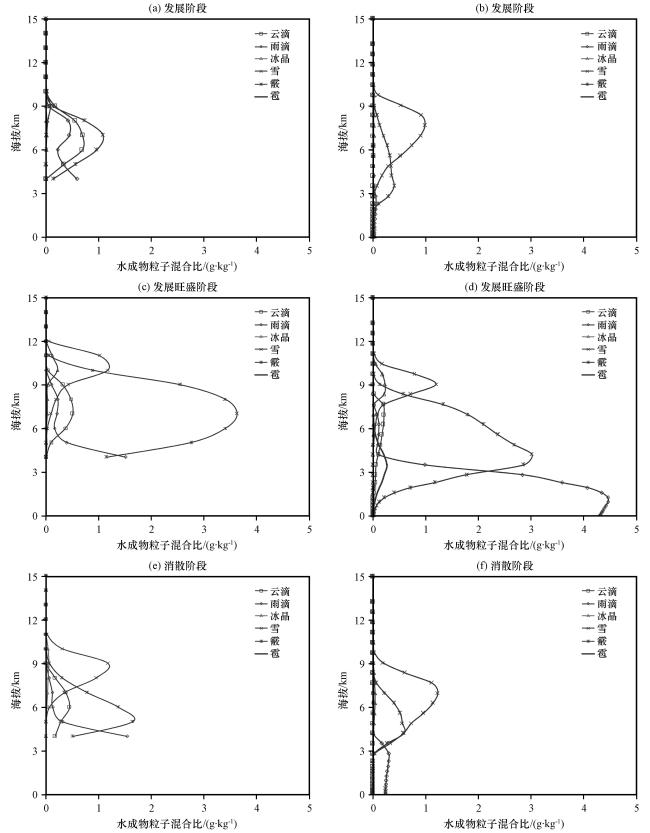
3.4 两个雷暴个例不同阶段不同水成物粒子混合比对比
3.5 两个雷暴个例不同阶段不同凇附增长率对比
图10 模拟的青海大通(左)和北京(右)地区雷暴个例不同阶段有效液态水含量(黑色等值线, 单位: g·m-3)及霰粒子电荷密度(彩色区, 单位: nC·m-3)的垂直分布红色等值线为等温线(单位: ℃), 矢量为纬向和垂直风速合成风(单位: m·s-1) Fig.10 The vertical distribution of the simulated effective liquid water content (black contour, unit: g·m-3) and charge density of graupel particles (color area, unit: nC·m-3)at different stages of the two thunderstorm cases which occurred at Datong of Qinghai (left) and Beijing (right).The red contour denotes temperatures (unit: ℃), and the vector arrow is the combined wind of zonal and vertical wind speeds (unit: m·s-1) |