

1 引言
2 环流特征及模式试验设计
2.1 暴雨概况
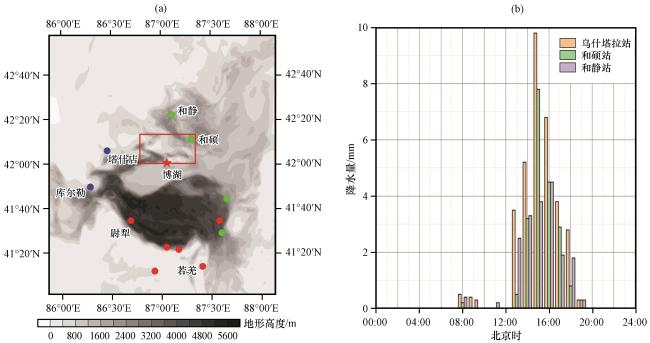
图1 2020年8月14日00:00至15日00:00博斯腾湖地区气象站点降水量分布(红色矩形框代表博斯腾湖; 五角星和红色圆点代表暴雨; 绿色圆点表示大雨; 蓝色圆点表示小雨)和地形高度(灰阶)(a)、 博斯腾湖地区代表站观测的逐时雨量(b)Fig.1 Accumulative precipitation in Bosten Lake area from automatic weather stations observations from 00:00 on 14 to 00:00 on 15 August 2020(red rectangles denote Bosten Lake area, pentagram and red dots denote rainstorm, green dots denote heavy rain, and blue dots denote light rain) and geopotential height(gray scale)(a), and hourly precipitation observed by representative stations in Bosten Lake area (b) |
2.2 天气环流形势
2.3 数据来源及模式设计
表1 物理过程与方案选择Table 1 The physical processes and schemes selected |
| 物理过程 | 方案选择 |
|---|---|
| 云微物理过程方案 | Thompson方案 |
| 近地面层方案 | Monin-Obukhov方案 |
| 陆面过程方案 | Noah方案 |
| 边界层方案 | YSU方案 |
| 短波辐射方案 | Dudhia方案 |
| 长波辐射方案 | RRTM 方案 |
| 积云对流方案 | Kain Fritsch方案(3km层次关闭) |
3 模拟结果对比分析
3.1 环流形势检验
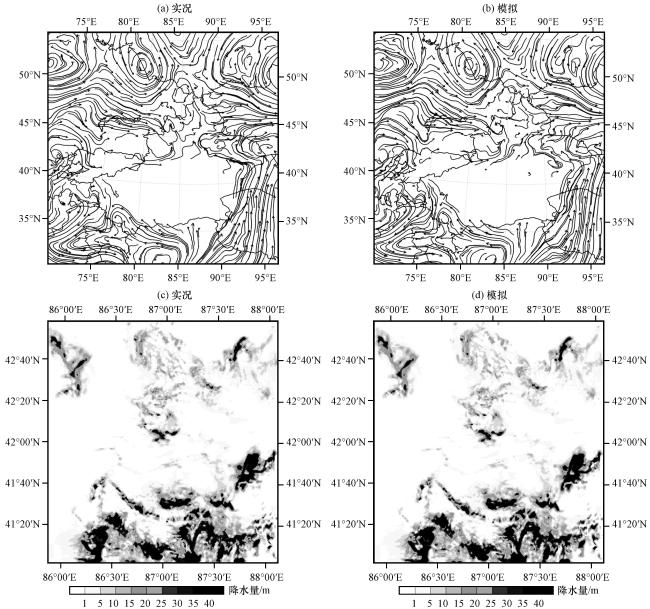
图2 2020年8月14日实况(左)和模拟(右)的700 hPa平均流场分布(a, b)以及TRMM卫星实况和模拟的24 h累计降水(c, d, 单位: mm)Fig.2 The distribution of the observed (left) and simulated (right) average streamline on 700 hPa (a, b ), observed by TRMM and simulated 24-hour cumulative precipitation (c, d, unit: mm) on 14 August 2020 |
3.2 模拟降水检验
4 分析场及中尺度系统结构分析
4.1 高度场和风场分析
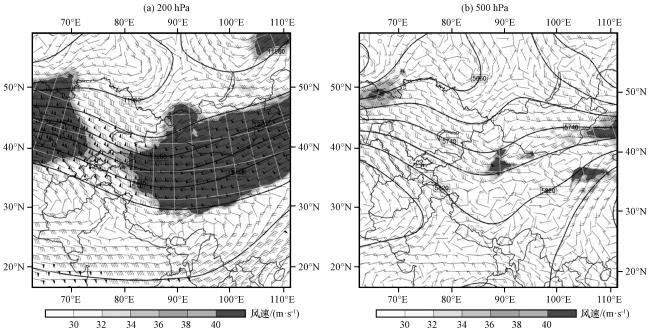
图3 2020年8月14日14:00 200 hPa(a)、 500 hPa(b)的环流形势(等值线, 单位: gpm)、 风场(风羽, 单位: m·s-1)和急流区(阴影)Fig.3 Composition of observed geopotential height (contour, unit: gpm) and wind field (barb, unit: m·s-1) and the high level jet (the shaded areas) on 200 hPa (a), 500 hPa (b) at 14:00 on 14 August 2020 |
4.2 水汽条件分析
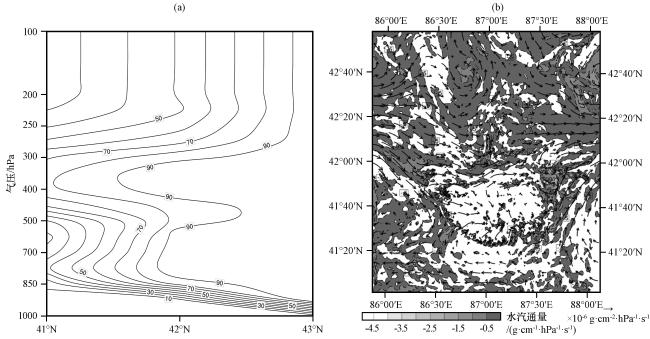
图4 2020年8月14日14:00相对湿度的垂直剖面(a, 单位: %), 700 hPa水汽通量(阴影, 单位: g·cm-1·hPa-1·s-1)和水汽通量散度(矢量, 单位: ×10-6 g·cm-2·hPa-1·s-1) (b)Fig.4 The zonal vertical section of relative humidity (a, unit: %), the moisture flux (the shaded, unit: g·cm-1·hPa-1·s-1) and the moisture flux divergence (vector, unit: ×10-6 g·cm-2·hPa-1·s-1) on 700 hPa (b) at 14:00 on 14 August 2020 |
4.3 中尺度系统垂直结构分析
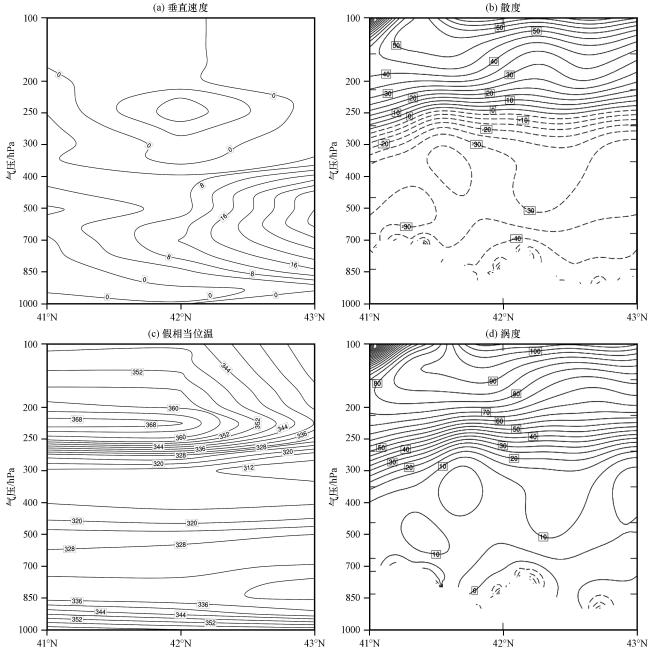
图5 2020年8月14日14:00垂直速度(a, 单位: Pa·s-1)、 散度(b, 单位: ×10-5 s-1)和涡度(d, 单位: ×10-5 s-1)、 假相当位温(c, 单位: K)的垂直剖面Fig.5 The zonal vertical cross section of the vertical velocity (a, unit: Pa·s-1), divergence (b, unit: ×10-5 s-1)and vorticity (d, unit: ×10-5 s-1), pseudo-equivalent temperature (c, unit: K)at 14:00 on 14 August 2020 |
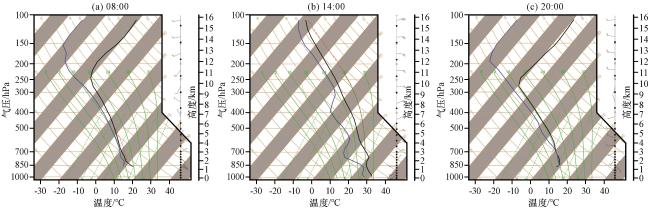
图6 2020年8月14日08:00、 14:00、 20:00博斯腾湖站探空曲线黑色线: 气块路径曲线; 蓝色线: 露点温度; 红色线: 温度廓线 Fig.6 Sounding chart of Bosten Lake Observatory Station at 08:00, 14:00, 20:00 on 14 August 2020.The black line is air parcel path, the blue line is dew point temperature profile, and the red line is temperature profile |
4.4 地形和急流条件分析
表2 地形试验方案Table 2 The topographic experiments scheme |
| 名称 | 内容 |
|---|---|
| CTRL | 保持原地形 |
| TEST1 | 库鲁克塔格山高度降低1/2 |
| TEST2 | 库鲁克塔格山高度降低3/4 |
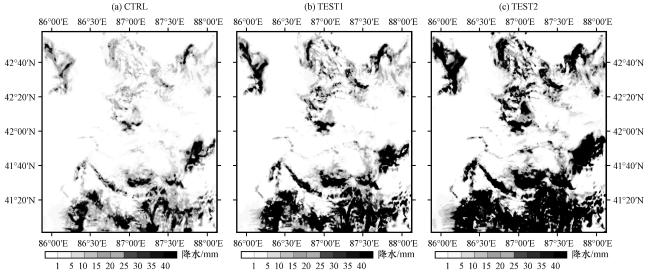
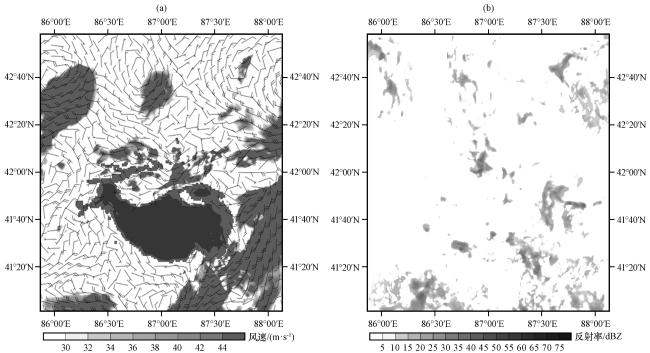


图8 2020年8月14日14:00 4000 m地形(黑色区域)、 700 hPa风场(风羽, 单位: m·s-1)、 急流(灰色阴影, 单位: m·s-1)(a)、 雷达组合反射率(阴影区, 单位: dBZ)(b)Fig.8 Composition of terrain height over 4000 m (the shaded areas), wind field (barb, unit: m·s-1) on 700 hPa, the high level jet (color area, unit: m·s-1) (a), radar combined reflectivity (the shaded areas, unit: dBZ) (b) on 14 August 2020 |