

1 引言
2 资料选取和方法介绍
2.1 CRA检验方法
表1 2019—2020年5—9月西北地区东部强降水天气过程识别的有效CRA及其环流分型Table 1 The effective CRAs and circulation classification of heavy precipitation weather processes in Eastern Northwest China from May to September in 2019—2020 |
| 模式 | 强降水阈值 | CRA 面积 | 有效CRA /个 | 有效CRA天气 过程/个 | 低槽型天气 过程/个 | 西南气流型 天气过程/个 | 两高切变型 天气过程/个 |
|---|---|---|---|---|---|---|---|
| ECMWF | 25 mm·(24 h)-1 | ≥1°×1° | 51 | 44 | 19 | 13 | 12 |
| GRAPES-GFS | 25 mm·(24 h)-1 | ≥1°×1° | 48 | 43 | 21 | 11 | 11 |
2.2 资料选取
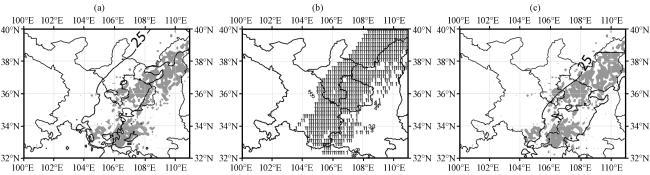
图1 西北地区东部2019年7月21日08:00至22日08:00 ≥25 mm实况观测降水(阴影区, 单位: mm)和相应的ECMWF模式36 h时效的预报(等值线, 单位: mm)(a), 识别和分离的CRA(b)以及填值为“1”的CRA平移后的模式降水预报(等值线, 单位: mm)与实况观测降水(阴影区, 单位: mm)(c)填值“1、 2、 3、 4、 5”分别为5个CRA, 其中只有填值“1”为有效CRA Fig.1 The observed precipitation (≥25 mm, the shaded, unit: mm) and the corresponding ECMWF precipitation forecast with 36-hour limit (contour, unit: mm) in Eastern Northwest China from 08:00 on 21 to 08:00 on 22 July 2019 (a), the identified and isolated CRAs (b), and the observed precipitation (the shaded, unit: mm) and the shifted ECMWF precipitation forecast (contour, unit: mm) of CRA with the filling value of “1” (c).The values of “1, 2, 3, 4, 5” are 5 CRAs, and only “1” is a valid CRA |
2.3 强降水环流形势分型
3 西北地区东部强降水预报总体偏差
表2 西北地区东部强降水的落区、 强度平均偏差及落区、 强度、 形态偏差平均占比Table 2 The average location and intensity deviation of heavy precipitation and the average percentage of location, intensity and pattern error in Eastern Northwest China |
| 模式 | 落区 偏差 占比/% | 强度 偏差 占比/% | 形态 偏差 占比/% | 平均纬向 位移偏差 /(°) | 平均经向 位移偏差 /(°) | 平均纬向 质心偏差 /(°) | 平均经向 质心偏差 /(°) | 平均 面积 偏差/% | 平均 强度 偏差/% | 最大 降水量 偏差/% | 总降水量 偏差/% |
|---|---|---|---|---|---|---|---|---|---|---|---|
| ECMWF | 21.55 | 12.47 | 65.99 | -0.37 | 0.45 | -0.18 | 0.08 | 3.80 | -5.35 | -3.26 | 18.69 |
| GRAPES-GFS | 20.31 | 15.97 | 63.72 | -0.38 | 0.21 | -0.21 | 0.05 | -6.43 | -33.08 | -54.44 | -21.58 |
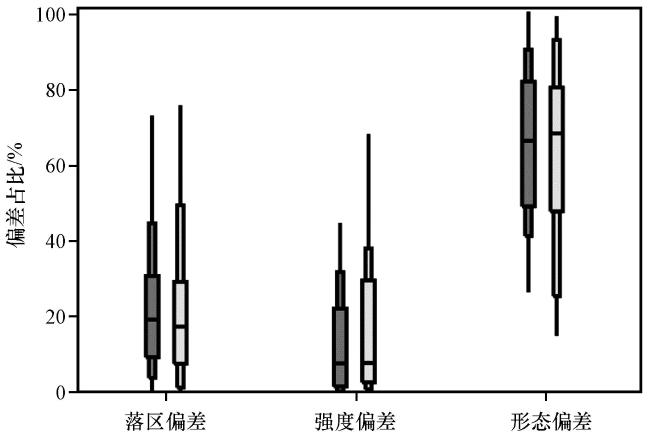
图2 2019—2020年5—9月西北地区东部强降水天气过程的落区、 强度和形态三种偏差占比箱线图深灰色为ECMWF模式, 浅灰色为GRAPES-GFS模式 Fig.2 Box chart of location, intensity and pattern deviation percentage of heavy precipitation weather processes in Eastern Northwest China from May to September in 2019—2020.Dark grey is ECMWF model, and light grey is GRAPES-GFS model |
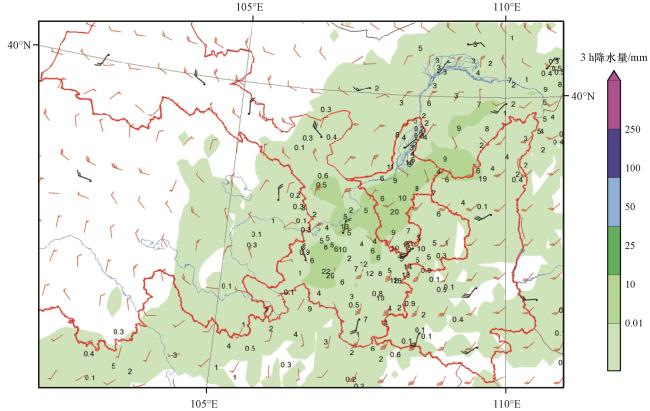
图3 2020年8月23日西北地区东部强降水天气过程的3 h降水实况(填值, 单位: mm)和GRAPES-GFS模式的3 h预报降水(彩色区, 单位: mm)红色风向杆为GRAPES-GFS的700 hPa风场预报, 黑色风向杆为700 hPa实况风场(单位: m·s-1) Fig.3 The 3-hour observed precipitation (fill in value, unit: mm) and the 3-hour forecast precipitation (color area, unit: mm) of GRAPES-GFS model in Eastern Northwest China on August 23, 2020.The red vector arrow is the 700 hPa wind field forecast of GRAPES-GFS model, and the black vector arrow is the 700 hPa actual wind field (unit: m·s-1) |
3.1 空间偏差
3.2 面积偏差
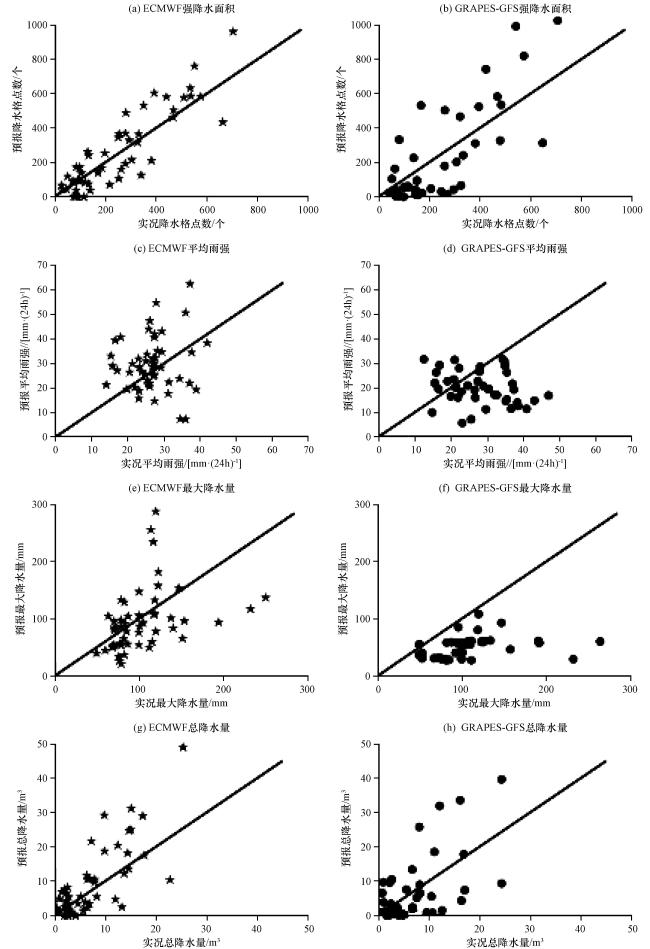
3.3 强度偏差
4 西北地区东部不同环流形势强降水预报偏差
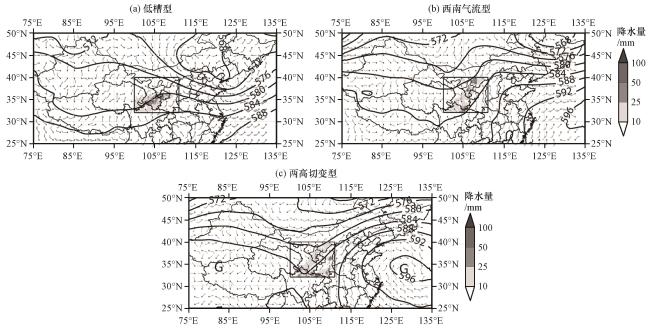
图6 西北地区东部不同类型强降水的环流形势和降水分布等值线为500 hPa高度场(单位: dagpm), 风向杆为700 hPa风场(单位: m·s-1), 阴影区为24 h累积降水量(单位: mm), 黑色方框为研究区域, (c)中字母“G”为高压中心 Fig.6 The circulation situation and precipitation distribution of three heavy precipitation patterns in Eastern Northwest China.The contour is 500 hPa height field (unit: dagpm), and the vector arrow is 700 hPa wind field (unit: m·s-1), and the shaded area is 24-hour accumulated precipitation (unit: mm), the black box is the study area, and the letter “G” in (c) is the high pressure center |
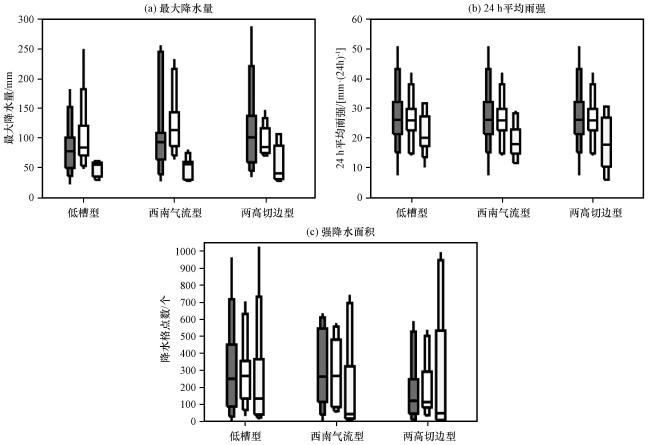
图7 西北地区东部三类不同环流形势下≥25 mm·(24h)-1强降水的实况和模式预报箱线图深灰色是ECMWF模式, 浅灰色是GRAPES-GFS模式, 白色是实况 Fig.7 Box chart of observation and model forecast of heavy precipitation over 25 mm·(24h)-1 under three different circulation situation in Eastern Northwest China.Dark grey is ECMWF model, and light grey is GRAPES-GFS model, and white is observation |
4.1 面积和强度偏差
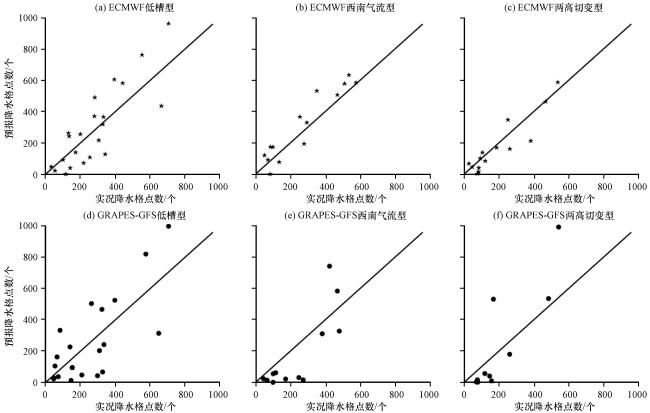
图8 不同类型强降水环流形势下CRA内实况降水格点数与相应的ECMWF模式(上)和GRAPES-GFS模式(下)预报的格点数散点分布Fig.8 The scatter plot of grid numbers between observation and forecasted by the ECMWF model (up) and GRAPES-GFS model (down) in the CRAs under three different circulation situation |
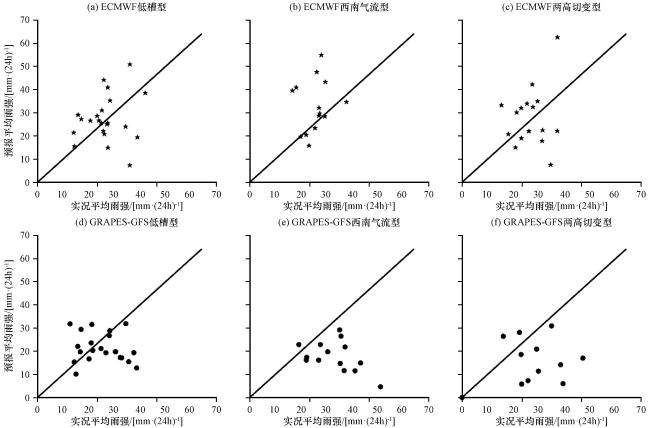
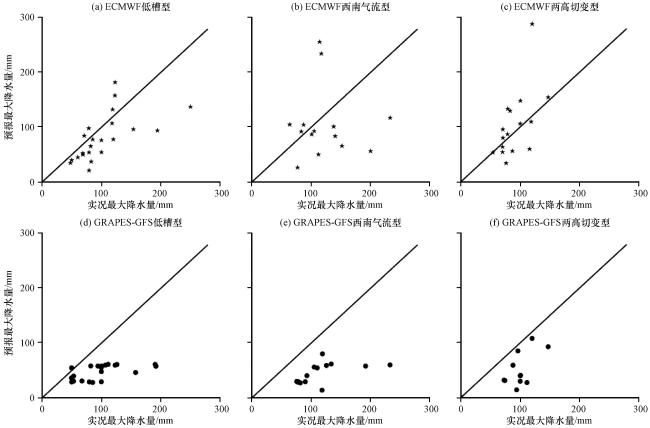
表3 西北地区东部ECMWF模式和GRAPSE-GFS模式对不同环流型强降水落区和强度预报偏差的中位数Table 3 The location and intensity deviation median of the ECMWF and GRAPES-GFS models forecast under three heavy precipitation patterns in Eastern Northwest China |
| 环流分型 | 数值模式 | 纬向位移 偏差/(°) | 经向位移 偏差/(°) | 纬向质心 偏差/(°) | 经向质心 偏差/(°) | 面积偏差 /% | 平均雨强 偏差/% | 最大降水 偏差/% | 总降水量 偏差/% |
|---|---|---|---|---|---|---|---|---|---|
| 低槽型 | ECMWF | -0.25 | 0.32 | -0.18 | -0.02 | 4.05 | 10.0 | -23.72 | 9.67 |
| GRAPSE-GFS | -0.50 | 0.12 | -0.24 | -0.03 | -27.90 | -7.69 | -45.00 | -41.20 | |
| 西南气流型 | ECMWF | -0.50 | 0.44 | -0.35 | 0.07 | 15.99 | 7.92 | -19.80 | 30.14 |
| GRAPSE-GFS | -0.69 | 0.19 | -0.22 | 0.04 | -47.19 | -37.58 | -61.26 | -66.98 | |
| 两高切变型 | ECMWF | 0.06 | 0.44 | -0.06 | 0.12 | -12.34 | 16.50 | 5.70 | 2.16 |
| GRAPSE-GFS | -0.13 | 0.00 | 0.06 | 0.00 | -72.11 | -61.88 | -57.74 | -89.94 |
4.2 空间偏差
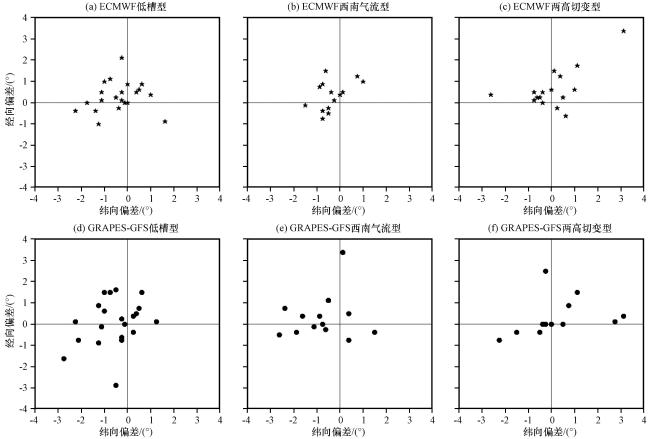
图11 不同类型强降水环流形势下ECMWF模式(上)和GRAPES-GFS模式(下)的强降水预报较实况雨区的位移偏差散点分布Fig.11 The scatter plot of the displacement deviation of the heavy precipitation forecasted by ECMWF model (up) and GRAPES-GFS model (down) compared with the observed precipitation under three different circulation situation |
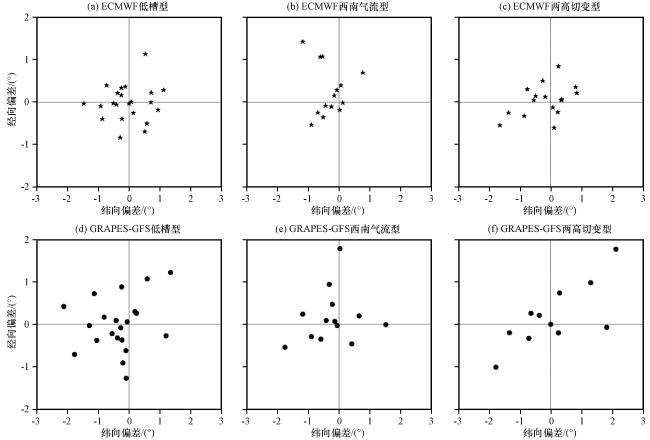


图12 不同类型强降水环流形势下ECMWF模式(上)和GRAPES-GFS模式(下)的强降水预报较实况雨区的质心偏差散点分布Fig.12 The scatter plot of the mass center location bias of the heavy precipitation forecasted by ECMWF model (up) and GRAPES-GFS model (down) compared with the observed precipitation under three different circulation situation |