

1 引言
2 暴雨标准和降水分布
2.1 使用资料
2.2 不同量级暴雨和短时暴雨标准
表1 贺兰山东麓不同量级暴雨特征Table 1 Characteristics of different grades of rainstorm processes in the eastern foot of the Helan Mountain |
| 序号 | 一般暴雨过程 | 大暴雨过程 | 特大暴雨过程 |
|---|---|---|---|
| 1 | 2007年6月16日13:00 至17日12:00 | 2006年7月14日11:00至15日10:00 | 2016年8月21日19:00至22日08:00 |
| 2 | 2015年9月3日04:00至4日01:00 | 2009年7月7日08:00至8日07:00 | 2018年7月22日19:00至23日07:00 |
| 3 | 2015年9月8日01:00-20:00 | 2012年7月29日20:00至30日11:00 | |
| 4 | 2016年7月24日05:00-12:00 | 2016年年8月13日15:00至14日14:00 | |
| 5 | 2016年8月22日22:00至23日06:00 | 2017年6月4日15:00至5日10:00 | |
| 6 | 2017年7月25日20:00至26日02:00 | 2017年7月5日03:00-18:00 | |
| 7 | 2018年7月1日09:00至2日01:00 | 2018年7月19日03:00-10:00 | |
| 8 | 2018年7月23日12:00-20:00 | 2018年8月6日12:00至7日16:00 | |
| 9 | 2018年8月9日12:00至10日13:00 | 2018年8月31日19:00至9月1日17:00 | |
| 10 | 2019年8月2日18:00至3日00:00 | 2020年8月11日11:00至12日08:00 | |
| 11 | 2021年9月15日00:00至16日15:00 | ||
| 平均雨量/mm | 19.6 | 28.9 | 9.2 |
| 平均持续时间/h | 15 | 21 | 13 |
| 最大雨量/mm | 93.8 | 174.3 | 277.6 |
| 最大小时雨强/mm | 71.4 | 84.5 | 82.5 |
| 暴雨总站次/次 | 133 | 361 | 46 |
| 一般暴雨站次/次 | 133 | 320 | 31 |
| 大暴雨站次/次 | 0 | 41 | 10 |
| 特大暴雨站次/次 | 0 | 0 | 5 |
| 短时暴雨总站次/次 | 257 | 288 | 89 |
| 一般短时暴雨站次/次 | 231 | 251 | 72 |
| 短时大暴雨站次/次 | 25 | 35 | 10 |
| 短时特大暴雨站次/次 | 1 | 2 | 7 |
| 平均雷电频次/次 | 144 | 159 | 1043 |
| 平均雷电强度KA | 125 | 136 | 197 |
2.3 降水分布
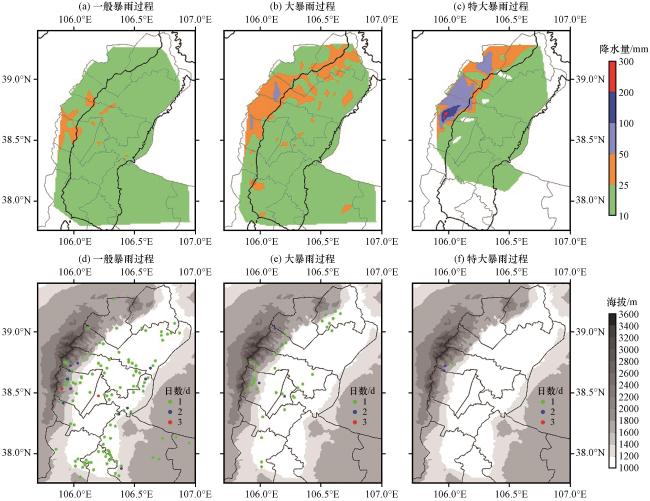
图1 贺兰山东麓不同量级暴雨过程的平均降水量(a~c, 彩色区, 单位: mm)和暴雨日数(d~f, 彩色圆点, 单位: d)分布(a)~(c)中黑色加粗线为1200 m地形线; (d)~(f)中灰色阴影为海拔(单位: m) Fig.1 The mean accumulated rainfall (a~c), color area, unit: mm) and days (d~e), color dots, unit: d) of different grades of rainstorm processes in the eastern foot of the Helan Mountain.The bold black line indicates the terrain height of 1200 m in Fig.1(a)~(c).The gray shadow denotes elevation (unit: m) in Fig.1(d)~(f) |
3 贺兰山东麓不同量级暴雨的斜压性特征
3.1 Eady增长率
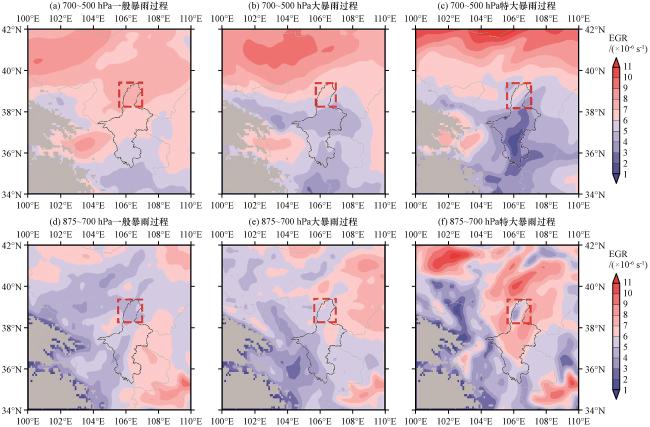
图2 贺兰山东麓不同量级暴雨过程的中层700~500 hPa(上)和低层875~700 hPa(下)的垂直积分EGR分布(彩色区, 单位: ×10-6 s-1)灰色阴影为青藏高原, 红色虚线框为暴雨关键区 Fig.2 Distributions of the vertical-integrated eady growth rate (color area, unit: ×10-6 s-1) in middle levels at 700~500 hPa(up) and low levels at 875~700 hPa (down) in different grades of rainstorm processes in the eastern foot of the Helan Mountain.The gray shadow denotes the Qinghai-Xizang Plateau, and the red dashed boxes are the key areas of rainstorm processes |
3.2 斜压性特征
4 贺兰山东麓不同量级暴雨过程的环流特征
4.1 环流形势和天气系统配置
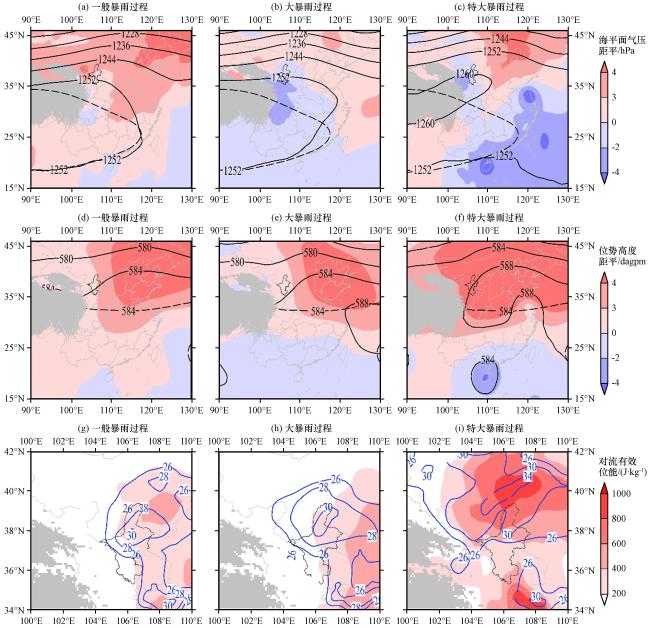
图3 贺兰山东麓不同量级暴雨过程期间的平均200 hPa位势高度(黑色实线, 单位: dagpm; 黑色虚线为多年平均1252 dagpm等值线)和海平面气压距平场(彩色区, 单位: hPa)(上), 500 hPa位势高度场(黑色实线, 单位: dagpm; 黑色虚线为多年平均584 dagpm和588 dagpm等值线)和距平场(彩色区)(中), 以及K指数(蓝色实线, 单位: ℃)和CAPE(彩色区, 单位: J·kg-1)(下)灰色阴影为青藏高原 Fig.3 The average 200 hPa geopotential height (black solid lines, unit: dagpm; black dashed lines are the climatic average of 1252 dagpm isolines) and sea level pressure anomaly (color area, unit: hPa) (up), 500 hPa geopotential height (black solid lines, unit: dagpm; black dashed lines are the climatic average of 584 dagpm and 588 dagpm isolines) and the anomalies (color area, unit: hPa) (middle), the K index (blue solid lines, unit: ℃) and convective available potential energy (color area, unit: J·kg-1) (down) for different grades of rainstorm processes in the eastern foot of the Helan Mountain.The gray shadow denotes the Qinghai-Xizang Plateau |
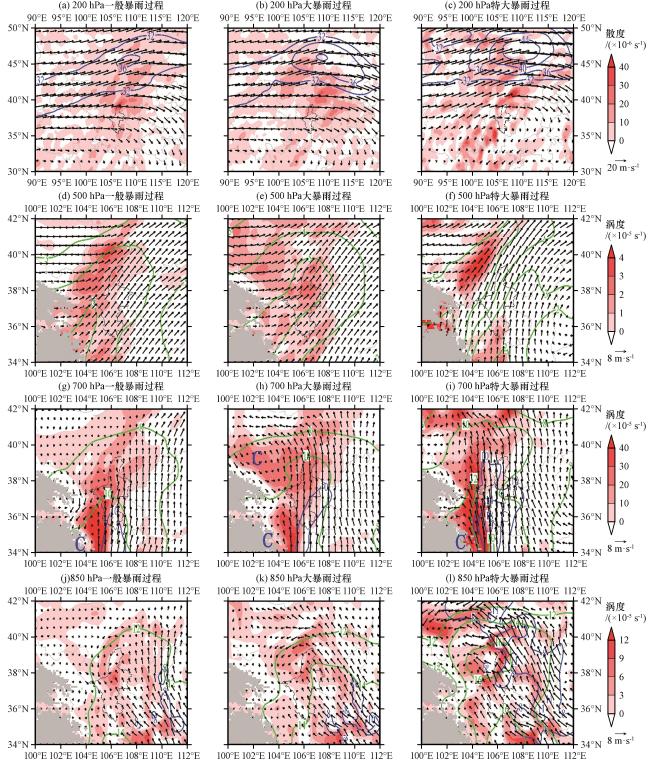
图4 贺兰山东麓不同量级暴雨过程期间的平均200 hPa高空急流(风速≥36 m·s-1, 蓝色实线, 单位: m·s-1)、 风场(矢量, 单位: m·s-1)和散度(彩色区, 单位: ×10-6 s-1)(a~c), 500 hPa比湿(绿色实线, 单位: g·kg-1)、 风场(矢量, 单位: m·s-1)和涡度(彩色区, 单位: ×10-5 s-1)(d~f), 以及700 hPa(g~i)和850 hPa(j~l)低空急流(蓝色实线, 单位: m·s-1)、 比湿(绿色实线, 单位: g·kg-1)、 风场(矢量, 单位: m·s-1)和涡度(彩色区, 单位: ×10-5 s-1)灰色阴影为青藏高原 Fig.4 The average 200 hPa high-level jet (wind speed≥ 36 m·s-1, blue solid line, unit: m·s-1), wind field (vector, unit: m·s-1) and divergence (color area, unit: ×10-6 s-1) (a~c), 500 hPa specific humidity (green solid line, unit: g·kg-1), wind field (vector, unit: m·s-1) and vorticity (color area, unit: ×10-5 s-1) (d~f), 700 hPa (g~i) and 850 hPa (j~l) low-level jet (blue solid line, unit: m·s-1), specific humidity (green solid line, unit: g·kg-1), wind field (vector, unit: m·s-1) and vorticity (color area, unit: ×10-5 s-1) for different grades of rainstorm processes in the eastern foot of the Helan Mountain.The gray shadow denotes the Qinghai-Xizang Plateau |
4.2 热动力特征
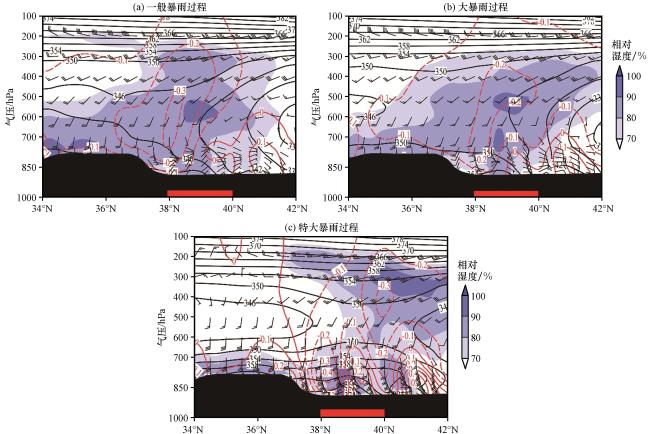
图5 贺兰山东麓不同量级暴雨过程沿106°E的垂直速度(红色等值线, 单位: Pa·s-1, 负值为上升速度)、 假相当位温(黑色实线, 单位: K)和70%以上的相对湿度(彩色区, 单位: %)的垂直剖面黑色阴影为地形, 红色线段为暴雨区域 Fig.5 Vertical cross sections of vertical velocity (red contour, unit: Pa·s-1, negative value is updrafts), potential pseudo-equivalent temperature (black solid line, unit: K) and relative humidity larger than 70% (color area, unit: %) along 106°E for different grades of rainstorm processes in the eastern foot of the Helan Mountain.The black shading is the terrain, the red segments denote the rainstorm area |
4.3 环境对流参数
表2 贺兰山东麓不同量级暴雨过程前与过程中的环境对流参数变化Table 2 The comparison of convective parameters between before rainstorm processes and in rainstorm processes in the eastern foot of the Helan Mountain |
| 暴雨量级 | 时段 | CAPE /(J·kg-1) | K /℃ | SI /℃ | BLI /℃ | Ls /℃ | T85 /℃ | T75 /℃ | SRH /(×102 m2·s-2) | BRN | SR3 /(m·s-1) | SR6 /(m·s-1) | Hwet /km | Hwarm /km |
|---|---|---|---|---|---|---|---|---|---|---|---|---|---|---|
| 一般暴雨 | 过程前 | 160 | 32 | 1.1 | -0.2 | -45 | 26 | 15 | 0.39 | -1.3 | 6.7 | 12.5 | 3185 | 4525 |
| 过程中 | 460 | 35 | 1.0 | -0.4 | -47 | 22 | 14 | 0.15 | -1.3 | 7.7 | 14.2 | 4357 | 4649 | |
| 大暴雨 | 过程前 | 236 | 35 | -0.04 | -1.1 | -48 | 27 | 17 | 0.19 | -1.7 | 5.9 | 8.1 | 2206 | 4642 |
| 过程中 | 398 | 37 | -0.8 | -1.7 | -51 | 24 | 15 | 0.38 | -1.9 | 7.4 | 10.4 | 3598 | 4976 | |
| 特大暴雨 | 过程前 | 98 | 35 | 1.0 | 0.1 | -49 | 21 | 15 | 0.35 | -1.1 | 4.7 | 10.2 | 2022 | 4941 |
| 过程中 | 870 | 45 | -3.1 | -3.2 | -56 | 26 | 14 | 0.95 | -2.1 | 11.6 | 16.9 | 2781 | 5018 |
5 贺兰山东麓不同量级暴雨过程的天气学概念模型
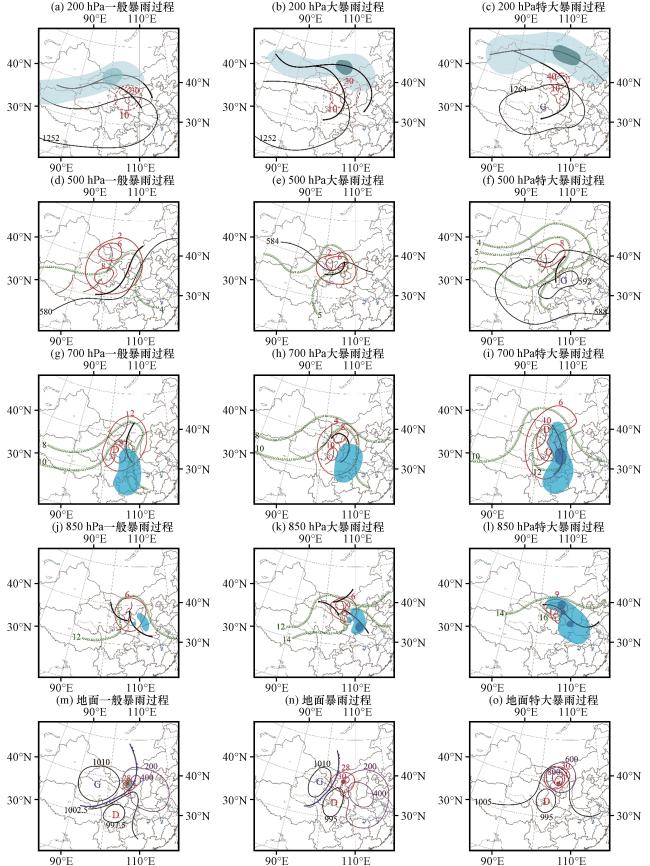
图6 贺兰山东麓不同量级暴雨过程的天气学概念模型 Fig.6 The synoptic conceptual model of different grades of rainstorm processes in the eastern foot of the Helan Mountain. |
 为水平流场, G和D为高低压中心, 彩色区颜色越深, 强度越大; (a~c)中
 为200 hPa位势高度(单位: dagpm),
  为散度(单位: ×10-6 s-1), 彩色区为高空急流; (d~l)中
 为500 hPa位势高度(单位: dagpm),
  为涡度(单位: ×10-5 s-1),
  为比湿(单位: g·kg-1),
  为槽线或切变线, 彩色区为低空急流; (m~o)中
 为海平面气压(单位: hPa),
  为冷锋,
为冷锋,  为K指数(单位: ℃),
  为CAPE(单位: g·kg-1), 红点为暴雨中心, 彩色区为暴雨区
 is the horizontal airflow.The letters G and D denote the high pressure center and low pressure center, respectively.The deeper color area, the more intense the key physical parameters.In Fig.6(a)~(c),
  is the geopotential height of 200 hPa (unit: dagpm),
  is divergence (unit: ×10-6 s-1), the color area denotes the high -level jet area; In Fig.6(d)~(l),
  is the geopotential height of 500hPa (unit: dagpm),
  is vorticity (×10-5 s-1),
  is specific humidity (unit: g·kg-1),
  is the trough line or shear line, the color area denotes the low -level jet area; In Fig.6(m)~(o),
  is the sea level pressure (unit: hPa),
  is the cold front,
  is K index (unit: ℃),
  is CAPE (unit: g·kg-1), the red dot denotes the rainstorm center, the color area is the rainstorm area


