

1 引言
2 资料来源与方法介绍
表1 四川盆地11个区域持续性暴雨个例的分类特征Table 1 Classification of 11 RPHRs in the Sichuan Basin |
| 年份 | 开始时间(月-日) | 持续时间/天 | 最大降雨量/ mm | 降雨中心 | 类型 |
|---|---|---|---|---|---|
| 1961 | 06-24 | 5 | 425.1 | 104.44°E, 31.27°N | 西部型 |
| 1968 | 07-01 | 3 | 288.9 | 105.43°E, 28.88°N | 东部型 |
| 1968 | 08-01 | 3 | 316.4 | 103.53°E, 30.49°N | 西部型 |
| 1974 | 07-25 | 4 | 309.5 | 103.16°E, 29.14°N | 西部型 |
| 1975 | 07-24 | 3 | 252.3 | 104.28°E, 31.50°N | 西部型 |
| 1978 | 07-02 | 3 | 258.8 | 106.46°E, 31.52°N | 西部型 |
| 1989 | 07-08 | 3 | 344.3 | 106.56°E, 30.20°N | 东部型 |
| 2007 | 07-03 | 4 | 384.7 | 107.14°E, 31.22°N | 东部型 |
| 2007 | 07-16 | 4 | 277.4 | 106.17°E, 30.21°N | 东部型 |
| 2012 | 08-30 | 3 | 246.1 | 106.40°E, 31.52°N | 东部型 |
| 2013 | 07-08 | 4 | 423.8 | 103.66°E, 31.00°N | 西部型 |
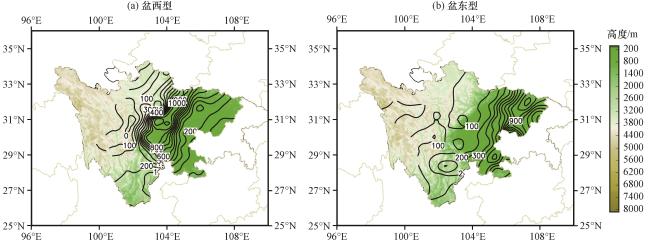
3 RPHRs发生前以及持续期间的环流、 物理量场
3.1 位势高度和风场
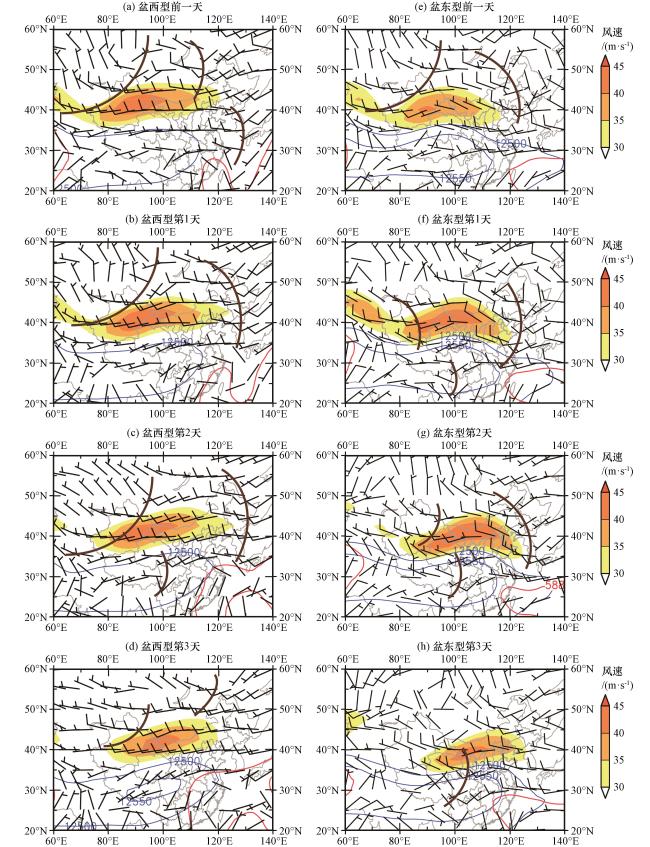
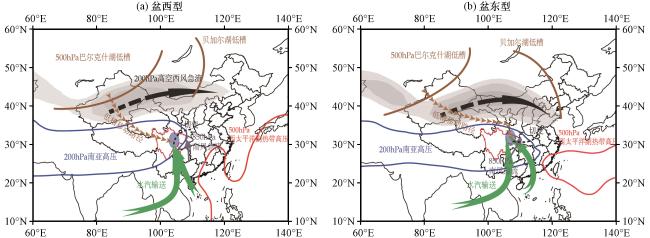
图2 盆西型(a~d)和盆东型(e~h)RPHRs发生前一天以及持续第1、 2、 3天500 hPa风场(风羽, 单位: m·s-1)的合成红色等值线为5850 gpm、 5880 gpm, 蓝色等值线为200 hPa高度12500 gpm、 12550 gpm, 阴影表示200 hPa高度30 m·s-1以上的风速, 棕色实线表示槽线 Fig.2 Composition of wind field (barb, unit: m·s-1) at 500 hPa on the day before and the first three days of the western basin (a~d) RPHRs and the eastern basin type (e~h).The SAH is depicted by 12500 gpm, 12550 gpm isolines of geopotential height (blue contour) and WPSH is depicted by 5850 gpm, 5880 gpm isolines with red contour; the upper level jet stream is depicted by the wind speed at 200 hPa greater than 30 m·s-1 with shadows, the grey lines represent troughs |
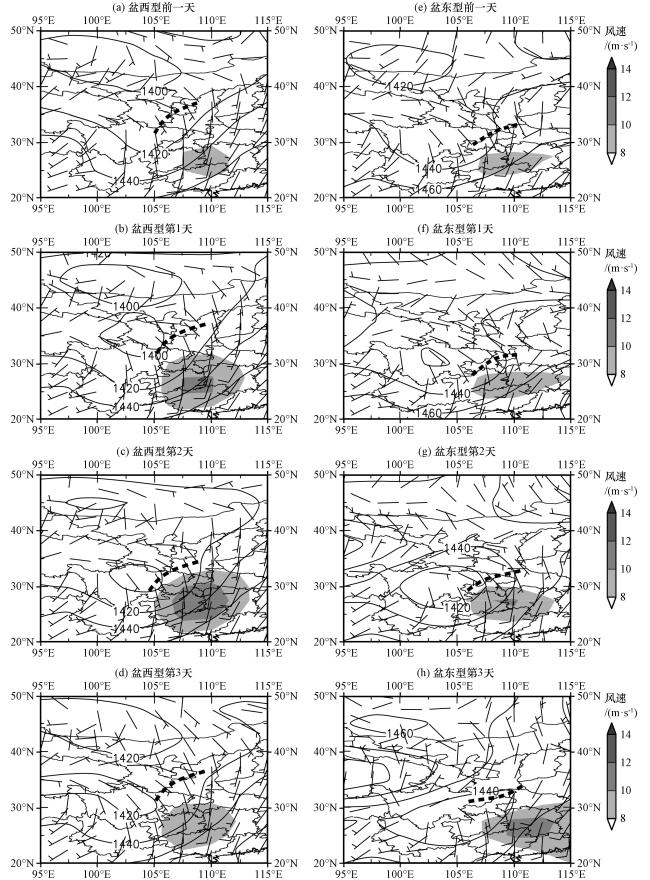
图3 盆西型(a~d)和盆东型(e~h)RPHRs发生前一天以及持续第1、 2、 3天850 hPa位势高度场(等值线, 单位: gpm)、 风场(风羽, 单位: m·s-1)的合成阴影为大于8 m·s-1以上的全风速, 黑色虚线为切变线或辐合线 Fig.3 The composited 850-hPa geopotential height (contour, unit: gpm), wind field (barb, unit: m·s-1), wind speed above 8 m·s-1 (shaded, unit: m·s-1) before and during Western-type (a~d) and Eastern-type (e~h) of RPHRs |
3.2 水汽输送
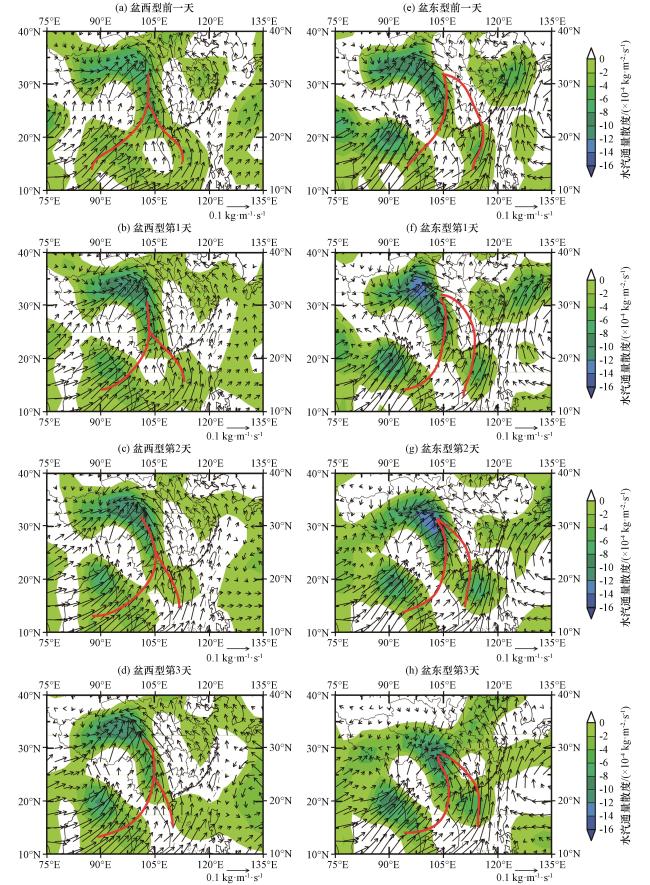
图4 盆西型(a~d)和盆东型(e~h)RPHRs发生前一天以及持续第1、 2、 3天地面积分至30 hPa的水汽通量(矢量, 单位: 0.1 kg·m-1·s-1)以及水汽通量散度的合成场(阴影, 单位: ×10-4 kg·m-2·s-1)红色实线为主要的水汽输送路径 Fig.4 Composition of water vapor flux integrated from the surface to 300 hPa (vector, unit: 0.1 kg·m-1·s-1) and divergence (shaded, unit: ×10-4 kg·m-2·s-1) in Western-type (a~d) and Eastern-type (e~h)of RPHRs.Divergences less than 0 are shaded.Red lines represent transportation routine of water vapor |
3.3 垂直运动和假相当位温特征
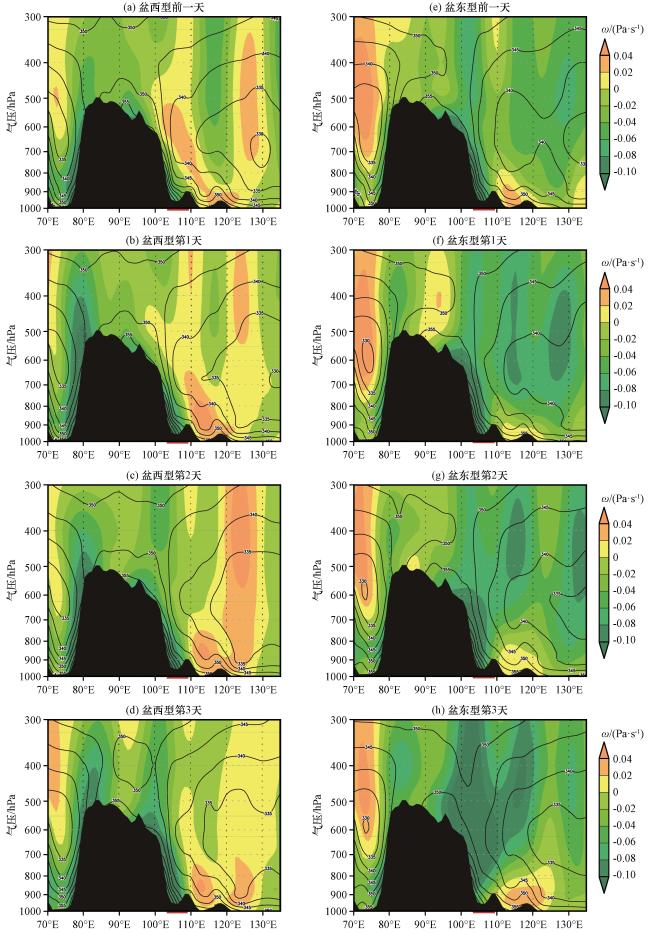
图6 盆西型(a~d)和盆东型(e~h)区域持续性暴雨发生前以及持续期间沿29°N -32°N平均的垂直速度ω(阴影, 单位: Pa·s-1)以及假相当位温(等值线, 单位: K)的垂直剖面合成红色短划线为四川盆地所在位置, 黑色阴影为地形 Fig.6 The vertical-longitude section of vertical velocity (shaded, unit: Pa·s-1 ) and pseudo-equivalent temperature (contour, unit: K) before and during Western-type (a~d) and Eastern-type (e~h) of RPHRs.The topographic profile is taken along 30.5°N, the physical variables are taken along the value averaged from 29°N to 32°N. The red lines represent the Basin of Sichuan, and the black shaded is for terrain |
4 环流异常的对比分析
4.1 500 hPa环流异常
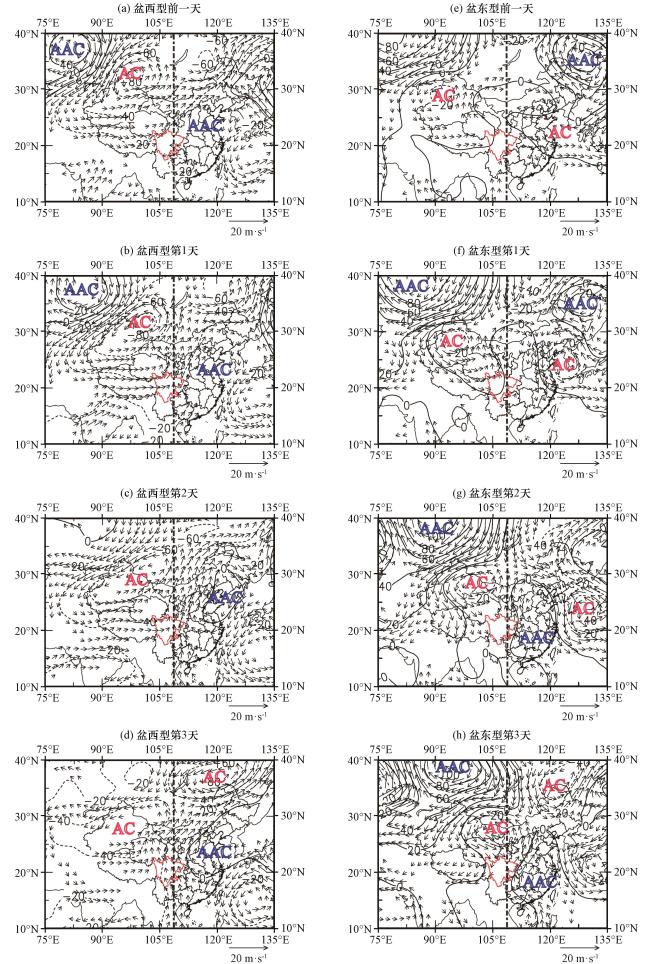
图7 盆西型和盆东型RPHRs500 hPa位势高度距平场(等值线, 单位: gpm)以及异常风场(矢量, 单位: m·s-1)的合成图2 m·s-1以下的风速被省略, 黑色点划线为105°E经线, AAC表示反气旋性环流距平, AC表示气旋性环流距平 Fig.7 The composition of geopotential height (contour, unit: gpm) and wind (vector, unit: m·s-1) anomalies at 500 hPa before and during Western-type and Eastern-type of RPHRs.The longitudinal line of 105°E is indicated by dashed line.Wind speed less than 2 m·s-1 is omitted.AAC represents the anticyclonic circulation anomaly, while AC represents a cyclonic circulation anomaly |
4.2 250 hPa环流异常和Rossby波活动通量
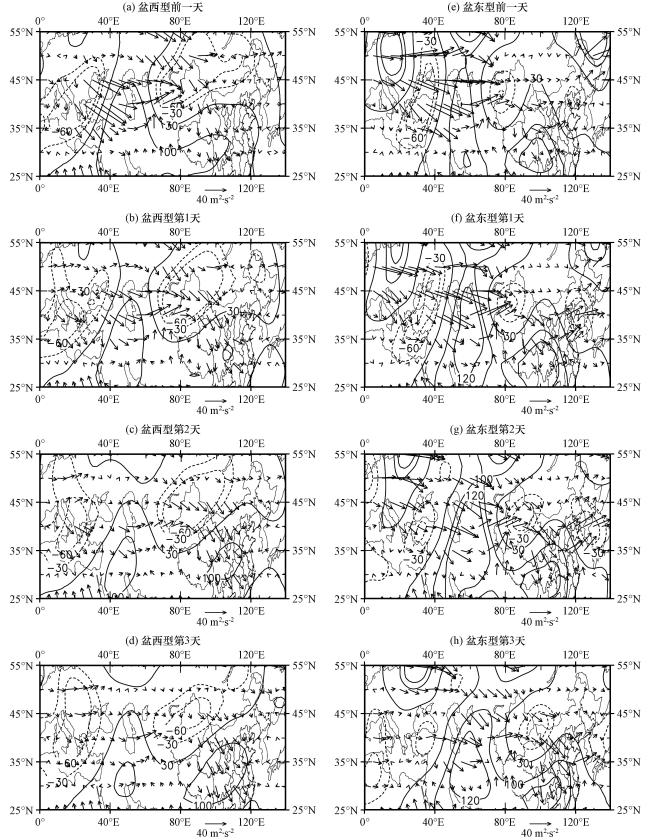


图8 盆西型和盆东型RPHRs发生前以及持续过程中250 hPa Rossby波活动通量(矢量, 单位: ×108 m2·s-2)以及位势高度距平场(等值线, 单位: gpm)的合成Fig.8 The composition of Rossby wave activity flux (vector, unit: ×108 m2·s-2) and geopotential height anomalies (contour, unit: gpm) at 250 hPa before and during Western-type and Eastern-type of RPHRs |