1 引 言
2 资料来源
3 降水概况和天气尺度特征
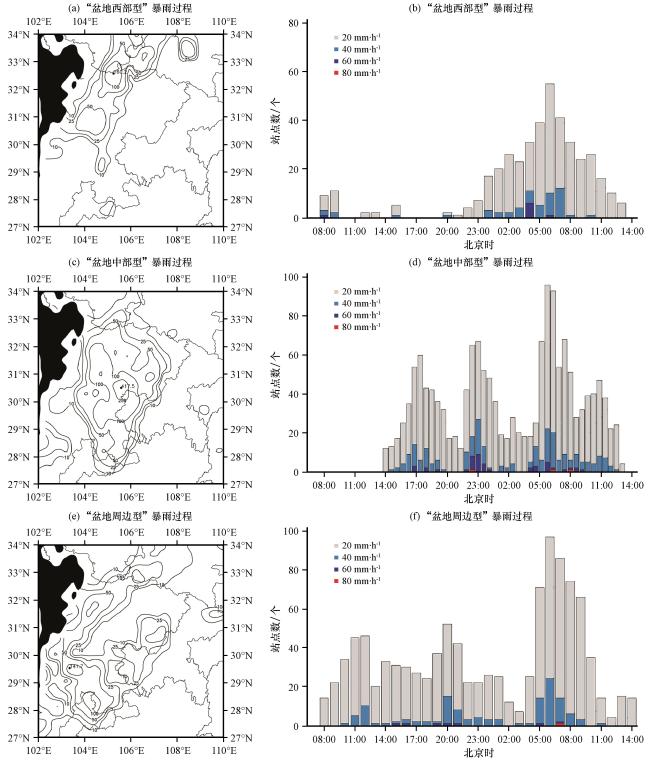
图2 三次暴雨过程期间累计降水量分布(左, 单位: mm)和短时强降水站点数(右)时间序列左侧黑色阴影区为海拔高于3500 m的区域 Fig.2 Distribution of cumulated precipitation(left, unit: mm) and time sequence diagram of short-duration heavy rain stations (right) during the three heavy rain processes.The black shaded area in the left figures indicating the area with an altitude higher than 3500 m |
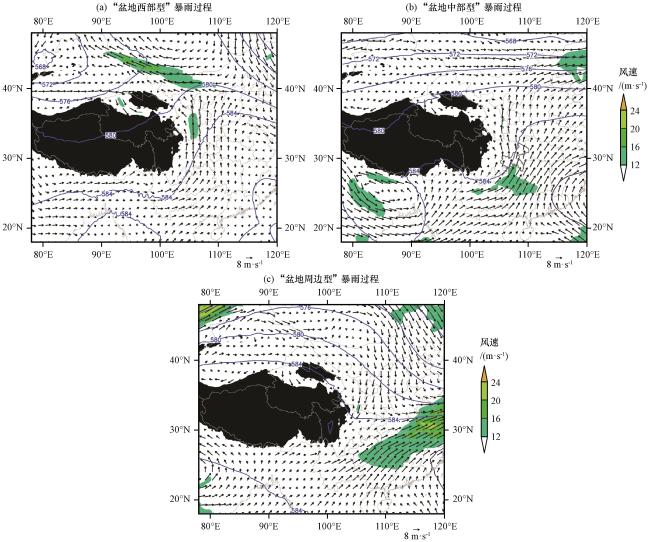
图3 三次暴雨过程期间的平均环流形势场等值线为500 hPa高度场(单位: dagpm), 矢量为700 hPa风场(单位: m·s-1), 彩色区为700 hPa风速, 黑色阴影区为海拔高于3500 m的区域 Fig.3 Average circulation field during the three heavy rain processes.The contour is 500 hPa geopotential height (unit: dagpm); the vector is 700 hPa wind field (unit: m·s-1), the color area is wind speed at 700 hPa, the black shaded area indicating the area with an altitude higher than 3500 m |
4 对流环境与多尺度系统相互作用
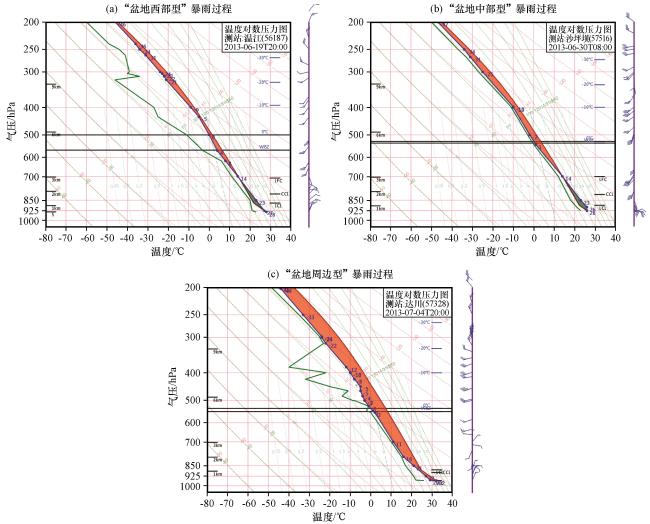
4.1 对流环境条件对比分析
4.2 多尺度系统相互作用特征
4.2.1 对流风暴系统的垂直结构
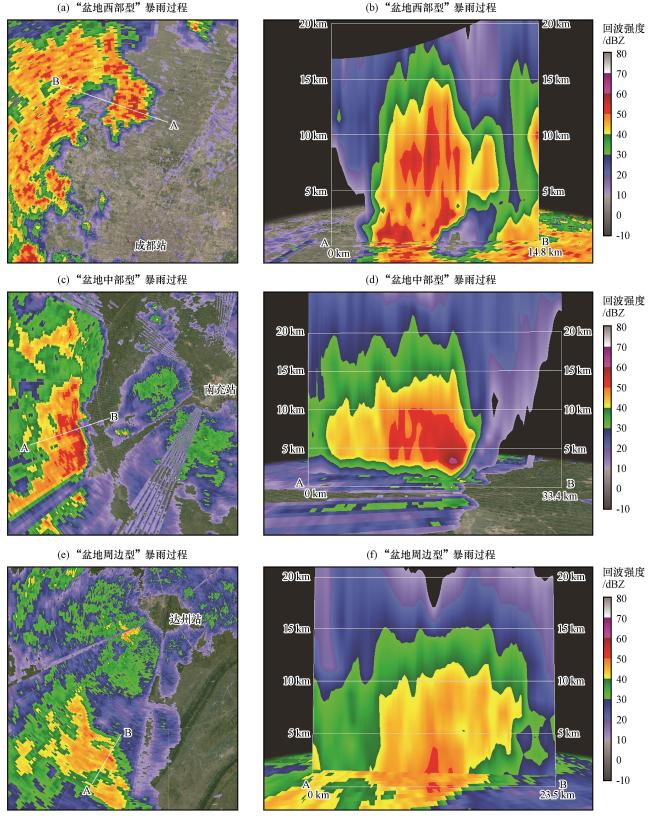
图5 三次强降水过程中最强降水时段3.0°仰角雷达回波(左)和对流系统垂直剖面示意图(右)的对比分析(单位: dBZ)左侧图中线段AB为右侧垂直剖面位置, 从A到B为对流系统移动方向 Fig.5 Radar echo on 3.0 ° elevation (left) and the vertical diagram of convective systems (right) during the most intensive precipitation period of the three heavy rain processes.Unit: dBZ.The line “AB” in the left side indicating the vertical profile position, the direction from A to B is convection system movement direction |
4.2.2 对流风暴系统的触发与演变
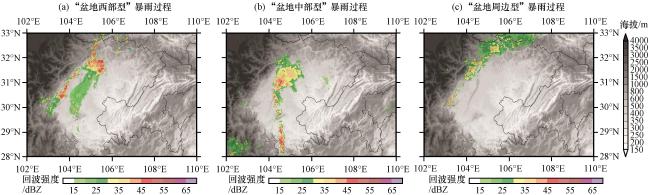
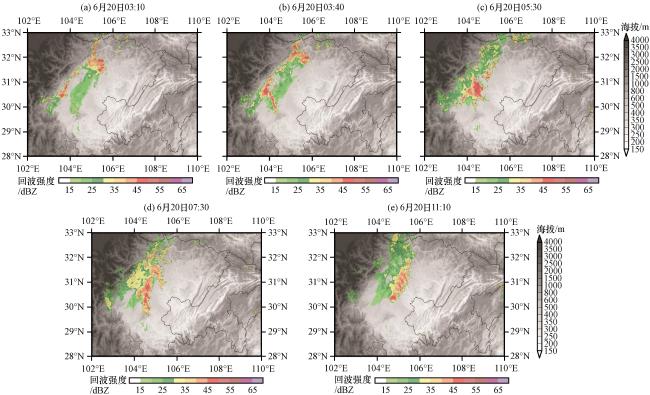
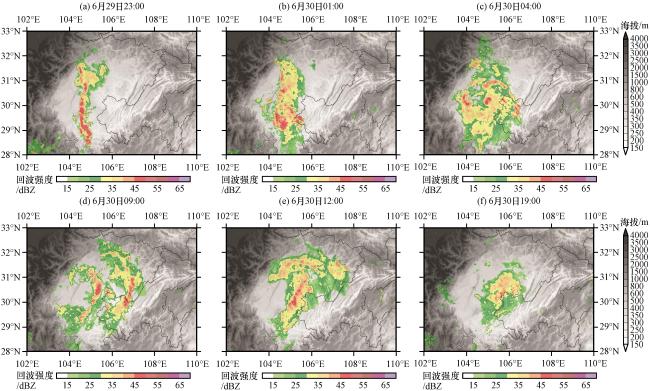
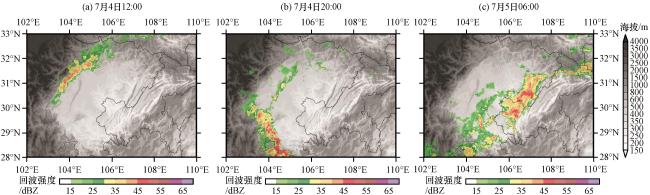
4.2.3 多尺度系统在对流系统演变过程中的作用
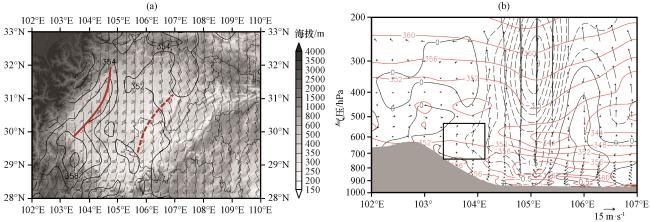
图10 “盆地西部型”暴雨过程对流初生前期(6月20日01:00)中低层环境场(a)及其沿31.1°N的垂直剖面(b)(a)中风向杆为700 hPa水平风场(单位: m·s-1), 黑色等值线为700 hPa假相当位温(单位: K), 红色粗实线为850 hPa水平风切变线, 红色粗虚线为925 hPa水平风切变线, 填色区为海拔高度(单位: m); (b)中红色等值线为假相当位温(单位: K), 黑色等值线为垂直速度(单位: Pa·s-1, 实线为下沉运动, 虚线为上升运动), 矢量表示垂直纬圈环流(单位: m·s-1), 灰色阴影表示地形, 黑色方框为触发对流的上升运动区 Fig.10 The synthetic map of the middle and lower layers ( a ) and the vertical section along 31.1°N ( b ) during the prophase of initial stage (at 01:00 on 20 June) of convection for the the Western Basin Type heavy rain process.In Fig.10(a), the wind barb for horizontal wind field (unit: m·s-1) on 700 hPa, the black contour for pseudo-equivalent potential temperature (unit: K) on 700 hPa, the red solid line for horizontal wind shear on 850 hPa, the red dashed line for horizontal wind shear on 925 hPa, the shaded for altitude(unit: m); In Fig.10(b), the red contour for pseudo-equivalent potential temperature (unit: K), the black contour for vertical velocity(unit: Pa·s-1, solid line indicate sinking motion, dashed line indicate ascending motion), the arrow for zonal circulation (unit: m·s-1), the gray shaded area for terrain, the area in the black box indicating the updraft zone triggering the convection |
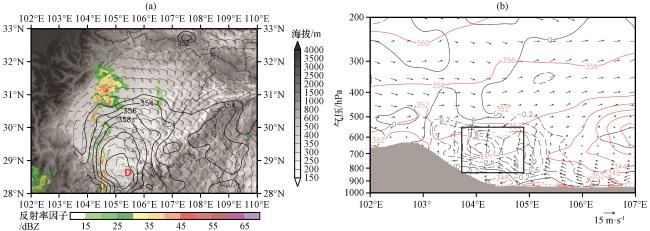
图11 “盆地中部型”暴雨过程对流初生前期(6月29日20:00)850 hPa风场(风向杆, 单位: m·s-1)、 假相当位温(等值线, 单位: K)、 雷达基本反射率因子(彩色区, 单位: dBZ)与地形(灰色阴影, 单位: m)叠加(a)及其沿28.5°N的垂直剖面(b)(b)中红色等值线为假相当位温(单位: K), 黑色等值线为垂直速度(单位: Pa·s-1, 实线为下沉运动, 虚线为上升运动), 矢量表示垂直纬圈环流(单位: m·s-1), 灰色阴影表示地形, 黑色方框为触发对流的上升运动区 Fig.11 The overlay map of wind field (barb, unit: m·s-1) at 850 hPa, pseudo-equivalent potential temperature (black contour, unit: K) on 850 hPa, basic radar reflectivity (color area, unit: dBZ) and terrain (gray shade, unit: m) (a) and the vertical section along 28.5°N (b) during the prophase of initial stage (at 20:00 on 29 June) of convection for the Central Basin Type heavy rain process.In Fig.11(b), the red contour for pseudo-equivalent potential temperature (unit: K), the black contour for vertical velocity (unit: Pa·s-1, solid line indicating sinking motion, dashed line indicating ascending motion), the arrow for zonal circulation (unit: m·s-1 ), the gray shaded area for terrain, the area in the black box indicating the updraft zone triggering the convection |
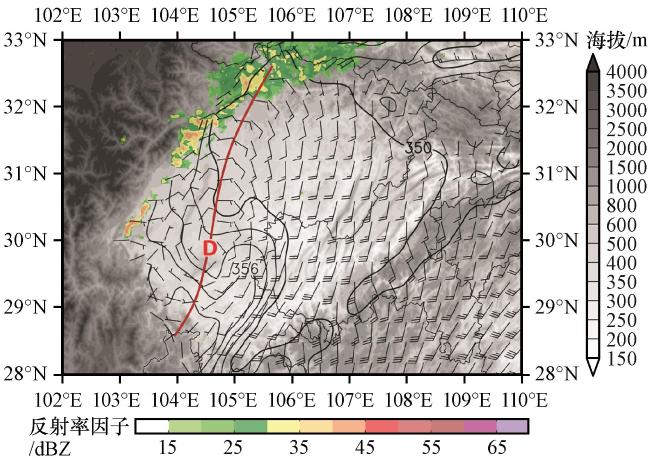
图12 “盆地周边型”暴雨过程第一阶段(7月4日10:00)850 hPa风场(风向杆, 单位: m·s-1)、 假相当位温(等值线, 单位: K)、 雷达基本反射率因子(彩色区, 单位: dBZ)与地形(灰色阴影, 单位: m)叠加图红色粗实线为850 hPa切变线 Fig.12 The overlay map of wind field (barb, unit: m·s-1) at 850 hPa, pseudo-equivalent potential temperature (black contour, unit: K) at 850 hPa, basic radar reflectivity (color area, unit: dBZ ) and terrain ( gray shadow, unit: m ) during the first stage(at 10:00 on 4 July) of the convection for the Peripheral Basin Type heavy rain process.The red solid line indicating horizontal wind shear at 850 hPa |
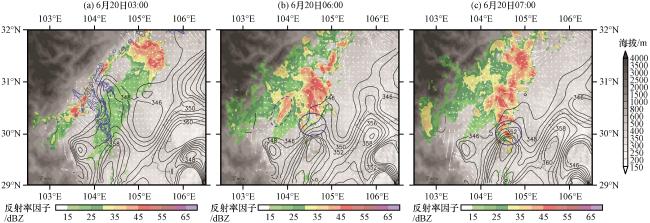
图13 “盆地西部型”暴雨过程对流发展移动阶段地面风场(矢量, 单位: m·s-1)、 假相当位温(等值线, 单位: K)、 基本反射率因子(彩色区, 单位: dBZ)与地形(灰色阴影, 单位: m)叠加图(a)中实线蓝色圆形区为1 h后基本反射率因子达35 dBZ以上的区域 Fig.13 The overlay map of wind field (vector, unit: m·s-1), pseudo-equivalent potential temperature (black contour, unit: K) and basic radar reflectivity (color area, unit: dBZ) on surface and the terrain (gray shadow, unit: m) during the development stage of convection for the Western Basin Type heavy rain process.In Fig.13(a), the blue contour indicating the area with basic radar reflectivity≥35 dBZ one hour later |
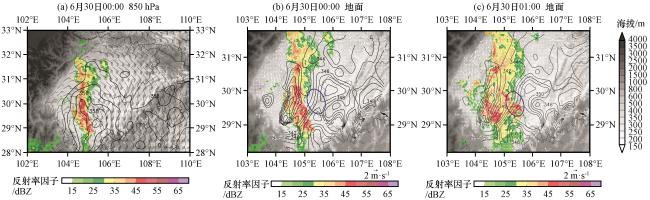
图14 “盆地中部型”暴雨过程线状对流稳定发展阶段的风场[风羽(a)和矢量(b~c), 单位: m·s-1]、 假相当位温(等值线, 单位: K)、 基本反射率因子(彩色区, 单位: dBZ)与地形海拔(灰色阴影, 单位: m)叠加图Fig.14 The overlay map of wind field [wind barb (a) and arrow (b~c), unit: m·s-1], pseudo-equivalent potential temperature (black contour, unit: K), basic radar reflectivity (color area, unit: dBZ ) and terrain (gray shadow, unit: m) at 850 hPa (a) and surface (b~c) during the development stage of linear convection for the Central Basin Type heavy rain process |
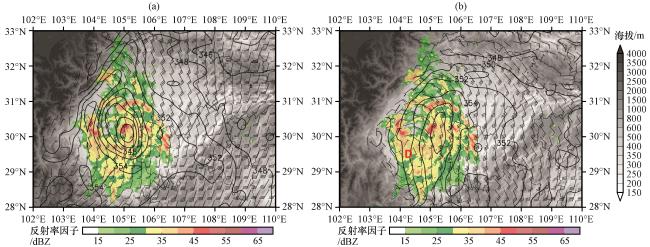
图15 “盆地中部型”暴雨过程涡旋状对流阶段(6月30日04:00)700 hPa (a)、 850 hPa(b)风场(风向杆, 单位: m·s-1)、 假相当位温(等值线, 单位: K)、 基本反射率因子(彩色区, 单位: dBZ)与地形(灰色阴影, 单位: m)叠加Fig.15 The overlay map of wind field (barb, unit: m·s-1), pseudo-equivalent potential temperature (contour, unit: K), basic radar reflectivity (color area, unit: dBZ ) and terrain (gray shadow, unit: m) at 700 hPa (a) and 850 hPa (b) during the vortex convection stage (at 04:00 on 30 June) for the Central Basin Type heavy rain process |
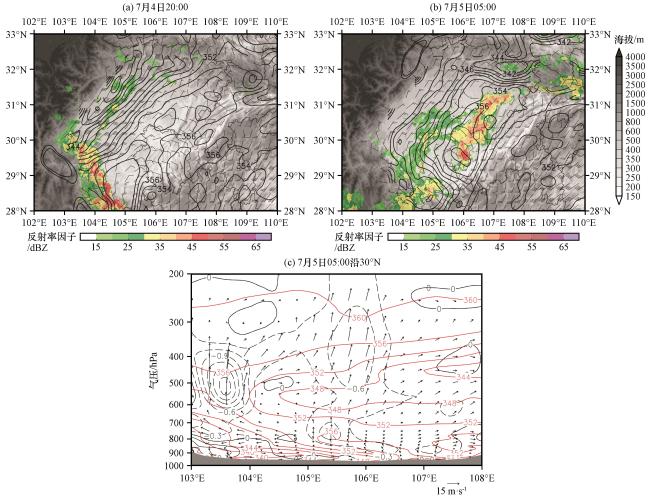
图16 “盆地周边型”第二阶段和第三阶段850 hPa风场(风向杆, 单位: m·s-1)、 假相当位温(等值线, 单位: K)、 基本反射率因子(彩色区, 单位: dBZ)和地形海拔(灰色阴影, 单位: m)的叠加(a~b)以及7月5日05:00沿30.00°N的垂直剖面(c)(c)中红色等值线为假相当位温(单位: K), 黑色等值线为垂直速度(单位: Pa·s-1, 实线为下沉运动, 虚线为上升运动), 矢量表示垂直纬圈环流(单位: m·s-1), 灰色阴影表示地形 Fig.16 The overlay map of wind field (barb, unit: m·s-1) at 850 hPa, pseudo-equivalent potential temperature (contour, unit: K) at 850 hPa, basic radar reflectivity (color area, unit: dBZ) and terrain (gray shadow, unit: m) on the second stage and the third stage during the Peripheral Basin Type heavy rain process (a~b) and the vertical section along 30.00°N at 05:00 on 5 July (c).In Fig.16(c), the red contour for pseudo-equivalent potential temperature (unit: K), the black contour for vertical velocity(unit: Pa·s-1, solid line indicating sinking motion, dashed line indicating ascending motion), the arrow for zonal circulation (unit: m·s-1 ), the gray shaded area for terrain |