

1 引言
城市降水特征研究始终是气候、 环境等领域关注的热点问题(王华等, 2019; 郭大梅等, 2020)。关于城市降水过程的个例研究, 无论稳定性降水还是对流性降水, 前人已经开展了大量研究工作(周林帆等, 2019; 李英华等, 2020)。例如, 康玉霞等(2002)通过分析多普勒雷达资料的强度场、 速度场及VAD产品分析一次稳定性降水过程的不同阶段特征。孙继松等(2006)从观测事实入手, 结合简要的理论分析, 揭示了北京城区的一次中尺度对流暴雨系统的启动机制以及分析了城市边界层在这次局地暴雨过程中的作用。Miao et al(2011)利用中尺度模式WRF的模拟以及敏感性试验研究城市化对北京夏季降雨的影响, 结果表明城市确实影响着风暴移动和降雨量, 城市表面往往导致降雨在局部集中, 高层城市核心除了增加暴雨百分比还可能分叉降雨路径。由于降水资料的限制, 研究大多对一次或几次降水过程的天气系统、 降水演变特征和机制进行观测分析或数值模拟分析。
上海作为中国超大城市之一, 其降水极端性特征和日变化特征已被一些学者研究过。如贺芳芳和赵兵科(2009)利用上海地区11个气象站1979 -2008年5 -9月降水资料分析了近30年上海地区暴雨的年、 月际及暴雨成因的变化特征。高洁和漆梁波(2015)利用2009 -2013年上海市加密观测自动站降水资料和110报警信息资料对上海市短时强降水与红警的关系进行了分析, 对红警标准提出建议。上述文章侧重于暴雨和降水的极端性特征方面的研究。Hou and Chen(2019)利用11个站点数据研究上海地区夏季降水日变化特征, 表明早上的降雨特征是小雨到中雨, 下午的降雨主要是大到超级大雨, 但由于站点稀疏降水的空间特征不能被准确地表示。和常规观测站资料相比, 加密自动气象观测资料具有高时空分辨率等优点, 可以更清晰地描述降水空间结构和时间特征(杨萍等, 2017)。因此, 本文利用上海地区高时空密度的自动站降水资料, 研究上海地区降水的时空精细特征。这对于更好地认识上海地区降水规律、 提高城市防灾减灾能力具有较为深远的意义。
2 资料来源与方法介绍
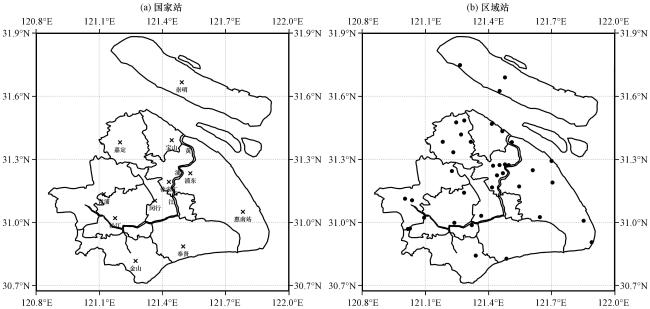
选取上海地区小时降水资料, 参考杨萍等(2017)的方法对数据资料的完整性进行了评估, 并通过气候极值检查的方法对资料进行质控, 形成经质控的小时降水资料集。研究采用了2007年1月1日至12月31日的自动站逐小时降水资料, 选取了缺测率较低的49个自动站开展研究。图1 为各站点的分布情况, 资料来源于上海市气象局信息中心。文中涉及的地图基于国家测绘地理信息局标准地图服务网站下载的审图号为沪S(2020)032的分省地图制作, 底图无修改。文中时间均为北京时。
降水数据采用通用的业务标准, 选取1 h降水量≥0.1 mm记为有降水, 连续出现“有降水”的过程记为一次降水过程(张雅乐和俞小鼎, 2021)。定义单站一次降水过程从开始至结束的小时数为各站的降水过程持续时间。文中首先将加密观测资料与常规站资料进行对比, 分析了上海地区总体降水精细特征, 接下来对不同季节降水的空间特征以及降水日变化季节差异及峰值特征进行分析, 在此基础上分析了不同季节降水持续性特征及其累积降水量在总降水量中的贡献率差异, 最后重点选取短历时降水, 研究其年变化趋势特征。
3 降水分布和季节降水特征
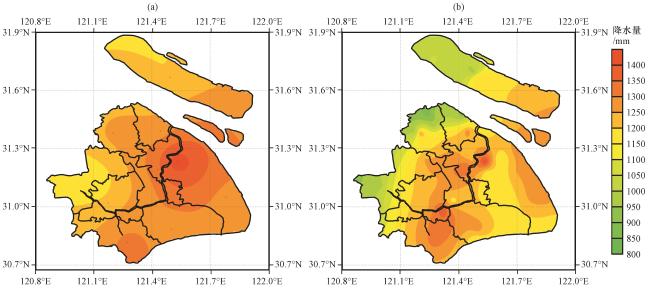
与常规观测分析相比, 由于加密观测站点更为密集, 加密观测数据能够更加精细地反映上海地区的降水特征。图2 (b)不仅反映了主雨带的降水高值中心, 还反映了浦东沿海、 嘉定、 宝山的局部小中心。
从上海地区春、 夏、 秋、 冬四个季节降水量多年平均的空间分布(图3 )可以看出, 各个季节平均降水量存在明显的空间分布差异。夏季降水的空间分布格局与全年的格局类似, 这与夏秋季降水总量占据全年降水量的比例最大(41.9%)密不可分。夏秋在全年降水中占主导贡献, 夏季降水是秋季的1.7倍, 是春季的2.0倍, 是冬季的3.2倍。
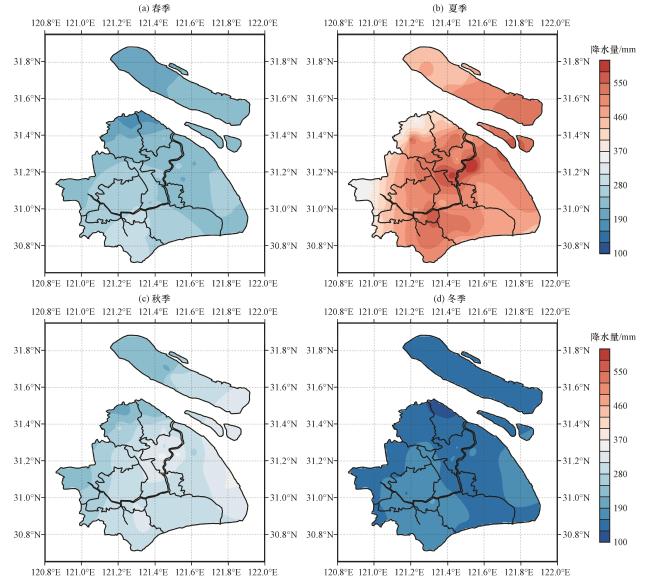
降水空间分布格局反映出降水分布与盛行风、 下垫面特征等因子密切联系。春季, 西南暖湿气流强度逐渐活跃并且影响范围逐渐北抬, 处于上海南部的金山区受影响的频次更高, 在金山出现了降水高值中心。夏季, 受西南水汽输送的影响, 降水总体呈东北-西南走向, 呈现普遍高量值和局部多个高值中心的特征。秋季, 受东北气流输送的影响, 降水中心减少、 仅剩的高值中心梯度减弱且呈现位置南移的特征。冬季, 受西北气流输送的影响, 全市降水整体偏低, 空间差异化最小, 高值中心消失。因此, 季节降水分布的差异与季节性环境风场的转变是有关联的。
根据孙继松和舒文军(2007)的研究, 热岛效应和季节性变化的环境风场间相互作用是导致季节性降水变化的原因。取x坐标轴沿盛行风方向, 并假定水平方向只存在x方向上的扰动量, 热岛问题简化为x-z平面上的二维问题, 中尺度扰动满足Boussinesq近似, 推导出能够阐明相关机理的公式:
式中: 为水平散度垂直变化项; 为位温梯度相对水平风的变化项; 为湍流扩散项; λ为常用参量。在时间平均状态下, 略去湍流扩散项的影响, 即水平散度的垂直变化受平均温度梯度和水平风速大小的制约。在城区的上风方向, 由于热岛效应是沿城市中心区向郊区减弱的, , 因此 水平散度随高度减小, 表现为低层辐散气流随高度减弱, 或者辐合气流随高度加强, 根据质量方程, 边界层的垂直运动表现为下沉气流。同理, 在城区的下风方向, 水平散度随高度增加, 边界层内的垂直运动表现为上升气流。水平温度梯度越大, 平均水平风速越小, 边界层内的垂直运动速度也越大。
上海地区一年四季均存在热岛现象, 春夏季热岛强度强、 秋冬季热岛强度弱(沈钟平等, 2017)。春季风力微弱, 盛行风向不明显, 热岛效应影响弱, 降水呈现城市北部东部偏少、 南部偏多的特征。夏季盛行西南风, 风力强盛, 随着热岛效应的加强, 降水受城市热岛效应的影响最较大, 降水呈现城市下游(浦东陆家嘴、 闵行东部)偏多, 上游偏少的特征。秋季受东北偏北风的影响, 风力较弱, 城市热岛也减弱, 浦东沿海降水中心向南偏移。冬季受西北偏北风影响, 降水量分布特征表现为北少南多的特征, 但由于城市热岛强度弱, 空间量级差异和降水中心并不显著。
4 降水日变化和日峰值时间
将一日分成4段(01:00 -06:00, 07:00 -12:00, 13:00 -18:00, 19:00 -24:00), 一日4段累积降水量的百分比差异如表1 所示。一日4段的累积降水占比差异不大, 白天的总降水量略大于晚上, 降水日变化主峰值区间位于午后, 次峰值区间为上午。夏季, 下午(13:00 -18:00)降水最多; 春季, 凌晨(01:00 -06:00)降水最多。
表1 一日4段累积降水占比的季节性差异分析Table 1 Seasonal differences in the proportion of cumulative precipitation in the four periods of a day |
| 时间段 | 春季 | 夏季 | 秋季 | 冬季 | 全年 |
|---|---|---|---|---|---|
| 全天 | 21.3% | 43.5% | 25.5% | 13.6% | 100.0% |
| 凌晨(01:00 -06:00) | 6.3% | 7.5% | 6.5% | 3.8% | 24.1% |
| 上午(07:00 -12:00) | 5.4% | 11.0% | 6.4% | 3.0% | 25.8% |
| 下午(13: 00 -18:00) | 4.1% | 13.8% | 5.6% | 3.1% | 26.6% |
| 晚上(19:00 -24:00) | 4.9% | 9.5% | 6.0% | 3.2% | 23.5% |
从上海地区2007 -2017年不同季节年平均降水量的日变化特征(图4 )可以看出, 上海地区一日不同时次降水分配存在明显波动, 降水日变化峰值出现时间主要表现为下午、 凌晨、 晚上三类位相特征, 不同季节降水日变化型差异较大。秋、 冬季降水呈早晚双峰型特征, 秋季主峰在晚上, 冬季主峰在凌晨。春、 夏两季日变化型均为单峰型变化, 春季凌晨的降水日峰型特征突出。夏季峰值出现在午后至傍晚(15:00 -18:00)。
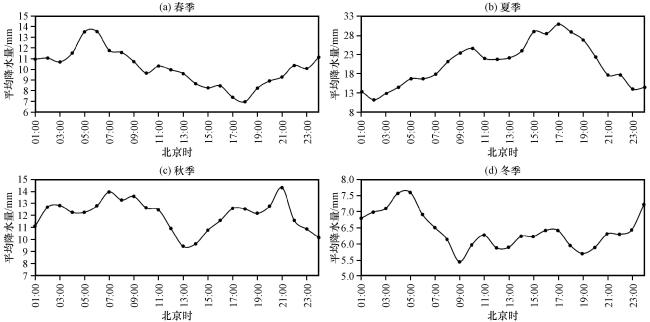
午后出现的峰值一般被认为是日辐射的热力作用造成, 午后地表升温迅速, 浅层空气的热力稳定度降低, 容易触发对流活动, 有助于短时而集中的降水发生(Yu et al, 2007; 李建等, 2008; 杨萍等, 2017)。
而造成凌晨的降水峰值原因被很少研究到, 其形成机制有如下几种解释: (1)受青藏高原作用, 春季在高原的东坡存在浓厚的云系且稳定维持, 云系在傍晚达到峰值同时向东传播, 且云系传播速度较快, 在凌晨时分正好到达长江下游地区, 造成了凌晨的降水峰值(Wang et al, 2004; Yu et al, 2007); (2)增强的西南风及其与静止锋的相互作用导致有组织的对流在清晨形成和发展(Chen et al, 2012)。
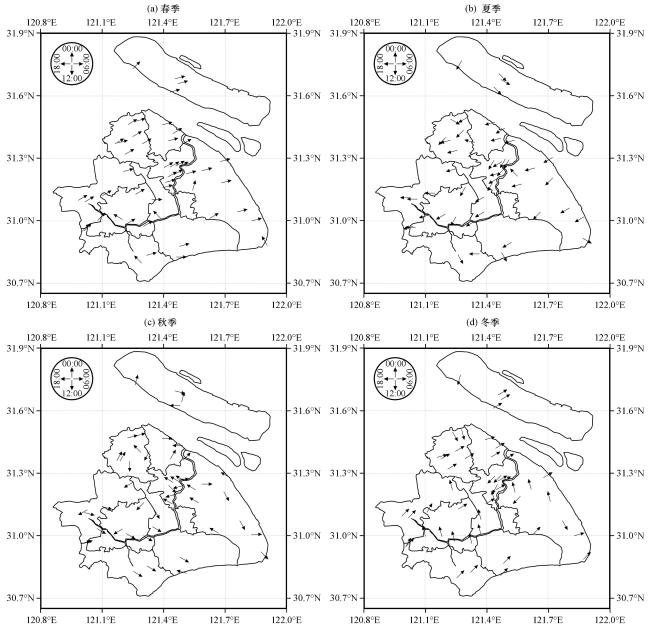
综上, 春夏季降水日变化位相的空间一致性强, 春季日降水峰值出现在凌晨, 夏季日降水峰值在傍晚。
5 季节降水量的持续性特征
为了研究上海地区降水持续性特征, 根据降水过程持续时间的长短, 将不同持续时间的降水划分为: 短历时降水(过程持续时间为1~6 h)、 中历时降水(过程持续时间为7~12 h)和长历时降水(过程持续时间为13~98 h), 其频次占比分别为84.2%, 10.5%和5.3%, 降水量贡献占比如表2 所示, 全年降水中, 短历时降水总量值的贡献率最高, 其次是长历时降水的贡献率, 中历时降水所占的贡献率最低。
表2 2007—2017年上海地区持续性降水贡献率Table 2 Contribution of precipitation duration in Shanghai |
| 降水历时 | 春季 | 夏季 | 秋季 | 冬季 |
|---|---|---|---|---|
| 短历时(1~6 h) | 36.90% | 46.78% | 33.80% | 23.33% |
| 中历时(7~12 h) | 37.55% | 25.52% | 25.80% | 25.42% |
| 长历时(13 h~) | 25.55% | 27.70% | 40.39% | 51.26% |
由不同季节三类持续性降水对应各季节降水的贡献率(表2 )可见, 不同历时降水在各个季节的贡献格局差异明显: 短历时降水为夏季降水带来的贡献最大; 而长历时降水对秋冬季降水的贡献率均位居第一, 冬季长历时降水的贡献率甚至超过50%, 占主导地位; 在春季中短历时降水的贡献率较高, 下文进一步研究不同持续性降水的四季贡献分布。
从四个季节短历时降水累积降水量贡献率的空间分布(图6 )可知, 四个季节短历时降水所带来贡献率的分布格局是完全不同的。春季, 短历时降水量贡献率的大值中心主要集中上海西北部及东南部, 在中心城区、 嘉定南部、 闵行、 浦东北部等区域则为低值区域。夏季, 短历时降水总体贡献率最高, 全市大部贡献率在50%以上, 在西南气流的作用下, 在城市的下游和海(江)陆交界区的近岸带(浦东西部、 宝山区)出现高值中心[图6 (b)]。秋季, 短历时降水贡献率分布呈现“东北高西南低”的格局, 冬季短历时降水贡献较小, 全市差异化小。
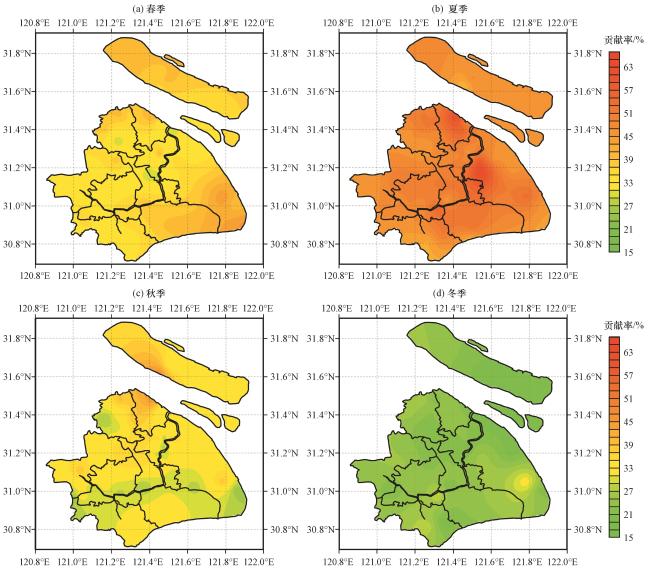
综合分析发现, 全市短历时降水受海陆(江陆)分布以及城市热岛的影响大, 在高密度的城市中心及陆家嘴一带容易出现短历时降水贡献率高值区, 在长江口附近(嘉定东部、 宝山)或海陆交界的近岸区(浦东南汇)也容易出现短历时降水贡献率的高值区。
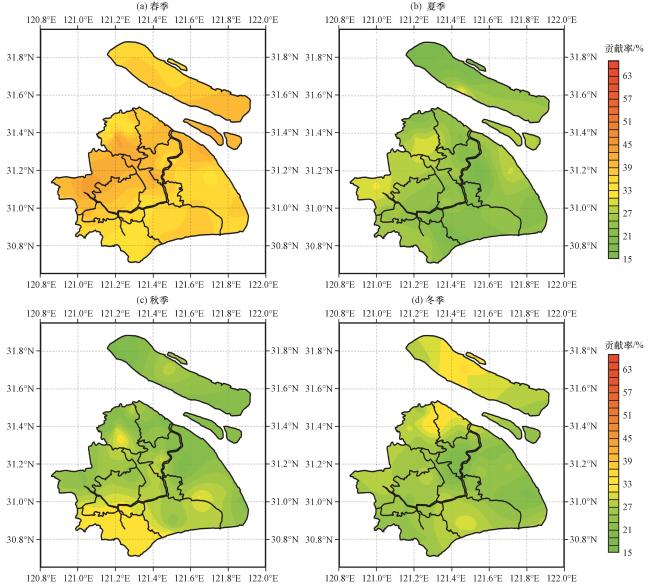
长历时降水贡献率空间分布(图8 )显示, 秋冬季长历时降水占有重要贡献。尤其是冬季, 研究时段内长历时降水贡献率普遍在50%以上, 其中, 中心城区和浦东北部为长历时降水贡献的高值区。秋季, 全市长历时降水量贡献率也整体偏高, 高值中心集中在浦东区北部、 嘉定区。夏季, 高值在上海南部和崇明西部。春季, 金山区是长历时降水贡献率的高值区, 浦东西部、 嘉定区有零散的高值中心。对比四个季节长历时降水贡献分布可以发现, 中心城区、 崇明区存在较大长历时降水贡献率。
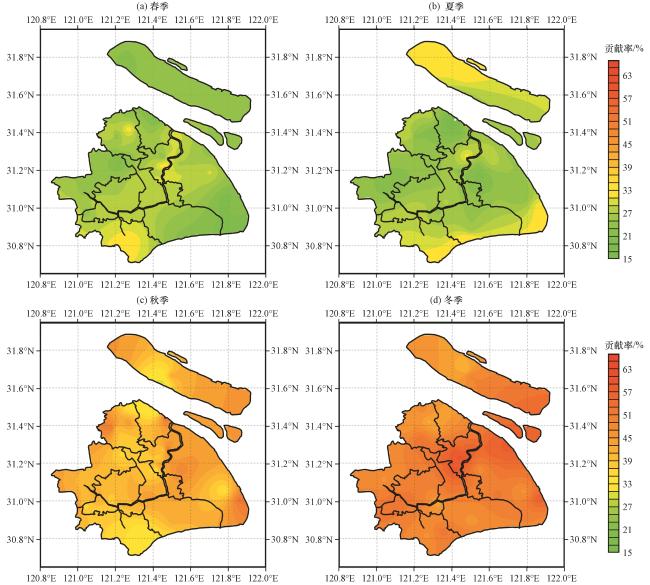
通过对比不同历时降水贡献(图6 ~8 )可以看到, 夏季短历时降水对城市热岛的响应更为明显, 其中中心城区下游水陆交界地区(宝山、 浦东西部)响应更明显。
6 短历时降水变化趋势特征
短历时降水为全年降水带来的贡献最大, 也是夏季降水的主要类型, 本文重点分析短历时降水变化趋势的空间分布(图9 )。图9 (a)表明, 近11年短历时降水量的年变化趋势有明显的区域特征, 在市区短历时降水以下降趋势为主, 在郊区短历时降水以上升趋势为主。例如, 中心城区及上游闵行区降水量则存在明显的减少趋势, 而嘉定区、 浦东区是降水量趋势增加的地区。这可能和近年上海地区城市化进程有关, 城市化导致累积降水在城区及其下风向区域增多、 而在上风向地区减少(钟时, 2016), 也可能其他热力环流密切相关, 这在顾问等(2015)的研究中被提及。图9 (b)为短历时降水累积时间的变化趋势的空间分布, 表明上海大部分地区短历时降水均呈现增加趋势, 增加最明显的区域为城市下游和郊区。这些特征反映嘉定区、 浦东新区的短历时降水量增加趋势可能由短历时降水总持续时间(频次)的增多引起。从短历时降水强度的变化趋势的空间分布[图9 (c)]可以看出, 降水强度的趋势分布和降水量的趋势分布较为一致, 也呈现出市区站及城市上游的下降趋势, 以及郊区站上升趋势的特征。
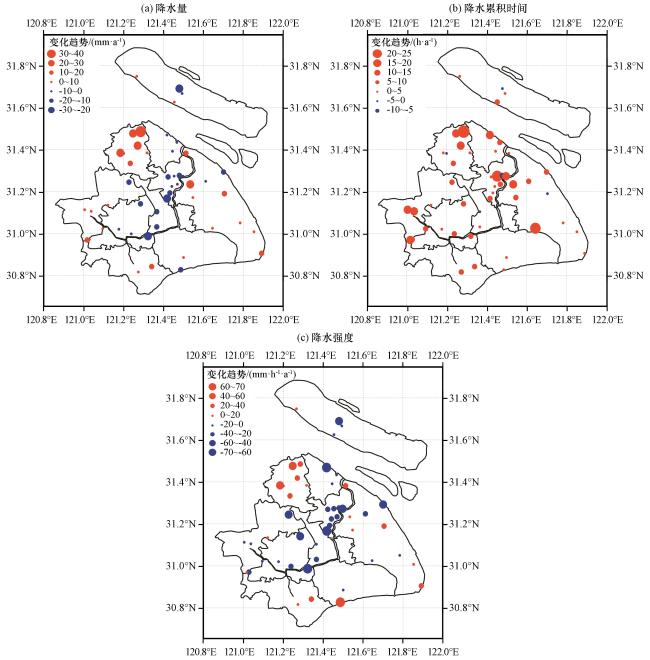


图9 2007—2017年上海地区短历时降水量变化趋势(a, 单位: mm·a-1)、 降水累积时间变化趋势(b, 单位: h·a-1)和降水强度变化趋势(c, 单位: mm·h-1·a-1)的空间分布Fig.9 The distribution of the change trend of short-duration precipitation (a, unit: mm·a-1), precipitation cumulative time (b, unit: h·a-1) and precipitation intensity (c, unit: mm·h-1·a-1) in Shanghai from 2007 to 2017 |
7 结论与讨论
本文使用2007—2017年上海地区质控后的49个站观测资料, 从季节降水空间分布、 降水日变化、 降水持续性特征、 降水趋势变化几个不同角度, 揭示了上海地区降水的精细特征, 并对其成因进行初步分析, 主要得到以下结论:
(1) 加密观测资料可捕捉上海地区降水的精细特征, 降水分布以东北-西南走向为主, 雨带上出现多中心的特征, 即中心城区、 松江南部和浦东沿海三个高值中心和其他小中心的特征。
(2) 春夏季降水日变化位相的空间一致性强, 均为单峰型变化, 春季日降水峰值出现在凌晨, 夏季日降水峰值在傍晚。
(3) 夏季受西南风和热岛效应的共同影响, 中心城区下游水陆交界地区(宝山、 浦东西部)为短历时降水贡献的高值区。
(4) 市区站短历时降水量以下降趋势为主, 郊区站短历时降水量以上升趋势为主, 其中城区及其下风向的嘉定区、 浦东区西部是降水量增加趋势最快的地区, 这是由短历时降水频次的增多引起。
文章通过统计分析方法捕捉了上海地区降水时空尺度上的精细特征并对成因进行初步研究, 对于精细化预报水平的提高具有重要意义。然而, 受研究角度、 分析方法、 资料范围等方面的限制, 还存在一定的局限性。造成凌晨降水峰值的原因有两种解释, 哪种解释更为合理、 其适用范围等仍是未解的问题, 需要用更大范围的降水资料、 环流资料、 空间连续的卫星资料, 对相关问题进行更为深入的研究。
文章讨论了城市盛行风和城乡温度梯度相互作用对季节性降水分布的影响。事实上, 降水特征受多尺度系统和多因子的影响, 以下问题的研究也是非常重要的: (1)四季降水对城市热岛效应的响应差异是否和气候变化的大背景相关联; (2)如果关联, 气候变化和局地城市化对降水的贡献差异如何。这需要用更长时间的温度降水观测资料进行年际、 年代际的分析, 或选取个例进行理论分析, 甚至用数值试验。城市降水特征的机理还需要在以后的工作中进一步收集资料进行更加深入的分析和研究。