1 引言
2 数据来源与方法介绍
2.1 模式方案
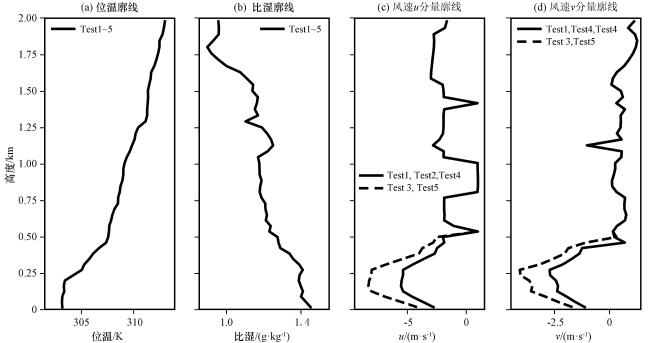
2.2 试验设置
表1 各模拟试验的初始气象参数设置Table 1 Setting of the initial meteorological parameters of each simulation |
| 变量 | Test 1控制试验 | Test2地表加热试验 | Test3风切变试验 | Test4粗糙度试验 | Test5综合试验 |
|---|---|---|---|---|---|
| 地表热通量/(K·m·s-1) | 0.01 | 0.06 | 0.01 | 0.01 | 0.06 |
| 低层风切变/s-1 | 0.009 | 0.009 | 0.013 | 0.009 | 0.013 |
| 地表粗糙度/m | 0.1 | 0.1 | 0.1 | 0.5 | 0.5 |
2.3 边界层高度、 夹卷层厚度和湍流动能的计算
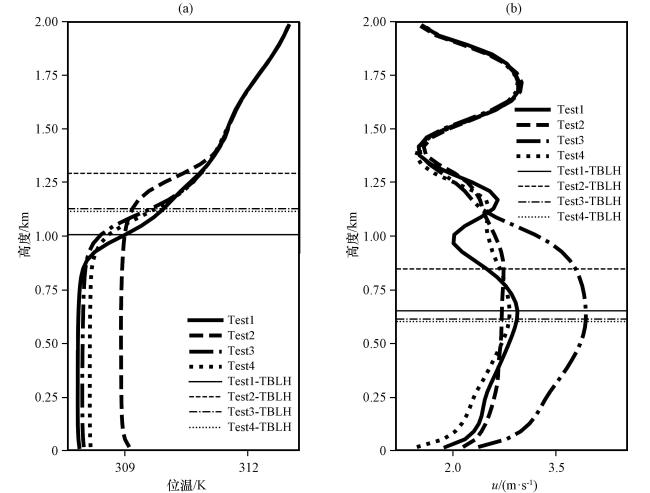
图2 各模拟试验的位温廓线(a)和风速u分量廓线(b)的模拟结果水平线代表热力边界层高度(TBLH)或动力边界层高度(DBLH) Fig.2 Simulation results of potential temperature profiles (a) and wind speed u profiles (b) of each simulation.Horizontal lines are thermodynamic boundary layer height (TBLH) or dynamic boundary layer height (DBLH) |
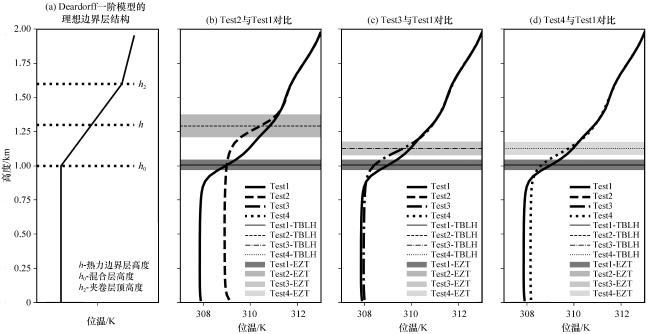
图3 理想对流边界层结构示意图、 各模拟试验的大气边界层结构和夹卷层厚度(EZT)(b)~(d)中水平线和阴影区分别代表各试验的热力边界层高度(TBLH)和夹卷层厚度(EZT) Fig.3 Schematic diagram of the ideal convective boundary layer structure, atmosphere boundary layer structures and entrainment zone thickness (EZT) of each simulation.In Fig.3(b)~(d), horizontal lines and shadows represent the thermodynamic boundary layer height (TBLH) and the entrapment zone thickness (EZT) of each simulation |
3 地表加热、 低层风切变和地表粗糙度对边界层结构的影响
3.1 对边界层高度的影响
3.2 对夹卷层厚度和湍流动能的影响
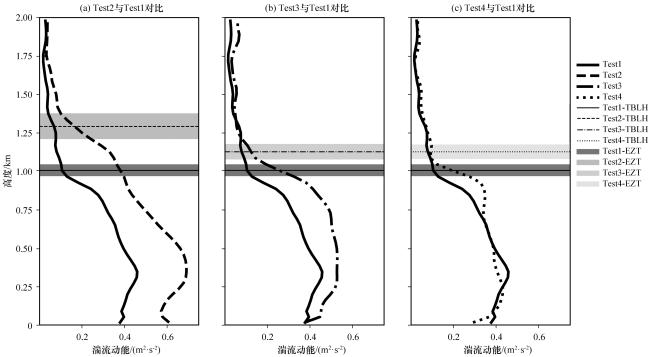
图4 各模拟试验的湍流动能(TKE)廓线计算结果(单位: m2·s-2)水平线和阴影分别代表各试验的热力边界层高度(TBLH)和夹卷层厚度(EZT) Fig.4 Calculated results of turbulent kinetic energy (TKE) profiles of each simulation.Unit: m2·s-2.Horizontal lines and shadows represent the thermodynamic boundary layer height (TBLH) and the entrapment zone thickness (EZT) of each simulation, respectively |