1 引言
2 数据来源和方法介绍
2.1 数据来源
2.2 方法介绍
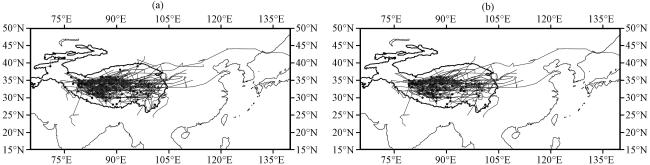
图1 2001 -2017年7月高原低涡(a)及暖性高原低涡(b)的源地及其移动路径分布黑色圆点为高原低涡源地, 灰色实线为高原低涡移动路径 Fig.1 Distribution of the initial location and movement path of the Qinghai-Xizang Plateau Vortex (QXPVs) (a) and warm QXPVs (b) in July from 2001 to 2017.The black dot is the initial location of the QXPVs, and the gray solid line is the movement path of the QXPVs |
3 结果分析
3.1 春季地表净云辐射效应与7月高原低涡的关系
表1 2001 -2017年7月高原低涡的7个特征的平均值及其标准差Table 1 Average of 7 characteristics of QXPVs in July and its standard deviation from 2001 to 2017 |
| 参数 | 频数/个 | 最小位势高度/gpm | 强度/gpm | 移出数/个 | 移出率/% | 暖涡数/个 | 暖涡率/% |
|---|---|---|---|---|---|---|---|
| 均值 | 43.9 | 5804.0 | 9.3 | 10.6 | 23.8 | 31.8 | 72.2 |
| 标准差 | 4.0 | 7.5 | 0.95 | 3.4 | 6.9 | 5.3 | 7.3 |
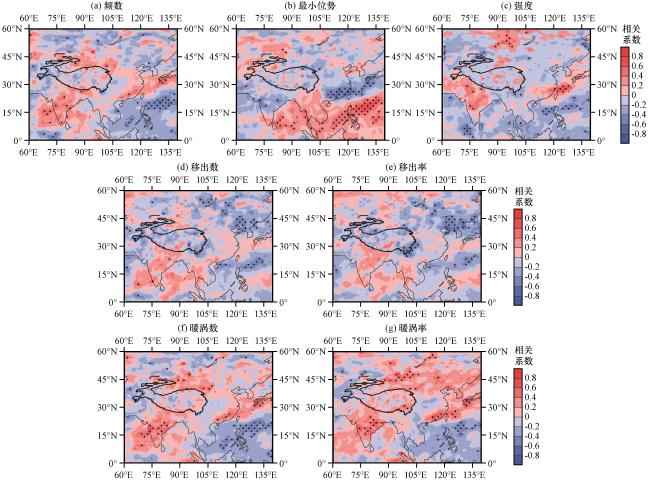
图3 2001 -2017年春季地表净云辐射效应与7月高原低涡频数(a)、 最小位势高度(b)、 强度(c)、 移出数(d)、 移出率(e)、 暖涡数(f)、 暖涡率(g)的相关系数分布打点区域为在α=0.1水平上显著相关 Fig.3 Distribution of correlation coefficient between the net surface cloud radiative effect in Spring andthe frequency (a), minimum geopotential height (b), intensity of QXPVs (c), frequency of outgoing QXPVs (d), rate of outgoing QXPVs (e), frequency of warm QXPVs (f), rate of warm QXPVs (g) in July from 2001 to 2017.The dotted area is significant at α=0.1 |
表2 2001 -2017年春季地表净云辐射效应与7月高原低涡7个特征SVD分析结果的方差贡献率以及时间序列的相关系数Table 2 The variance contribution rate of the surface net cloud radiative effect in spring and of 7 characters of the QXPVs in July from 2001 to 2017 and the correlation coefficient of the time series from SVD analysis |
| SVD模态 | 1 | 2 | 3 |
|---|---|---|---|
| 方差贡献率 | 53.57% | 25.06% | 12.40% |
| 累积方差贡献率 | 53.57% | 78.63% | 91.03% |
| 相关系数 | 0.87 | 0.91 | 0.88 |
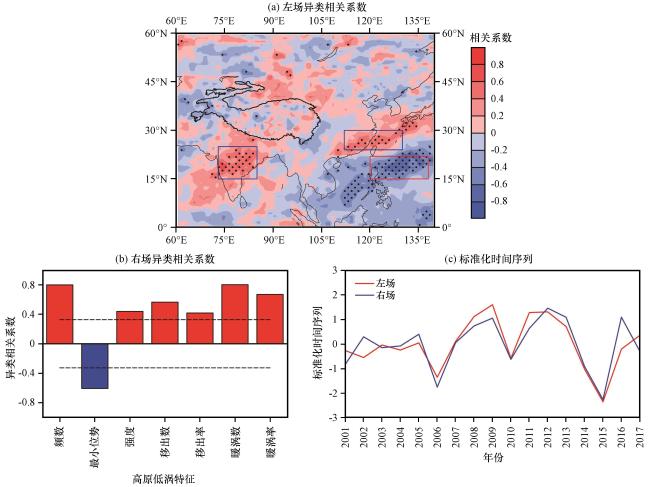
图4 SVD第一模态对应的左场(春季地表净云辐射效应)异类相关系数(a, 打点区域为在α=0.1上显著), 右场(7月高原低涡各特征)异类相关系数(b, 虚线为α=0.1显著的相关系数值)及标准化时间序列(c)Fig.4 The heterogeneous correlation coefficient of the left field (a, surface net cloud radiative effect in Spring, and the dotted area is significant at α=0.1) and the right field (b, 7 characters of QXPVs in July, and the dotted line is the significant correlation coefficient value of α=0.1), standardized time series (c) of the first mode of SVD |
3.2 云辐射效应有利和不利于高原低涡发生发展年份环流形势差异
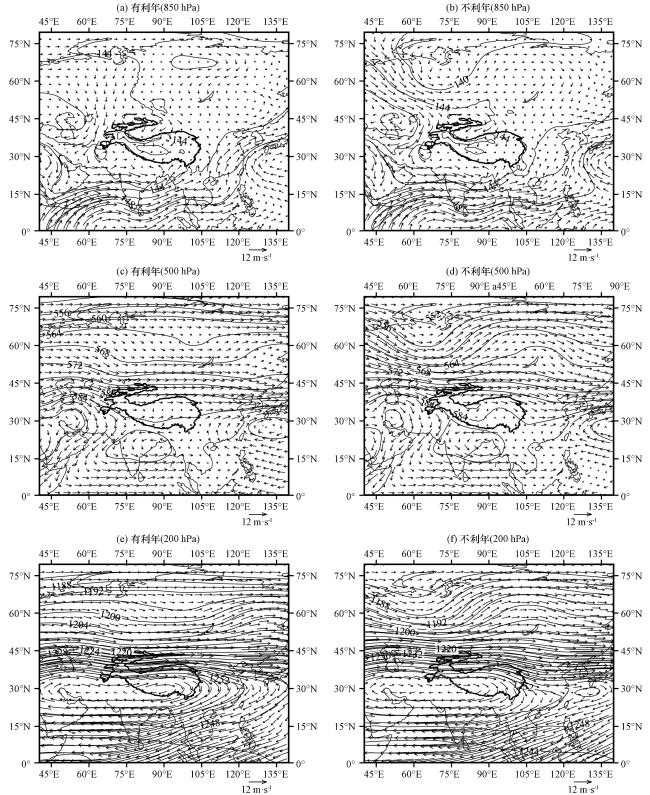
图5 春季地表净云辐射效应有利(左)和不利(右)于高原低涡发生发展年的850 hPa (a, b)、 500 hPa (c, d)和200 hPa (e, f)平均风场(矢量, 单位: m·s-1)和位势高度场(等值线, 单位: dagpm)分布Fig.5 The distribution of wind field (vector, unit: m·s-1) and geopotential height field (contour, unit: dagpm) at 850 hPa (a, b), 500 hPa (c, d) and 200 hPa (e, f) when the net cloud radiative effect on the surface in spring is favorable (left) and unfavorable (right) for the occurrence and development of QXPVs |
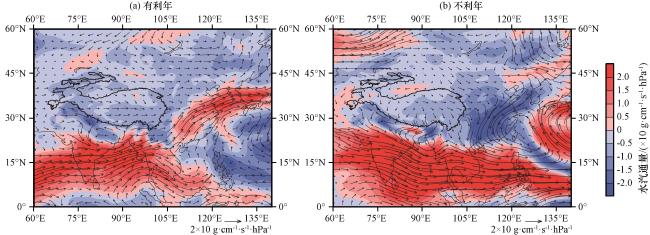
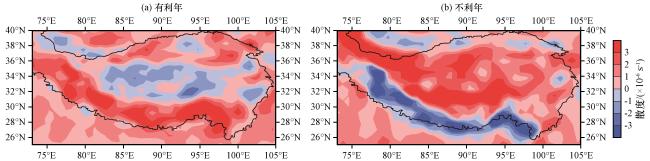
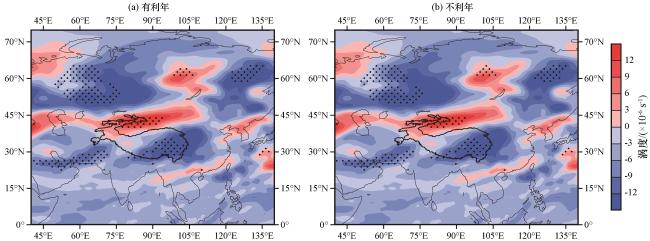
3.3 云辐射效应影响低涡发生发展的可能机制
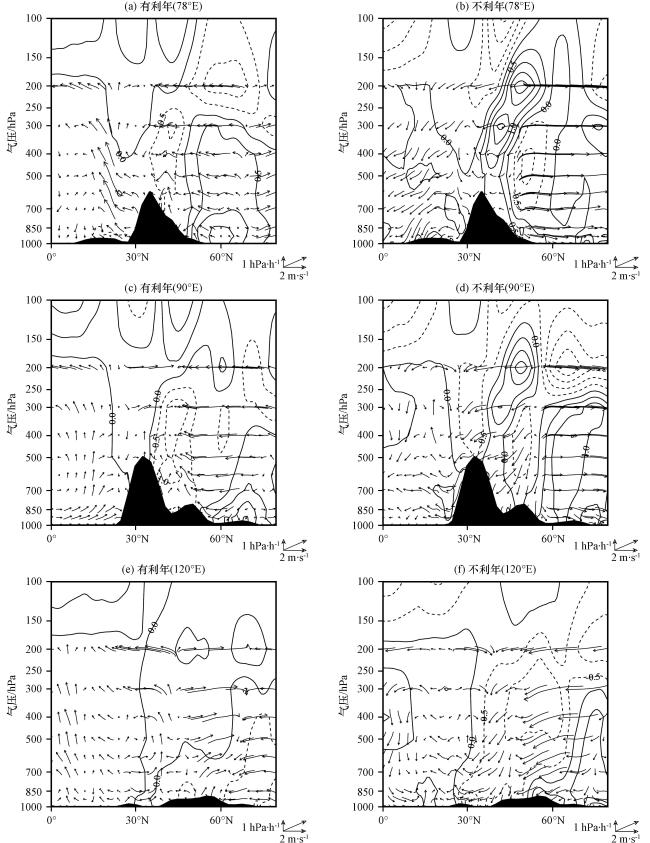
图9 有利年(左)和不利年(右)温度场(等值线, 单位: K)和风场(矢量, 水平风单位: m·s-1; 垂直风单位: hPa·h-1)平均距平沿78°E(a, b), 90°E(c, d), 120°E(e, f)的经向垂直剖面Fig.9 The meridional vertical cross-section of the average temperature (contour, unit: K) and wind (vector, horizontal wind: m·s-1, vertical motion: hPa·h-1) anomalies in favorable (left) and unfavorable (right) years along 78°E (a, b), 90°E (c, d), 120°E (e, f) |
3.4 云辐射效应指数与环流场的关系
表3 2001—2017年春季地表净云辐射效应指数与7月高原低涡7个特征的相关系数Table 3 Correlation coefficients between the surface net cloud radiative effect index in spring and the 7 characteristics of QXPVs in July from 2001 to 2017 |
| 指数 | 频数 | 最小位势高度 | 强度 | 移出频数 | 移出率 | 暖涡频数 | 暖涡率 |
|---|---|---|---|---|---|---|---|
| 0.89*** | -0.46* | 0.32 | 0.58** | 0.40 | 0.83*** | 0.59** | |
| 0.65*** | -0.32 | 0.04 | 0.43* | 0.31 | 0.74*** | 0.65*** | |
| 0.80*** | -0.43* | 0.48* | 0.51** | 0.34 | 0.61*** | 0.32 |
*、 **、 ***分别表示在α=0.1、 0.05、 0.01水平上显著 |
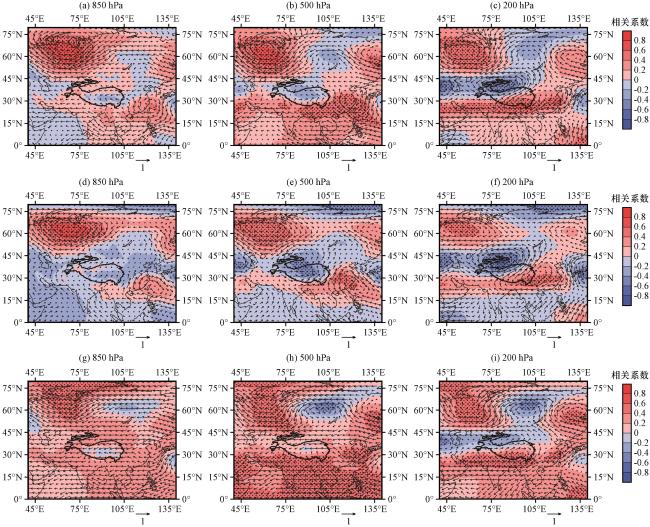
图10 总的云辐射效应指数(I tot) (a~c)、 印度半岛关键区春季云辐射效应指数( ) (d~f)、 西太关键区春季云辐射效应指数( ) (g~i)与7月850 hPa(左)、 500 hPa(中)、 200 hPa(右)风场(矢量)及位势高度(彩色区)的相关系数分布打点区为云辐射效应指数与位势高度的相关系数在α=0.1水平上显著 Fig.10 The distribution of the correlation coefficient between the surface net cloud radiative effect index in Spring of total (a~c), Indian Peninsula (d~f), West Pacific (g~i) key region and the wind field (vector), geopotential height (color area) at 850 hPa (left), 500 hPa (center), 200 hPa (right) in July.The dotted area is the correlation coefficient between the cloud radiative effect index and the geopotential height is significant at the level of α=0.1 |