

1 引言
2 资料来源与方法介绍
2.1 资料来源
2.2 热源计算
2.3 多雪年和少雪年的划分
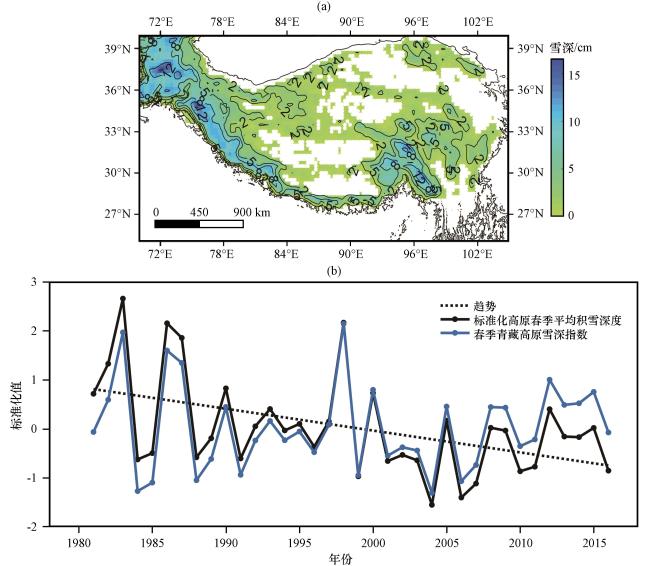
图1 1981 -2016年春季(3 -5月)青藏高原区域(70°E -105°E, 25°N -40°N)平均雪深(a, 单位: cm)及春季积雪深度的标准化指数(TPSD指数)(b)Fig.1 Springtime (from March to May, MAM) mean snow depth (a, unit: cm) and the time series of the TPSD (b) over the Qinghai-Xizang Plateau (QXP) domain (70°E -105°E, 25°N -40°N) from 1981 to 2016 |
3 青藏高原春季积雪与BSISO的关系
表1 1981 -2016年夏季, 高原多雪年、 少雪年BSISO1各个相位出现的平均天数Table 1 Mean number of days for different phases of BSISO1 for 1981 -2016 summer season with excessive and reduced spring TPSD and its climatology |
| 类型 | 相位 | |||||||
|---|---|---|---|---|---|---|---|---|
| 1 | 2 | 3 | 4 | 5 | 6 | 7 | 8 | |
| 多雪年/天 | 10.2(+1.1) | 11(-2.5) | 13.8(+1.4) | 18.2**(+6.7) | 13.4(-0.2) | 9.8(-0.2) | 7*(-3.3) | 8.6(-2.9) |
| 少雪年/天 | 10(+0.9) | 13.4(-0.1) | 10.4(-2.0) | 7**(-4.5) | 12.4(-1.2) | 12.3(+2.3) | 14.9**(+4.6) | 11.6(+0.1) |
| 所有年/天 | 9.1 | 13.5 | 12.4 | 11.5 | 13.6 | 10 | 10.3 | 11.5 |
括号里面的数字表示多雪年、 少雪年平均天数与多年平均之间的差值; *和**分别表示通过了90%和95%显著性水平检验 |
表2 1981 -2016年夏季, 高原多雪年、 少雪年BSISO2各个相位出现的平均天数Table 2 Mean number of days for different phases of BSISO2 for 1981 -2016 summer season with excessive and reduced spring TPSD and its climatology |
| 类型 | 相位 | |||||||
|---|---|---|---|---|---|---|---|---|
| 1 | 2 | 3 | 4 | 5 | 6 | 7 | 8 | |
| 多雪年/天 | 12(+0.3) | 16**(+4.4) | 15.6**(+4.6) | 11.8(0) | 8.6(-2.8) | 11.2(-1.4) | 9.2(-1.6) | 7.6*(-3.4) |
| 少雪年/天 | 9.9(-1.8) | 8.6*(-3.0) | 7.9*(-3.1) | 10(-1.8) | 13.7(+2.3) | 15.3(+2.7) | 12.7(+1.9) | 13.7*(+2.7) |
| 所有年/天 | 11.7 | 11.6 | 11 | 11.8 | 11.4 | 12.6 | 10.8 | 11 |
括号里面的数字表示多雪年、 少雪年平均天数与多年平均之间的差值; *和**分别表示通过了90%和95%显著性水平检验 |
表3 TPSD指数与BSISO1和BSISO2不同相位出现的平均天数的相关系数Table 3 Correlation coefficients between detrended TPSD index and the mean number of days for different phases of the BSISO1 and BSISO2 |
| 指数 | 不同相位平均天数的相关系数r | |||||||
|---|---|---|---|---|---|---|---|---|
| 第1相位 | 第2相位 | 第3相位 | 第4相位 | 第5相位 | 第6相位 | 第7相位 | 第8相位 | |
| BSISO1 | 0.05 | -0.10 | 0.11 | 0.53** | 0.04 | -0.26 | -0.33* | -0.16 |
| BSISO2 | -0.05 | 0.18 | 0.33** | 0.15 | -0.19 | -0.06 | -0.06 | -0.29* |
*、 **分别表示通过90%和95%显著性水平检验 |
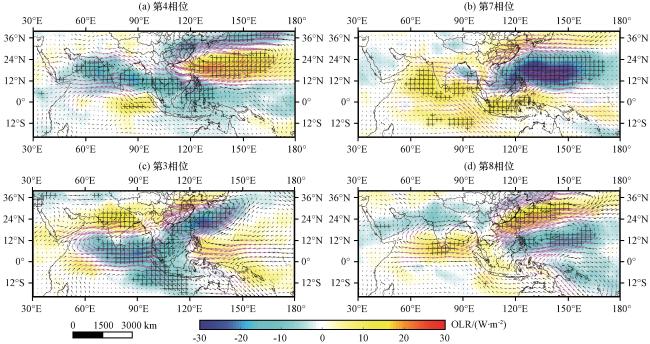
图2 基于BSISO1指数得到的夏季第4相位(a)和第7相位(b)以及基于BSISO2指数得到的夏季第3相位(c)和第8相位(d)的OLR(彩色区, 单位: W·m-2)和850 hPa风场(矢量, 单位: m·s-1)异常标有‘+’的区域和紫色箭头表示通过90%显著性水平检验的区域 Fig.2 The composite of OLR (color area, unit: W·m-2) and 850 hPa wind field (vector, unit: m·s-1) anomalies based on BSISO1 in phase 4 (a) and phase 7 (b), and the anomalies based on BSISO2 in phase 3 (c) and phase 8 (d).The areas marked with ‘+’ and purple vectors represent exceed the 90% confidence level of the Student’s t-test |
4 青藏高原春季积雪影响BSISO的物理机制
4.1 地表感热、 潜热通量
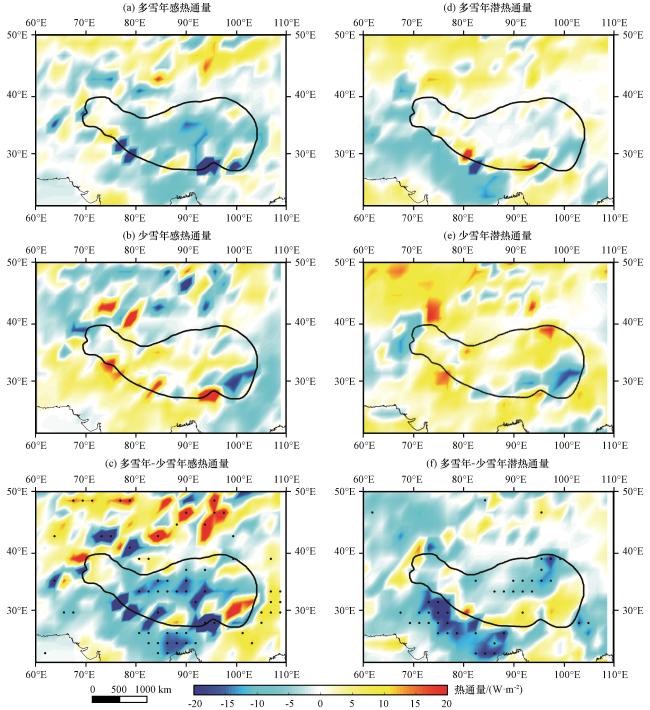
图3 青藏高原春季感热通量(左, 彩色区)和潜热通量(右, 彩色区)在多雪年(a, d)和少雪年(b, e)的异常以及它们的合成差值场(c, f)(单位: W·m-2)标有点号的区域表示通过90%显著性水平检验的区域 Fig.3 The composite sensible heat flux (left, color area) and latent heat (right, color area) anomalies for the excessive (a, d), reduced (b, e) TPSD springs and their differences (c, f).Unit: W·m-2.The area marked with dotter represent exceed the 90% confidence level of Student’s t-test |
4.2 垂直环流
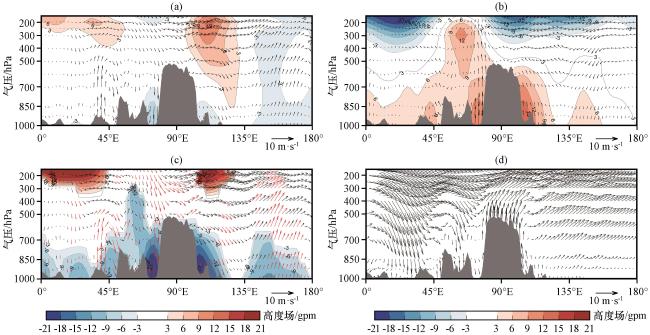
图4 多雪年(a)和少雪年(b)夏季青藏高原(25°N -40°N)平均垂直环流(矢量, 纬向风 单位: m·s-1; 垂直速度 单位: ×10-4 hPa·s-1)异常和位势高度场(彩色区, 单位: gpm)异常合成差值场(c), 以及1981 -2016年夏季平均垂直环流(d, 矢量, 纬向风 单位: m·s-1; 垂直速度 单位: ×10-4 hPa·s-1)灰色部分代表的是高出海平面以上的陆地的垂直剖面; 图(c)中显色区域以及红色箭头表示通过90%显著性检验 Fig.4 Composite zonal vertical circulation [vector, the components of the vector are zonal wind (unit: m·s-1) and vertical velocity (unit: ×10-4 hPa·s-1)] and geopotential height anomalies (color area, unit: gpm) along the Qinghai-Xizang Plateau (averaged over 25°N -40°N) for the excessive (a), reduced (b) TPSD summers and their differences (c), and the climatological vertical circulation [d, vector, the components of the vector are zonal wind (unit: m·s-1) and vertical velocity (unit: ×10-4 hPa·s-1)].The gray area represents the vertical profile of land above sea level.In Fig.4(c), the shading areas and red vectors represent exceed the 90% confidence level of Student’s t-test |
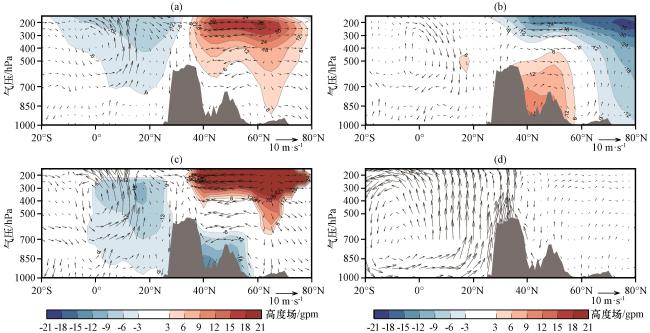
图5 多雪年(a)和少雪年(b)夏季青藏高原(80°E -100°E)平均经圈垂直环流(矢量, 经向风 单位: m·s-1; 垂直速度 单位: ×10-4 hPa·s-1)异常和位势高度场(彩色区, 单位: gpm)异常及合成差值场(c), 以及1981 -2016年夏季平均垂直环流(d, 矢量, 经向风 单位: m·s-1; 垂直速度 单位: ×10-4 hPa·s-1)灰色部分代表的是高出海平面以上的陆地的垂直剖面; 图(c)中显色区域以及红色箭头表示通过90%显著性检验 Fig.5 Composite meridional vertical circulation [vector, the components of the vector are meridional wind (unit: m·s-1) and vertical velocity (unit: ×10-4 hPa·s-1)] and geopotential height anomalies (color area, unit: gpm) along the Qinghai-Xizang Plateau (averaged over 80°N -100°N) for the excessive (a), reduced (b) TPSD summers and their differences (c), and the climatological vertical circulation [d, vector, the components of the vector are meridional wind (unit: m·s-1) and vertical velocity (unit: ×10-4 hPa·s-1)].The gray area represents the vertical profile of land above sea level.In Fig.4(c), the shading areas and red vectors represent exceed the 90% confidence level of Student’s t-test |
4.3 大气热源
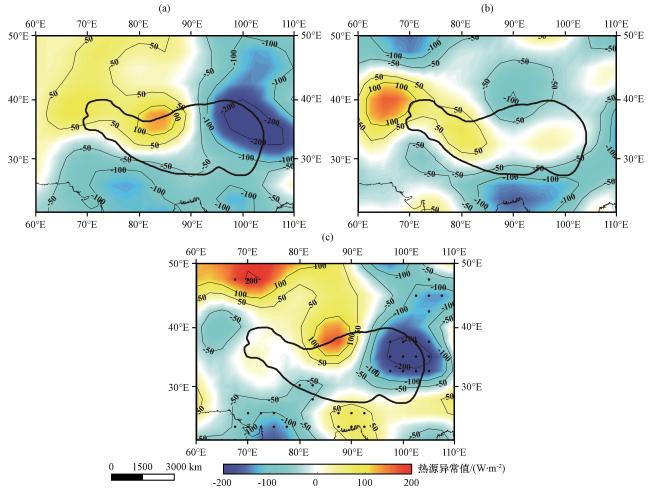
图6 青藏高原多雪年(a)和少雪年(b)夏季600 hPa以上大气热源(彩色区和等值线)异常以及它们的合成差值场(c)(单位: W·m-2)标有圆点的区域表示通过90%显著性检验的区域 Fig.6 The composite atmospheric heat source above 600 hPa (color area and contour) anomalies for the excessive (a), reduced (b) TPSD summers and their differences (c).Unit: W·m-2.The area marked with dotter represent exceed the 90% confidence level based on Student’s t-test |
4.4 200 hPa和850 hPa环流形势
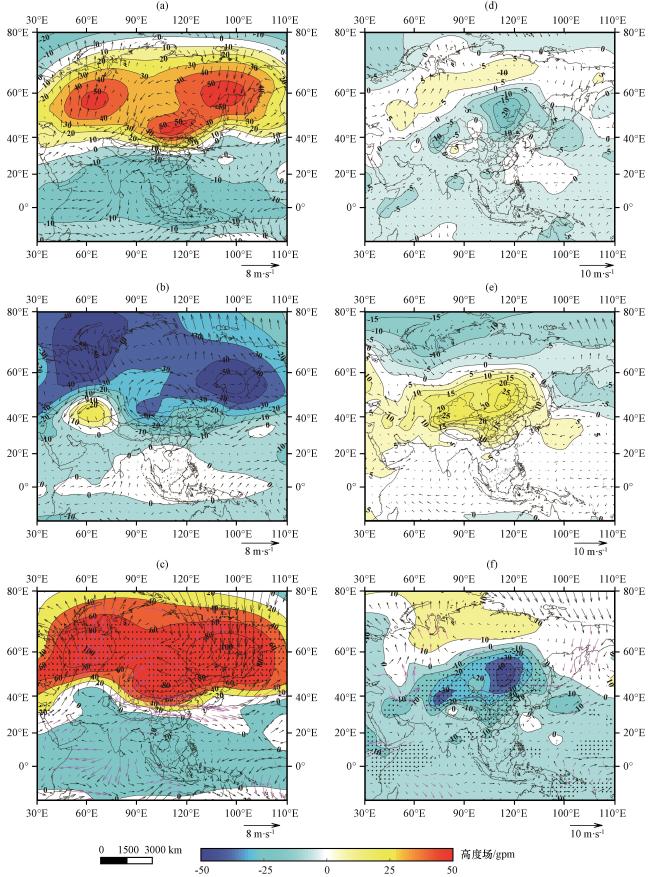
图7 夏季200 hPa和850 hPa的多雪年(a, d), 少雪年(b, e)位势高度场异常(彩色区和等值线, gpm)和风场异常(矢量, m·s-1)以及他们的合成差值场(c, f)(c)和(f)中标点区域和紫色箭头表示通过90%显著性水平检验 Fig.7 Summer geopotential height anomalies (color area and contour, unit: gpm) and wind (vector, unit: m·s-1) anomalies at 200 hPa and 850 hPa for the excessive (a, d), and reduced (b, e) TPSD years and their differences (c, f).In Fig.7(c) and (f), the dotted areas and purple vectors represent exceed the 90% confidence level based on the Student’s t-test |
4.5 对BSISO传播的影响
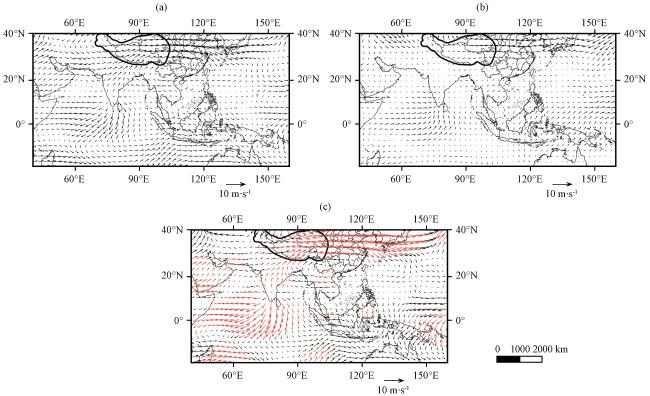
图8 青藏高原多雪年(a)和少雪年(b)夏季垂直风切变(矢量)异常以及它们的合成差值场(c, 矢量)(单位: m·s-1)红色矢量表示通过90%显著性水平检验 Fig.8 The composite vertical wind shear (vector) anomalies for the excessive (a), reduced (b) TPSD summers and their differences (c, vector).Unit: m·s-1.Red vector represents the area exceed 90% confidence level based on the Student’s t-test |
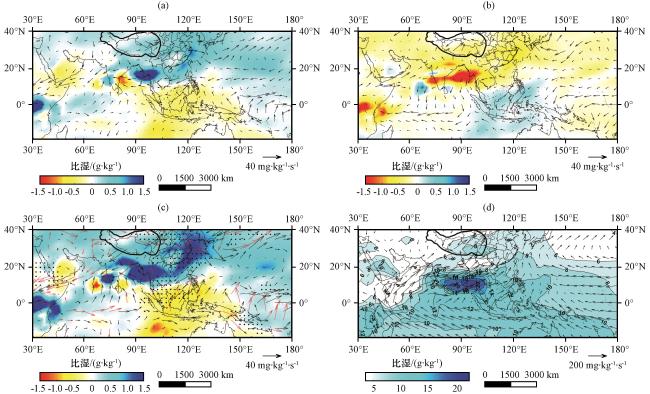


图9 青藏高原多雪年(a)和少雪年(b)夏季1000~600 hPa平均比湿(彩色区, 单位: g·kg-1)和平均水汽通量(矢量, 单位: mg·kg-1·s-1)以及它们的合成差值场(c)和1981 -2016年夏季平均场(d)(c)中标点区域和红色箭头表示通过90%显著性检验 Fig.9 Composite of averaged 1000~600 hPa specific humidity anomalies (color area, unit: g·kg-1), averaged 1000~600 hPa moisture flux (vector, unit: mg·kg-1·s-1) for the excessive (a), reduced (b) TPSD summers and their differences (c), and the summer mean field from 1981 to 2016 (d).In Fig.9(c), the values with black dots and red vectors represent exceed the 90% confidence level based on Student’s t-test |