

1 引言
2 资料来源与方法介绍
2.1 资料及预处理
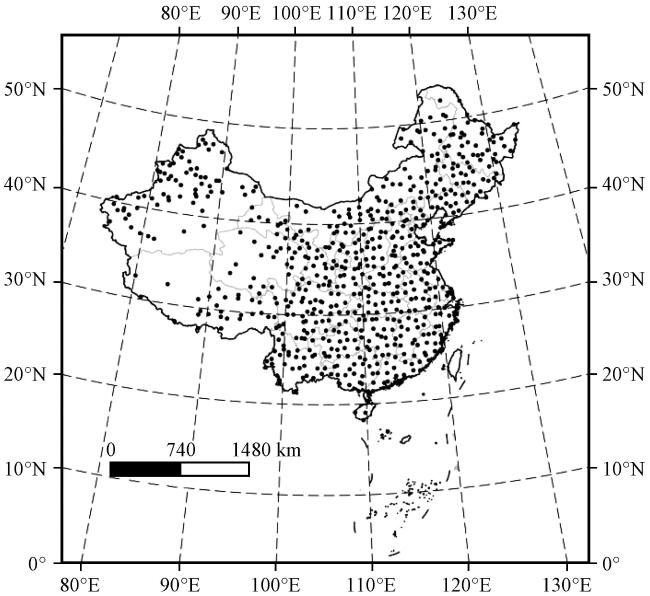
2.2 方法介绍
3 大范围持续性低温事件的分类和低频周期
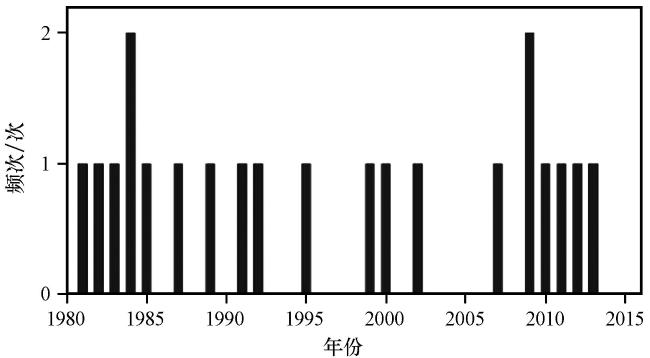
3.1 大范围持续性低温事件的选取
表1 21次大范围持续性低温事件具体信息表Table 1 Information about 21 large-scale persistent low temperature events |
| 年份 | 开始日期 | 结束日期 | 站点峰值日期 | 峰值日站点数 | 站点百分比/% | 持续时间/d |
|---|---|---|---|---|---|---|
| 1981 | 1982-02-06 | 1982-02-14 | 1982-02-10 | 138 | 21.10 | 9 |
| 1982 | 1983-02-03 | 1983-02-18 | 1983-02-10 | 134 | 20.49 | 16 |
| 1983 | 1984-01-19 | 1984-02-10 | 1984-02-06 | 282 | 43.12 | 23 |
| 1984(1) | 1984-12-15 | 1984-12-31 | 1984-12-22 | 422 | 64.53 | 17 |
| 1984(2) | 1985-02-16 | 1985-02-25 | 1985-02-21 | 249 | 38.07 | 10 |
| 1985 | 1985-12-05 | 1985-12-17 | 1985-12-10 | 375 | 57.34 | 13 |
| 1987 | 1987-12-01 | 1987-12-08 | 1987-12-05 | 186 | 28.44 | 8 |
| 1989 | 1990-01-20 | 1990-02-04 | 1990-01-31 | 157 | 24.01 | 16 |
| 1991 | 1991-12-25 | 1992-01-03 | 1991-12-30 | 266 | 40.67 | 10 |
| 1992 | 1993-01-11 | 1993-01-23 | 1993-01-16 | 318 | 48.62 | 13 |
| 1995 | 1996-02-16 | 1996-02-25 | 1996-02-20 | 332 | 50.76 | 10 |
| 1999 | 2000-01-26 | 2000-02-04 | 2000-01-31 | 176 | 26.91 | 10 |
| 2000 | 2001-01-10 | 2001-01-17 | 2001-01-14 | 148 | 22.63 | 8 |
| 2002 | 2002-12-23 | 2003-01-07 | 2002-12-26 | 160 | 24.46 | 16 |
| 2007 | 2008-01-13 | 2008-02-15 | 2008-02-01 | 348 | 53.21 | 34 |
| 2009(1) | 2009-12-30 | 2010-01-06 | 2010-01-04 | 98 | 14.98 | 8 |
| 2009(2) | 2010-02-11 | 2010-02-18 | 2010-02-14 | 232 | 35.47 | 8 |
| 2010 | 2011-01-02 | 2011-01-21 | 2011-01-07 | 221 | 33.79 | 20 |
| 2011 | 2012-01-21 | 2012-02-01 | 2012-01-23 | 113 | 17.28 | 12 |
| 2012 | 2012-12-30 | 2013-01-09 | 2013-01-03 | 133 | 20.34 | 11 |
| 2013 | 2014-02-06 | 2014-02-15 | 2014-02-10 | 262 | 40.06 | 10 |
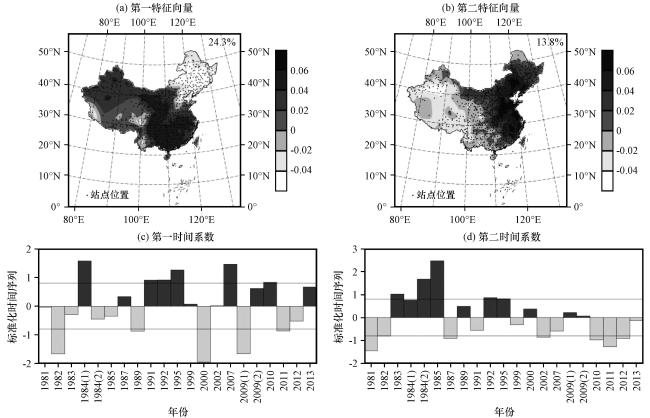
3.2 大范围持续性低温事件的分类
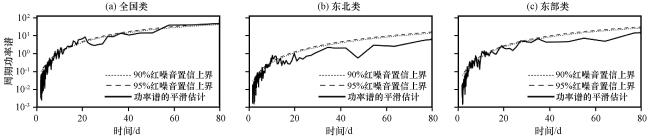
3.3 大范围持续性低温事件的低频周期
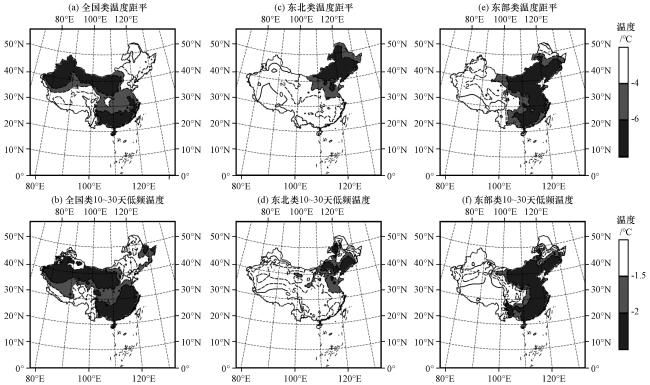
4 三类事件中低频环流场演变特征及差异
4.1 对流层低层环流
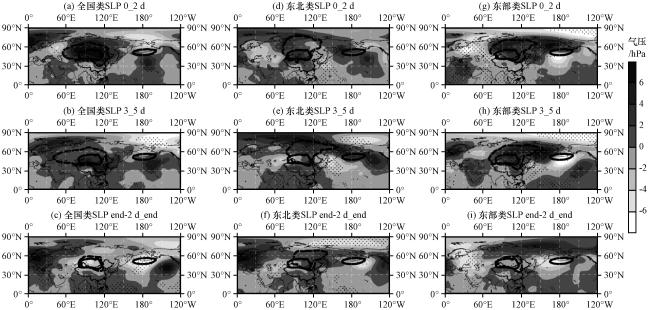
图6 三类事件过程中低频(10~30天)SLP合成场的演变(阴影, 单位: hPa)黑色实线: 1030 hPa气候场特征线和1000 hPa气候场特征线; 黑色虚线: 实况1030 hPa线; 打点区表示通过置信水平90%的显著性检验 Fig.6 The evolution of 10~30 d SLP composite field (the shaded, unit: hPa) in the process of the three types of events.Black solid line: 1030 hPa climate field characteristic line and 1000 hPa climate field characteristic line; black dashed line: actual 1030 hPa line.The dotted areas with 90% confidence level |
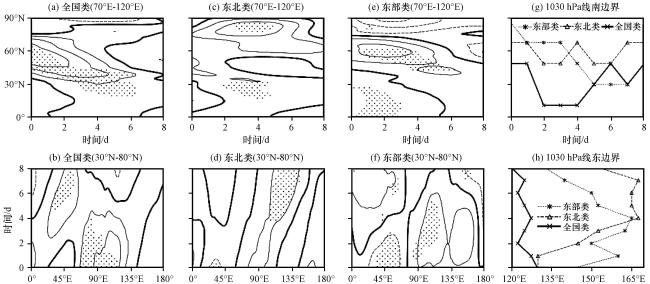
图7 三类事件过程中低频(10~30天)SLP合成场(单位: hPa)沿(70°E -120°E)平均纬度-时间剖面和沿(30°N -80°N)平均时间-经度剖面, 以及1030 hPa气候场特征线的南边界和东边界实线为正; 虚线为负; 粗实线为零线; 打点区表示通过置信水平90%的显著性检验 Fig.7 The 70°E -120°E average latitude-time profile and 30°N -80°N average time-longitude profile of 10~30 d SLP composite field (unit: hPa) in the process of the three types of events and the southern and eastern boundaries of the 1030 hPa climate field characteristic line.The solid lines: positive; dotted lines: negative; thick solid lines: zero; the dotted areas passed the confidence level at 90% |
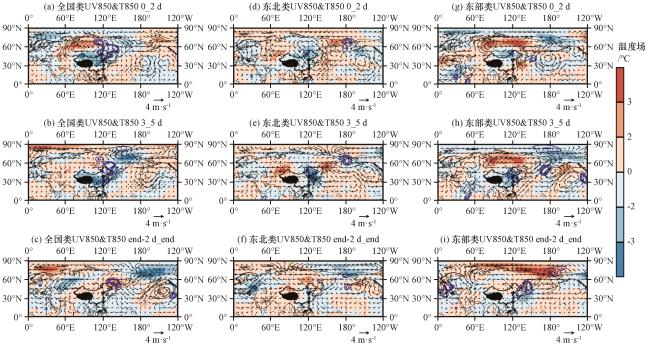
图8 三类事件过程中850 hPa低频(10~30天)风场(矢量, 单位: m·s-1)、 850 hPa低频温度场(阴影, 单位: oC)和北风风速轴(大于6 m·s-1等值线, 单位: m·s-1) 合成场的演变打点区表示温度场通过置信水平90%的显著性检验, A、 C分别表示低频反气旋和气旋 Fig.8 The composite fields of UV850 hPa (vector, unit: m·s-1) and T850 hPa (shaded areas, unit: oC) 10~30 d field and north wind velocity axis (greater than 6 m·s-1, unit: m·s-1) in the process of the three types of events.The dotted areas indicate that the temperature fields pass the significant test at the 90% confidence level.A: low-frequency anticyclone; C: low-frequency cyclone |
4.2 500 hPa位势高度场
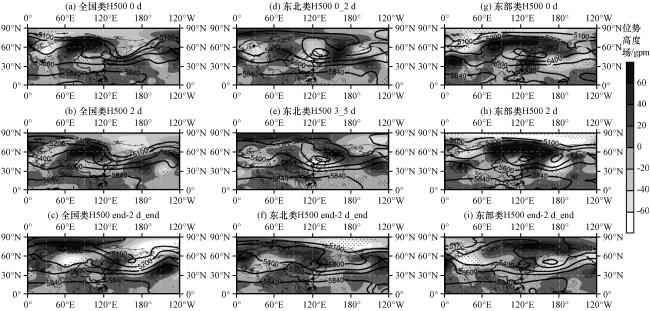
图9 三类事件过程中500 hPa位势高度低频(10~30 d)合成场(阴影, 单位: gpm)、 实况合成场(等值线, 单位: gpm)的演变打点区表示通过90%的显著性检验 Fig.9 The composite fields of H500 hPa 10~30 d field (the shaded, unit: gpm) and unfiltered field (contour, unit: gpm) in the process of the three types of events.The dotted areas passed the confidence level at 90% |
4.3 200 hPa纬向风场
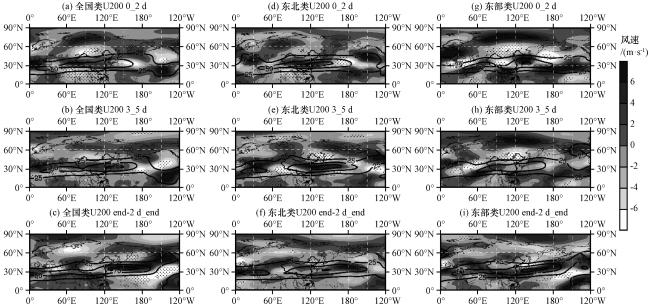
图10 三类事件过程中200 hPa低频(10~30 d)纬向风合成场(阴影, 单位: m·s-1)和实况合成场(大于0 m·s-1等值线, 单位: m·s-1)的演变打点区表示通过90%的显著性检验 Fig.10 The composite fields of U200 hPa 10~30 d field (shaded areas, unit: m·s-1) and unfiltered field (greater than 0 m·s-1 isoline, unit: m·s-1) in the process of the three types of events.The dotted areas passed the confidence level at 90% |
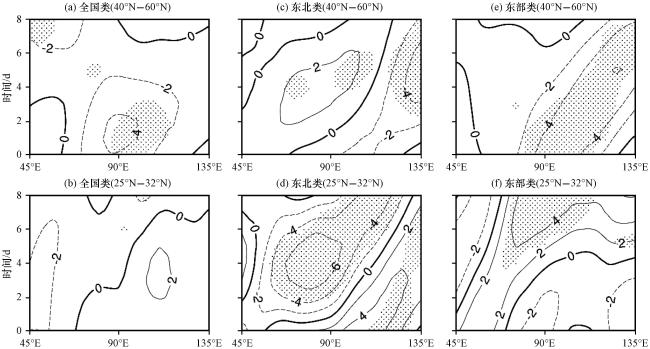
图11 三类事件过程中200 hPa低频(10~30天)纬向风合成场(等值线, 单位: m·s-1)沿40°N -60°N平均的时间-经度剖面和沿(25°N -32°N)平均的时间-经度剖面等值线实线为正; 虚线为负; 粗实线为零线。打点区表示通过90%的显著性检验 Fig.11 The 40°N -60°N average time-longitude profile and (25°N -32°N) average latitude-time profile of 10~30 d SLP composite field in the process of the three types of events (solid lines: positive; dotted lines: negative; thick solid lines: zero; unit: m·s-1).The dotted areas passed the confidence level at 90% |
5 大范围持续性低温事件前期低频环流特征
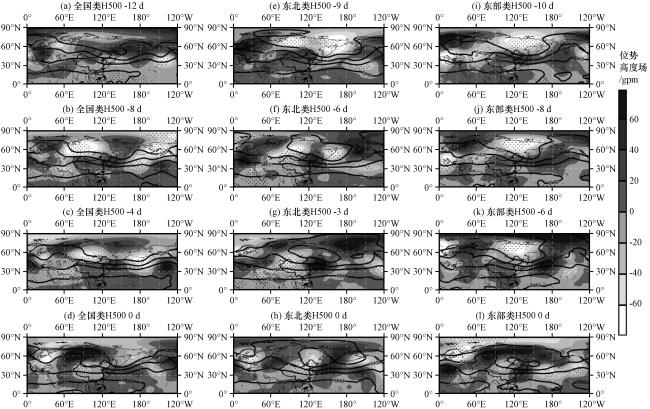
图12 三类事件发生前500 hPa位势高度低频(10~30 d)合成场(阴影, 单位: gpm)、 原始场合成场(等值线, 单位: gpm)的演变打点区表示通过90%的显著性检验 Fig.12 The composite fields of H500 hPa 10~30 d field (shaded areas, unit: gpm) and unfiltered field (contour, unit: gpm) before the occurrence of the three types of events.The dotted areas passed the confidence level at 90% |
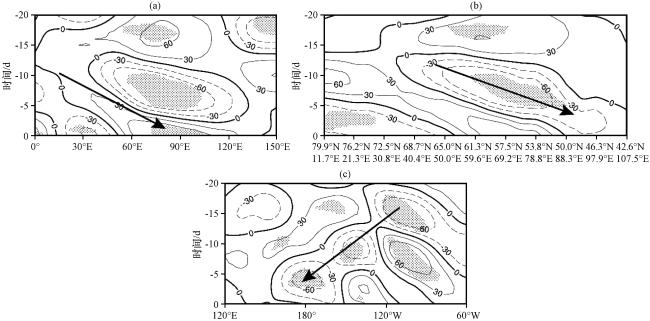


图13 全国类事件发生前500 hPa位势高度低频(10~30天)合成场沿60°N时间-经度剖面图(a)、 沿(65°N, 50°E)-(42.5°N, 107.5°E)斜线时间-经纬度斜剖图(b)和沿45°N时间-经度剖面图(c)(单位: gpm)打点区表示通过90%的显著性检验 Fig.13 The 60°N (a) and 45°N (c) time-longitude profile and (65°N, 50°E)-(42.5°N, 107.5°E) time-longitude and latitude oblique profile (b) of 10~30 d H500 composite field before the occurrence of the nationwide types.Unit: gpm.The dotted areas passed the confidence level at 90% |