

1 引言
2 研究区域、 资料和方法
2.1 研究区域
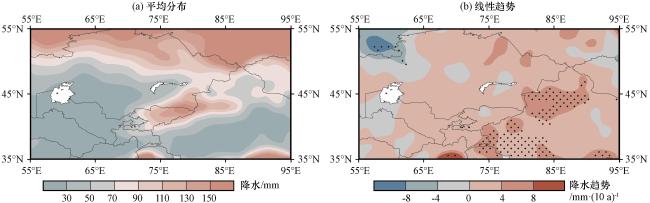
2.2 研究资料和方法
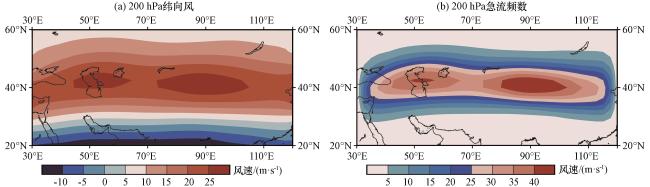
3 结果分析
3.1 中亚副热带西风急流位置变化与中亚夏季降水的关系
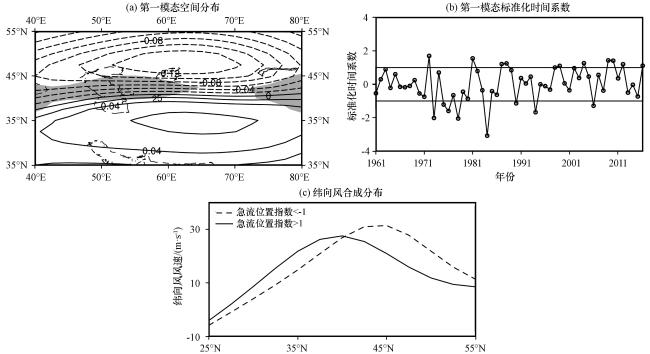
图3 1961 -2016年200 hPa纬向风距平EOF分析的第一模态空间分布(a, 阴影区表示平均风速大于25 m·s-1)及第一模态标准化时间系数(b), 200 hPa纬向风沿40°E -80°E平均在标准化时间系数大于1和小于-1 年份的合成分布(c)Fig.3 The spatial distribution (a) and normalized principal component (b) of the first leading EOF mode of zonal wind anomaly at 200 hPa during 1961 -2016.The distribution of the composite zonal wind at 200 hPa averaged along 40°E -80°E for the years with normalized principal component over 1 positive standard deviation and below -1 negative standard deviation (c) |
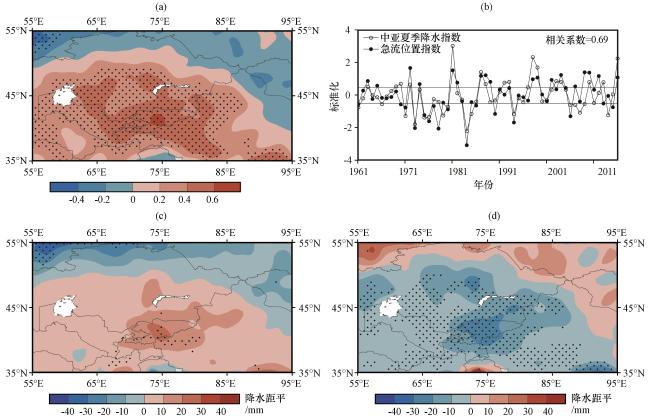
图4 急流位置指数和中亚夏季降水的相关系数分布(a), 中亚降水指数和急流位置指数的年际变化(b), 急流偏南年(c)和偏北年(d)中亚地区夏季降水距平的合成分布(阴影区, 单位: mm)打点区域表示通过95%的信度t检验 Fig.4 The correlation of JPI with summer rainfall over central Asia (a), the interannual variation of CARI and JPI from 1961 to 2016 (b), the composite distribution of summer rainfall anomalies (the shaded, unit: mm) over central Asia in south (c) and north (d) JPI years dotted regions show over 95% significance level of t-test |
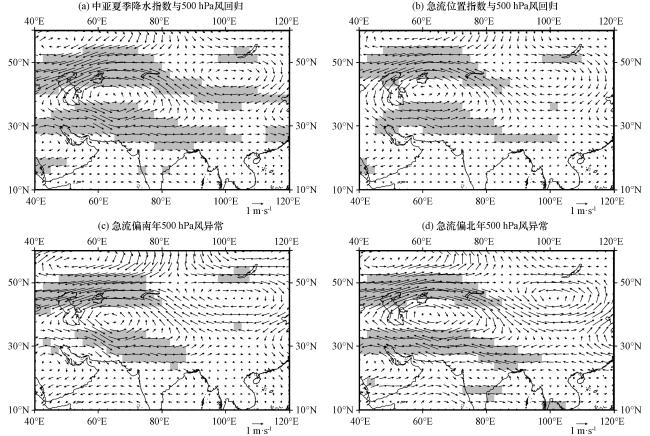
图5 中亚夏季降水指数(a)和急流位置指数(b)与500 hPa风的回归分布, 急流偏南年(c)和偏北年(d)500 hPa风场距平合成分布(矢量, 单位: m·s-1)阴影表示通过95%信度t检验 Fig.5 The regression of 500 hPa wind vector against the CARI (a) and JPI (b), composite distribution of 500 hPa wind anomalies (vector, unit: m·s-1) in south JPI years (c) and north JPI years (d).Regions over 95 % significant level of t-test are shaded |
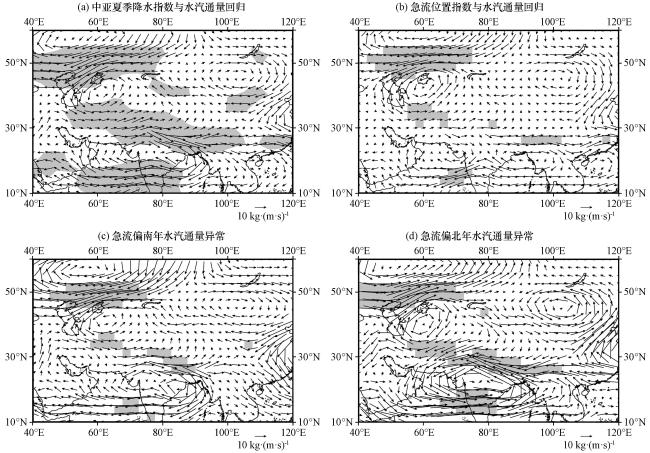
图6 中亚夏季降水指数(a)和急流位置指数(b)与水汽通量(地表积分到300 hPa)的回归分布, 急流偏南年(c)和急流偏北年(d)水汽通量距平的合成分布(矢量, 单位: kg·m-1·s-1)阴影表示通过95%信度t检验 Fig.6 The regression of water vapor flux vertically integrated from surface to 300 hPa against the CARI (a) and the JPI (b), composite distribution(c~d, vector, kg·m-1·s-1) of water vapor flux anomalies in south JPI years (c)and in north JPI years (d).Regions over 95 % significant level of t test are shaded |
3.2 中亚副热带急流位置南北变化的影响因子
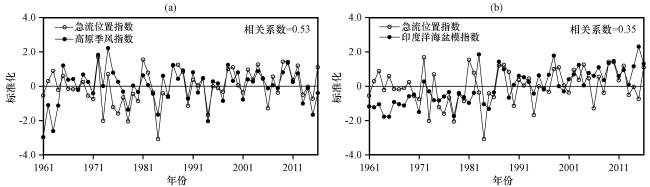
图7 1961 -2016年急流位置指数与高原季风指数(a)以及与印度洋海盆模指数(b)的年际变化Fig.7 The interannual variation of the JPI and PMI (a) and IOBMI (b) from 1961 to 2016 |
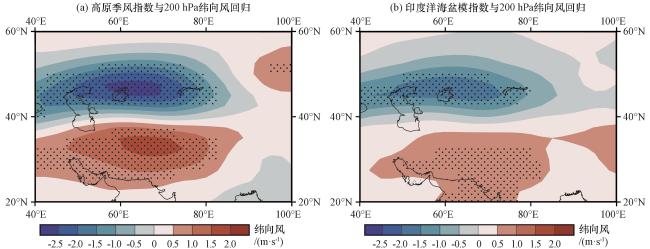
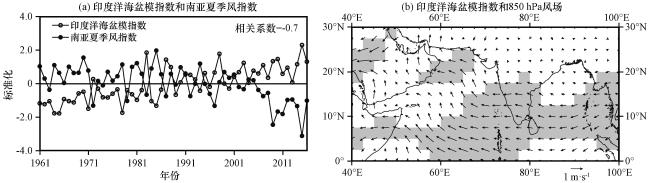
图9 1961 -2016年印度洋海盆模指数和南亚夏季风指数的年际变化(a), 以及与850 hPa风场的回归分布(b, 矢量, 单位: m·s-1)阴影表示通过95%信度t检验 Fig.9 The interannual variation of SASMI (a) and the regression (b, vector, unit: m·s-1) of 850 hPa wind against the IOBMI from1961 to 2016.Regions over 95 % significant level of t-test are shaded |
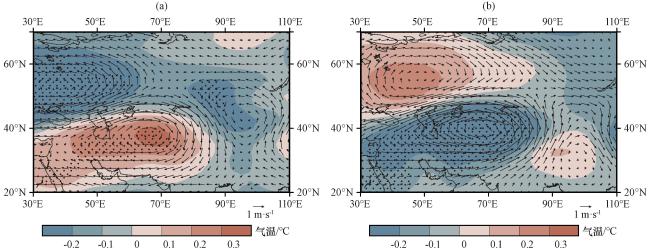


图10 对流层中高层(500~300 hPa)平均气温(彩色区, 单位: ℃)及200 hPa风场(矢量, 单位: m·s-1)与南亚夏季风指数(a)和青藏高原夏季风指数(b)的回归分布打点区域通过95%信度t检验 Fig.10 The regression of the air temperature (color area, unit: ℃) vertically averaged from 500 to 300 hPa and 200 hPa wind (vector, unit: m·s-1) against the SASMI (a) and the PMI (b).Dotted regions show over 95% significance level of t-test |