
1 前言
2 数据来源和方法介绍
3 华西秋雨年际变化特征
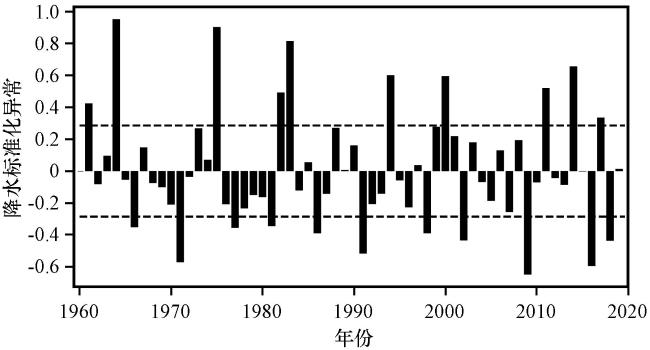
图1 1960 -2019年9 -10月华西地区(25°N -37°N, 100°E -114°E)平均降水量标准化异常年际分量的时间序列虚线表示降水异常正负0.8倍标准差 Fig.1 Time series of the interannual component of the normalized anomaly of averaged precipitation in September and October in West China (25°N -37°N, 100°E -114°E) from 1960 to 2019.The black dotted line denotes the plus or minus 0.8 times standard deviation of the precipitation anomaly |
4 大气环流异常
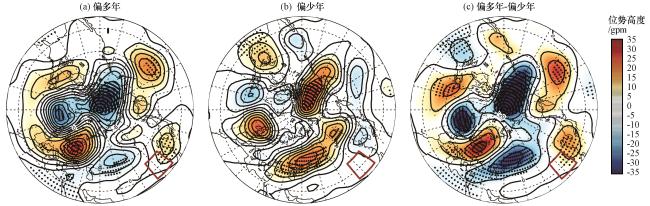
图2 降水偏多年、 偏少年500 hPa位势高度异常合成(a, b)及其差值分布(c)(单位: gpm)打点区为通过0.10显著性水平检验; 方框表示华西地区(25°N -37°N, 100°E -114°E) Fig.2 Composite of geopotential height anomaly at 500 hPa in more precipitation years (a), less precipitation years (b) and their difference distribution (c).Unit: gpm.The dotted area passes 0.10 significance level test, and the box indicates the area of West China (25°N -37°N, 100°E -114°E) |
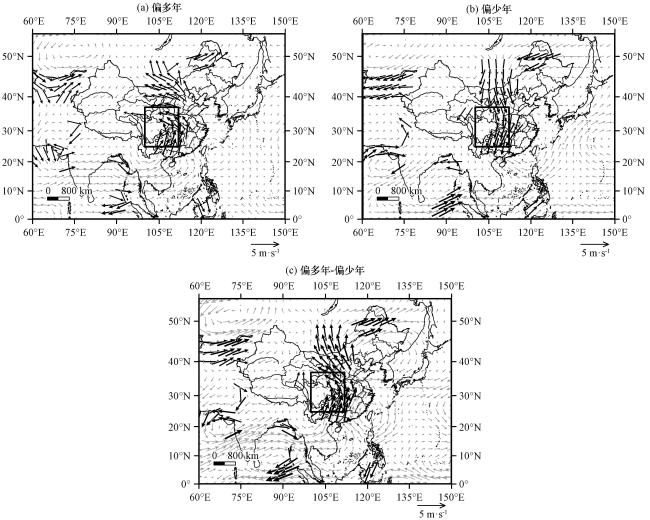
图3 降水偏多年、 偏少年850 hPa风场异常合成(a, b)及其差值分布(c)(单位: m·s-1)加粗的风矢量为通过0.10显著性水平检验; 方框表示华西地区(25°N -37°N, 100°E -114°E) Fig.3 Composite of wind field anomaly at 850 hPa in more precipitation years (a), less precipitation years (b) and their difference distribution (c).Unit: m·s-1.The area with bold wind vector passes 0.10 significance level test, and the box indicates the area of West China (25°N -37°N, 100°E -114°E) |
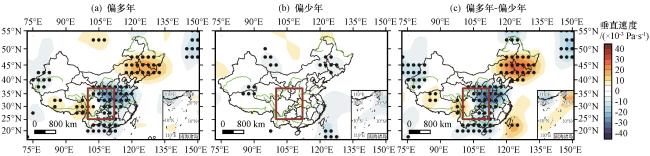
图4 降水偏多年(a)、 偏少年(b)500 hPa Omega异常合成及其差值分布(c)(单位: ×10-3 Pa·s-1)打点区为通过0.10显著性水平检验, 方框表示华西地区(25°N -37°N, 100°E -114°E) Fig.4 Composite of Omega anomaly at 500 hPa in more precipitation years (a), less precipitation years (b) and their difference distribution (c).Unit: ×10-3 Pa·s-1.The dotted area passes 0.10 significance level test, and the box indicates the area of West China (25°N -37°N, 100°E -114°E) |
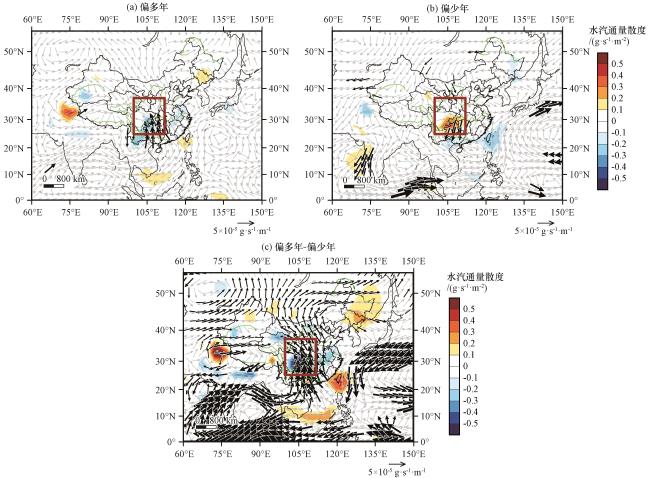
图5 降水偏多年、 偏少年1000~300 hPa积分的水汽通量异常(矢量, 单位: ×10-5 g∙s-1∙m-1)和水汽通量散度异常(彩色区, 单位: g∙s-1∙m-2 )合成(a, b)及其差值分布(c)阴影区表示水汽通量散度异常通过0.10显著性水平检验, 方框表示华西地区(25°N -37°N, 100°E -114°E) Fig.5 Composite of 1000~300 hPa integrated water vapor flux anomalies (vector, unit: ×10-5 g∙s-1∙m-1) and water vapor flux divergence anomalous (color area, unit: g∙s-1∙m-2) in more precipitation years (a), less precipitation years (b) and their difference distribution (c).The shaded areas indicate that the water vapor flux divergence anomaly passes the 0.10 significance level test, and the box indicates the area of West China (25°N -37°N, 100°E -114°E) |
5 热带对流和中高纬系统影响
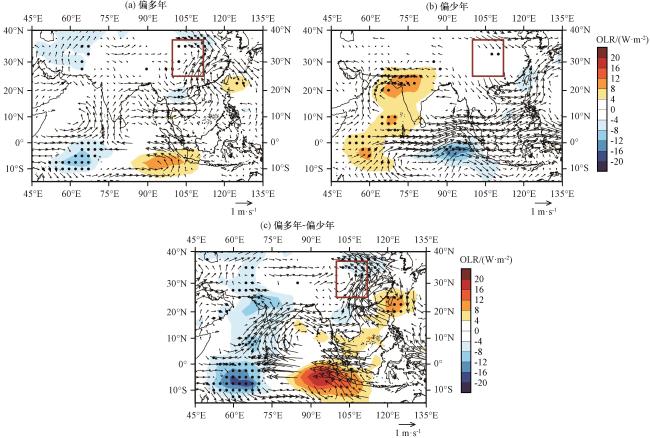
图6 降水偏多年、 偏少年向外长波辐射OLR异常(彩色区, 单位: W·m-2)及850~600 hPa平均风场异常的合成(矢量, 单位: m·s-1)(a, b)及其差值分布(c)打点区为通过0.10显著性水平检验, 方框表示华西地区(25°N -37°N, 100°E -114°E) Fig.6 Composite of OLR anomaly (color area, unit: W·m-2) and 850~600 hPa average wind field anomaly (vector, unit: m·s-1) in more precipitation years (a), less precipitation years (b) and their difference distribution (c).The dotted area passes 0.10 significance level test, and the box indicates the area of West China (25°N -37°N, 100°E -114°E) |
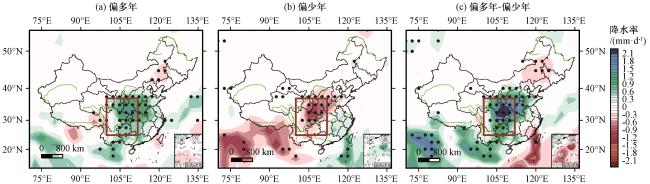
图7 降水偏多年、 偏少年降水率异常合成(a, b)及其差值分布(c)(单位: mm·d-1)打点区为通过0.10显著性水平检验, 方框表示华西地区(25°N -37°N, 100°E -114°E) Fig.7 Composite of precipitation rate anomaly in more precipitation years (a), less precipitation years (b) and their difference distribution (c).Unit: mm·d-1.The area with bold wind vector passes 0.10 significance level test, and the box indicates the area of West China (25°N -37°N, 100°E -114°E) |
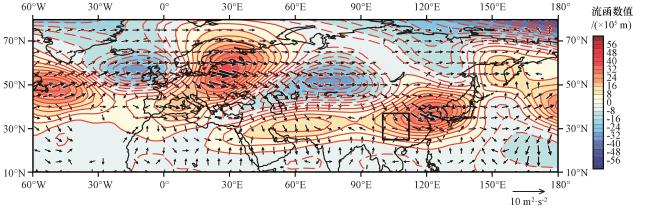
图8 华西地区区域平均降水与300 hPa流函数(彩色区, 单位: ×105 m)和波活动通量(矢量, 单位: m2∙s-2)的回归分布方框表示华西地区(25°N -37°N, 100°E -114°E) Fig.8 Regression distribution of the regional mean precipitation and anomalies of streamflow function (color area, unit: ×105 m) and wave active flux (vector, unit: m2∙s-2) at 300 hPa in West China.The box indicates the area of West China (25°N -37°N, 100°E -114°E) |