
1 引言
四川省地跨青藏高原、 横断山脉、 云贵高原、 秦巴山地、 四川盆地。其北临秦岭, 南接云贵高原, 处于青藏高原东缘, 地势西高东低, 地形、 地貌多样, 天气过程也复杂多变, 而暴雨是四川盆地及周边的主要灾害性天气之一。受复杂地形影响, 该区域不仅年平均降水量大, 且易出现短时强降水。
降水主要分为对流降水和层云降水两种雨型(Houze, 1982)。由于这两类降水形成的热动力和微物理过程不同, 导致这两类降水中粒子的凝结碰并、 融化、 破碎等过程有很大差异(Cifelli and Rutledge, 1998; Houze, 2004)。前人对中国暴雨的研究主要集中于大尺度环流结构、 天气学模型和动力学机制等(陶诗言等, 1958, 2008; 张庆云等, 2008), 较少从降水微物理的角度入手。降水的垂直结构能够反映降水云团内水凝物生长衰减的动力学和微物理特征, 这些微物理和热力学过程影响降水效率, 进而影响地面降水的强度, 并对地面降水类型也起到一定的决定作用(Hobbs, 1989; Zipser and Lutz, 1994; Pruppacher and Klett, 2010; Chang et al, 2015)。而地形对降水和云垂直结构的影响十分重要, 地形通过其热力和动力作用影响大气环流, 从而显著影响降水系统的形成和发展(Wu et al, 2007; Boos and Kuang, 2010; Zhang et al, 2018)。
以往, 由于地面观测资料稀缺, 对山地降水的研究比较困难。同时, 天气雷达在山区的探测也会受到地形的限制(Wen et al, 2016)。GPM(Global Precipitation Measurement)是TRMM的后续卫星降水计划, 是由美国国家航空航天局NASA(National Aeronautics and Space Administration)和日本航空航天与探索局JAXA(Japan Aerospace Exploration Agency)合作发起的全球降雨观测计划。其载有由日本JAXA和NICT(National Institute of Communication Technology)联合设计, NEC东芝航天系统公司建造的全球首个星载双频降水雷达DPR(Dual-frequency Precipitation Radar, DPR), 比TRMM单频PR具有更高灵敏度以及更广覆盖范围, 可提供更精确的降水微观结构信息, 同时精度也比TRMM有所提高( Hou et al, 2014; 刘兆晨等, 2021)。卫星测雨雷达探测不受地理环境的影响, 可以对远海或洋面、 高原或山区这类地基测雨雷达难以布放区域的暴雨云团进行监测, 可有效弥补地基测雨雷达的不足。此外, 暴雨云中大粒子常常位于云体的中下层, 因此卫星测雨雷达自上而下探测, 在暴雨云体的上部雷达波受到的衰减较地基测雨雷达的小, 有利于获得暴雨云体上部的结构信息(傅云飞, 2019)。
本文利用GPM DPR数据产品, 对四川盆地及周边的不同地形下两类(层云和对流性)降水的雷达反射率因子及降水雨滴谱的垂直结构进行统计分析, 期望得出四川山地降水的垂直结构特征, 这将有助于进一步理解山地地形对降水结构和内部微物理过程的影响, 对深化山地强降水机制的科学认知具有重要的意义。
2 研究区域、 资料与方法
GPM的轨道覆盖范围为65°S -65°N, 飞行高度为407 m, 绕地球飞行一周用时约为93 min, 每天绕地球约有16条轨道。GPM主卫星上搭载了全球首部星载双频降水测量雷达(Dual-frequency Precipitation Radar, DPR), DPR工作于13.6G Hz的Ku波段和35.5 GHz的Ka波段, 其星下点水平分辨率约为5 km, 可探测地表至22 km高度的降水三维结构, 其包含两个降水雷达, 分别是Ka波段降水雷达(Ka-band Precipitation Radar, KaPR)和Ku波段降水雷达(Ku-band Precipitation Radar, KuPR)。DPR共分为3种天线扫描方式: KuPR的扫描模式(Normal Scan, NS), KaPR同步KuPR波速的匹配模式(Matched Scan, MS), KaPR的高精度扫描(High-Sensitivity Scan, HS)。Ku_NS扫描宽度为245 m, 星下点垂直分辨率为250 m; Ka_MS扫描宽度为120 m, 垂直分辨率为250 m; Ka_HS扫描宽度为120 m, 垂直分辨率为500 m。
Liao et al(2019)对GPM双频联合反演产品DPR的降雨剖面检索算法进行物理评估, 证明DPR双波长算法通常可以提供准确的降雨率。金晓龙等(2016)评估了卫星降水产品GPM在天山山区的适用性, 结果表明GPM在山区的精度最高, 能够以较准确的精度和较低的误差估测降水系统。卢美圻(2017)使用GPM的DPR资料, 对台风“彩虹”进行降水回波结构分析, 证明了DPR数据质量的可靠性。张奡祺等(2019)通过个例和统计分析揭示, GPM_DPR双频反演产品DPR_MS对强降水和弱降水结构的揭示能力都较强。Lasser et al(2019)将GPM双频降水雷达DPR测量的降水观测数据与地面气象站的降水观测数据进行比对, 表明GPM_DPR的降水观测数据与地面气象站的测量数据基本吻合。Sun et al(2020)在中国的长江-淮河流域将GPM_DPR数据与Parsivel激光雨滴谱仪的测量结果进行比对, 发现其测量结果相似, 平均值偏差相对较小, 偏度值接近零, 证明具有良好的一致性。以上的对比评估工作都表明GPM_DPR观测数据具有很高的可靠性。目前已有学者将GPM卫星资料运用到了相关研究中(赵震, 2019; 魏栋等, 2021)。
本文所用资料为GPM V06A版本的level 2 双频联合反演产品2A.DPR_NS在2014 -2021年5 -9月时间段内的轨道级资料。2A DPR数据可提供详尽的逐轨道降水信息, 包含雷达反射率因子, 雨滴粒子谱(Drop Size Distribution, DSD), 雨顶高(Storm Top Altitude, STA), 冻结层高度(Freezing Height, FzH), 降水率(Rain Rate, rr)等多种变量。
本文研究区域为四川盆地及其周边地区(99°E -109°E, 27°N -33°N)。利用美国地球物理中心(NGDC)发布的ETOPO1高程资料(空间分辨率为1分, 约为1.85 km)。范建容等(2015)研究认为地形起伏度最佳统计单元为9.92 km2, 由于受到ETOPO1资料分辨率的限制, 本文的地形起伏度统计单元定义为13.69 km2。参考相关研究成果(高玄彧, 2004; 钟静和卢涛, 2018; 杨斌, 2009), 将研究区域划分成三类地形(图1 ): (1)平原, 即海拔0~1500 m, 起伏度<100 m; (2)山地, 即海拔500~1500 m, 起伏度≥200 m; (3)高山(川北、 川东)或高原(川西), 即海拔1500~4000 m, 起伏度≥200 m, 这类地形区域下文简称高山。统计分析研究时段内发生在三类地形区域上的降水事件, 得到降水样本频数如表1 所示。
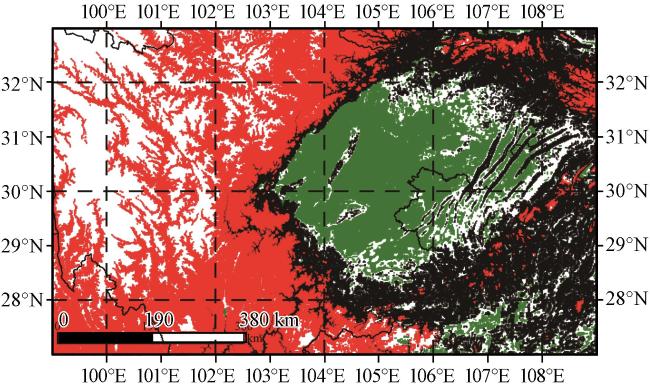
图1 四川盆地及其周边区域(99°E -109°E, 27°N -33°N)的地形分区绿色区域表示平原, 黑色区域表示山地, 红色区域表示高山 Fig.1 Geographical division of Sichuan Basin and its surrounding areas.The green, black and red areas represent the plains, mountains and high mountains, respectively |
表1 2014 -2021年5 -9月GPM DPR探测到的四川盆地及周边不同地形的降水样本数Table 1 Number of rainy pixels detected by GPM DPR over different terrains of Sichuan Basin and its surrounding from May to September of 2014 -2021 |
| 降水率分级 /(mm·h-1) | 平原 | 山地 | 高山 |
|---|---|---|---|
| 0.5≤rr<2 | 2186(32530) | 4616(72504) | 6646(65973) |
| 2≤rr<4 | 2031(10851) | 4146(25204) | 3885(14688) |
| 4≤rr<8 | 1985(5301) | 4263(12772) | 3481(5545) |
| 8≤rr<20 | 1685(1674) | 3530(3813) | 2126(1121) |
| rr≥20 | 981(247) | 1579(483) | 495(85) |
括号外表示对流性降水的样本数, 括号内表示层云性降水的样本数, rr为降水率 |
等高频率分布(Contoured Frequency by Altitude Diagram, CFAD)图能够很有效地揭示降水的垂直结构, 并已在许多研究中得到应用(Yuter and Houze, 1995; Zhang et al, 2020)。CFAD内各频率除以分析区域内最大绝对频率就是归一化等高频率分布(Normalized Contoured Frequency by Altitude Diagram, NCFAD), 从而能将各绝对频率不同的CFAD放在一起进行比较(Houze et al, 2007)。本文利用NCFAD统计分析四川地区的平原、 山地和高山背景下层云和对流性强降水的垂直结构特征。其中, 强降水定义为1 h降水量大于20 mm的降水过程(陈贝, 2016)。考虑到GPM探测的敏感性, 降水率(rr)<0.5 mm·h-1的降水不纳入统计。同时结合王曙东等(2017)对降水等级的划分标准, 本文将地面雨强等级依次划分为0.5 mm·h-1≤rr<2 mm·h-1, 2 mm·h-1≤rr<4 mm·h-1, 4 mm·h-1≤rr<8 mm·h-1, 8 mm·h-1≤rr<20 mm·h-1, rr≥20 mm·h-1等5级进行讨论。GPM DPR资料中由于浅雨被归档为对流性降水类型, 在本研究中将其从对流性降水类型中剔除。本研究仅考虑地面降水粒子相态为液态的降水事件。
3 结果分析
3.1 雷达反射率因子的垂直分布
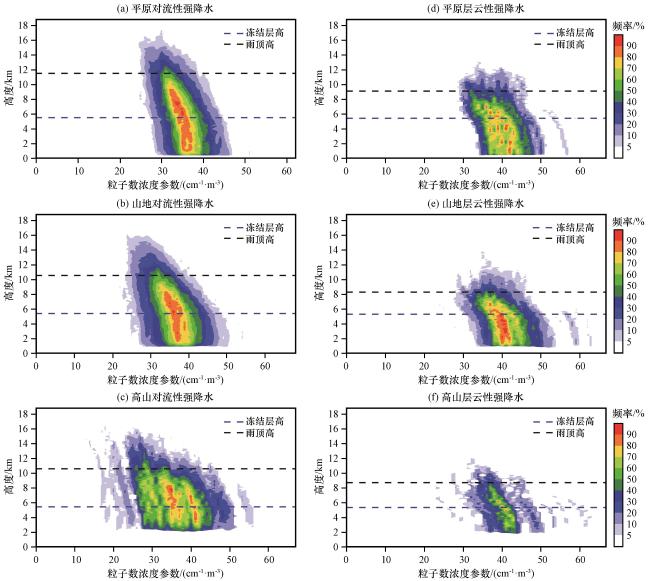
为了解四川盆地及周边的平原、 山地以及高山两类(层云和对流性)降水云的垂直结构, 使用雷达反射率因子的NCFAD以及反射率因子最大频率廓线揭示降水云宏观分布和云内粒子群生长存留状况(图2 )。从图2 中可见, 在同类地形下, 对流性强降水的反射率因子在近地表的值总是大于层云性强降水的, 说明对流云通常更易造成强度更大的降水事件。两类强降水的冻结层高度几乎不受地形影响, 因此地表至冻结层间的气层高度随着地势升高而减小。在相同的地形下, 对流性强降水的雨顶高度和云顶高度总是高于层云性强降水, 说明对流云在垂直方向上的发展比层云更加旺盛。两类强降水中, 地表至云顶以及地表至雨顶的气层高度随着地势升高而减小。在对流性强降水中[图2 (a)~(c)], 平原的反射率因子中心主要位于0.5~2.5 km高度; 而由于山地地形抬升作用, 使得山地的反射率因子中心主要位于1.1~4 km; 高山的地形抬升作用更为明显, 反射率因子中心主要位于3.5~5.5 km。
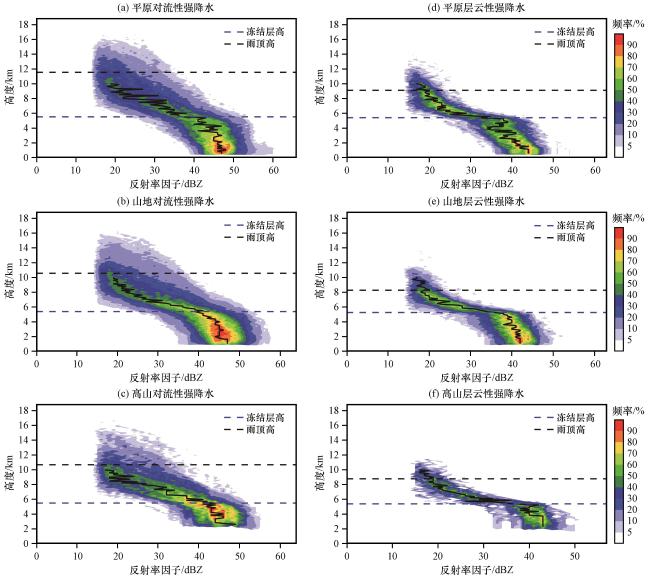
图2 不同地形下两类强降水的反射率因子垂直结构彩色区为反射率因子出现的频率; 黑色实线表示反射率因子最大频率廓线 Fig.2 Normalized contoured frequency by altitude diagrams (NCFAD) of reflectivity factor of two types heavy precipitation over different topographic.The color area and black solid line indicate occurrence frequency and maximum frequency profile of reflectivity factor, respectively |
雷达反射率因子的最大频率廓线除了可揭示降水的垂直结构外, 还能很好地反映其微观物理过程(Cao et al, 2013)。层云性降水通常在冻结层附近有明显的亮带特征, 而亮带能很好地指示出水凝物的相态变化(Sánchez-Diezma et al, 2000)。位于亮带以上的水凝物的相态主要为冰和雪, 亮带以下则主要为液体, 而在亮带内, 则存在着包含融化的冰雪以及雨滴在内的混合相态水凝物。从图2 中的反射率因子最大频率廓线可见, 在6~10 km伴随着高度的降低, 不同地形下两类强降水的反射率因子均随之增大, 降水粒子在下落过程中得到增长。不同于对流性强降水, 层云性强降水中反射率因子在冻结层附近增长速率非常大, 其廓线趋于水平[图2 (d)~(f)], 说明降水粒子在冻结层附近发生了从冰相到液态的迅速转变。从冻结层至地表的低层大气的含水量、 温度变化使得低层反射率因子廓线存在波动, 但总体呈增加趋势, 说明降水粒子从冻结层落至地面的过程中, 碰并作用要强于蒸发作用。
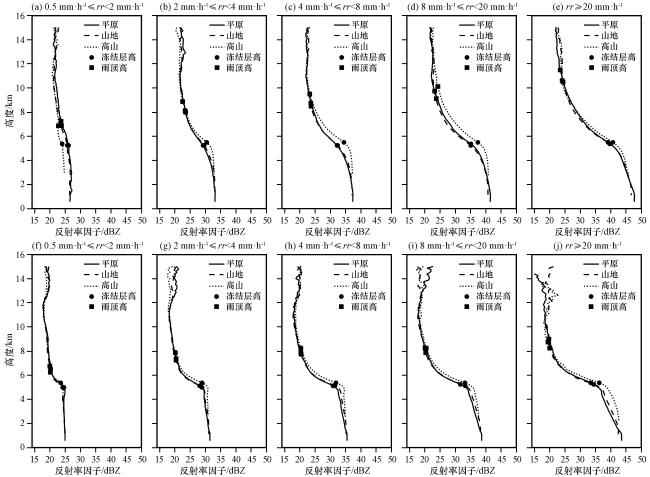
从不同地面雨强等级的雷达反射率因子廓线(图3 )中可以看到, 两类降水的反射率因子从降水雨顶到地面基本呈增长趋势, 近地表反射率因子随着地面雨强的增大而增大。同时, 从图3 (f)~(j)中也能明显看到层云性雷达反射率因子在5 km左右呈现出的亮带特性, 且廓线在冻结层附近出现明显的弯折, 这是层云性降水粒子在下降过程中的微物理特性所决定的, 而对流性降水的反射率因子廓线无该特征。相较于其他雨强等级的降水, 平原对流性弱降水[图3 (a)]的降水粒子在冻结层高度以下的下落过程中受蒸发、 上升气流等影响最为明显, 出现了波动并在近地层呈减小趋势。
3.2 降水粒子 的垂直分布
雨滴粒子谱(DSD)是降水的一个基本属性, 对于理解降水系统内部发生的微物理过程至关重要。DSD包含粒子质量加权平均直径(mass-weighted diameter, )和广义截距参数(normalized DSD intercepts, )两个参数, 其中 定义为雨水含量和雨滴大小一定时的雨滴数浓度。dB 与 的关系是: dB w=10lg( ), 为简化, 后文将dB w统称为粒子数浓度数。从不同地形下两类强降水的 垂直结构(图4 )可见, 对于两种类型的降水而言, 小直径降水粒子( ≤1.2 mm)均主要集中在雨顶高度和冻结层之间, 此高度层内的降水粒子主要是以冰晶的形态存在。随着地势抬升, 分布域增大而谱高度降低。同类地形下, 层云性强降水 分布域宽度和谱高度均要小于对流性强降水, 且 分布域中直径最大值也皆小于对流性强降水。
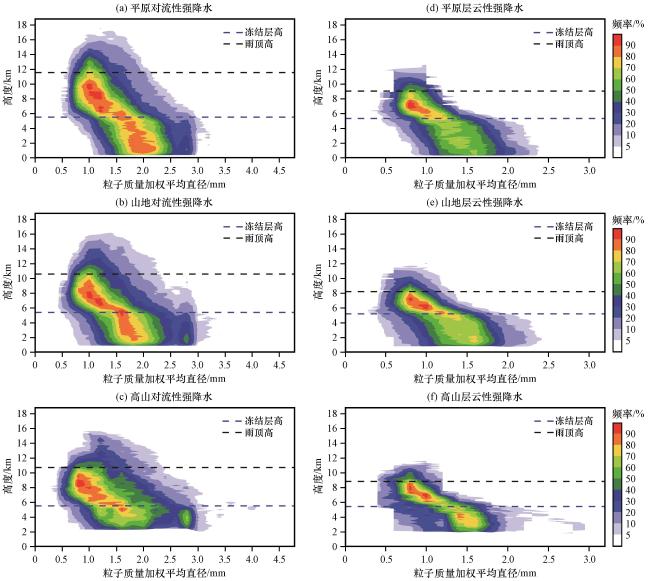
冻结层高度几乎不随地势变化, 意味着从冻结层至地表的气层高度是随着地形升高而减小的, 降水粒子的碰并路径就会随之缩短。从图4 (a)~(c)可见, 对流性强降水中大雨滴( ≥2.6 mm)出现的概率是随着地势升高而增加。推测是由于山地地形的抬升作用, 强上升气流更易形成, 上升气流更能托起下落雨滴, 使其下落速度变慢, 同时还会将一部分小雨滴抬升至高空与下落的雨滴进行碰并, 使得降水粒子的碰并效率增加; 强上升气流还能挟带充足的水汽进入云体, 云体内水汽含量增加也有利于雨滴粒径增大。Yan et al (2018)在对青藏高原的云宏观和微观垂直结构中也提出, 垂直上升运动加强, 也会使冻结层上方的雪和霰粒子迅速增长, 从而更易生成大雨滴。强湍流有利于雨滴碰并聚合成大雨滴的同时, 也更易使降水粒子破碎形成小雨滴, 图4 (a)~(c)中高山和山地的 分布域宽于平原地区能很好地印证这一现象。
与雷达反射率关系密切, 在冻结层以下, 对流性强降水粒子的 高频区分布范围与雷达反射率高频区的分布区间高度吻合。对比图4 (a)~(c)观察不同地形下对流性强降水粒子的 分布情况, 地面至4 km的气层中, 平原 主要集中在1.7~2.2 mm, 山地 主要集中在1.6~2.0 mm, 而其在高山的分布较散, 主要集中在1.4~2.0 mm和2.7~2.9 mm。可见, 随着地势抬升, 地面至4 km气层中 的主要集中区的分布范围越来越广。对于层云性强降水[图4 (d)~(f)]能明显看出, 山地和高山冻结层高度以下 在1.4~1.6 mm的降水粒子出现的概率比平原高, 且海拔越高其出现概率越大。
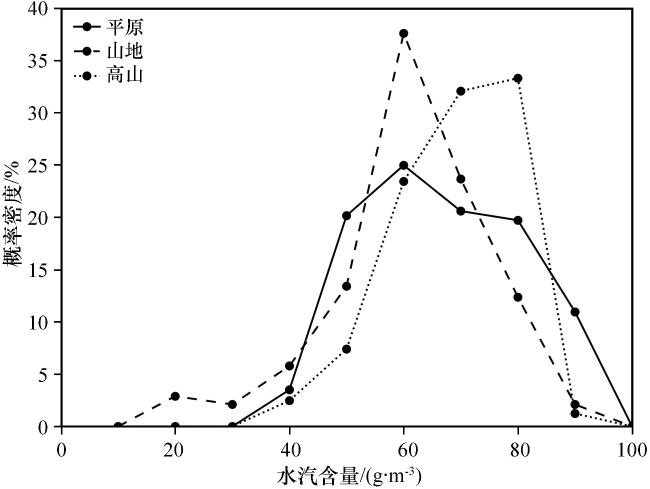
从不同地形下层云性强降水冻结层附近高度层内(4.5~6.5 km)水汽含量PDF分布(图5 )可以看出, 高山在冻结层附近的水汽要比平原和山地更加丰富。高山下垫面距离冻结层更近, 更有利于水汽垂直输送至冻结层, 使冻结层上方的雪和霰粒子迅速增长, 从而更易生成粒径偏大的雨滴。丰富的水汽使高山 在1.2~1.4 mm的降水粒子出现概率比平原小了许多, 使降水粒子更倾向集中于1.4~1.6 mm的更大粒径区间。
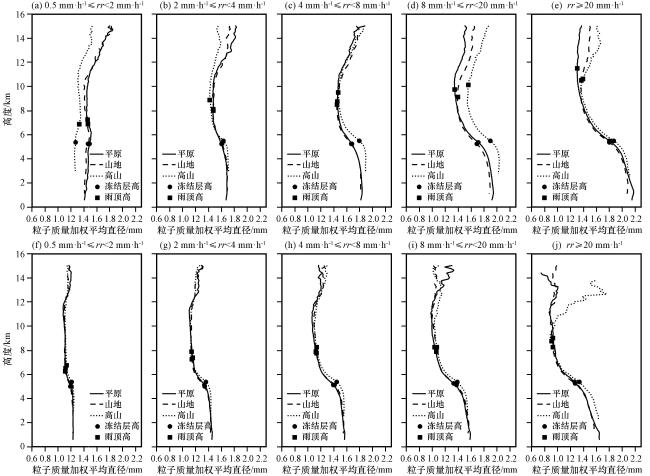
从不同地面雨强等级的 廓线(图6 )可以看出, 在地形和雨强等级相同的情况下, 对流性降水在近地层的值总是大于层云性降水。从图6 (a)中可以看到, 对流性弱降水(0.5≤rr<2 mm·h-1)的 廓线与其他雨强等级的 廓线有明显区别: 平原和山地的 廓线在雨顶高度和冻结层之间随着高度降低呈现先增后减的趋势, 从冻结层至近地层的气层中 廓线总体呈随高度降低而减小的趋势, 这是因为发生弱降水时, 平原和山地上空低层大气较干, 小雨滴易被蒸发或直径减小; 而高山的 廓线在雨顶高度和冻结层之间总是随着高度降低而减小, 并在冻结层附近略微增大, 之后随高度降低呈现先减后增的趋势。除此之外两类降水的 廓线在雨顶高度至冻结层高度间均随高度降低而增大。图6 (j)中, 在12~14 km高度范围内, 高山的 值明显比平原和山地的大得多, 这与其他雨强等级的层云性降水 廓线有着明显不同。10 km以上的高空中, 高山对流性和层云性强降水的 值皆高于平原和山地[图6 (e), (j)], 且在层云性强降水中尤为明显, 这可能与高山10 km以上云内丰富的水冰有关, 根据Yan et al (2018)的研究发现, 随着降水量的增加, 高山10 km以上的云冰水含量显著增加。
3.3 降水粒子 的垂直分布
对比同一地形下层云和对流性强降水的 (图7 )可知, 平原和山地层云性强降水的 分布域虽然宽于对流性强降水但其高频区的分布范围却不如对流性强降水集中; 而高山层云性强降水的 分布域明显比对流性强降水窄, 同时高频区更加集中。不同地形下对流性强降水的 垂直结构也有明显不同[图7 (a)~(c)]: 随着地势升高, 的分布域也随之变宽。平原的 高频区最为集中, 冻结层高度以下 的高频区在34~38。山地和高山的 高频区的分布较平原地区更为分散, 尤其在高山表现得更为明显。而层云性强降水的情形正好相反[图7 (d)~(f)], 山地和高山的 高频区的分布相比于平原地区更为集中。
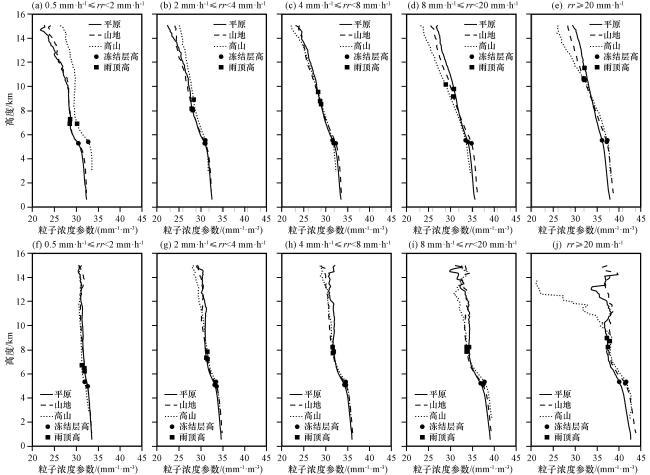
从不同地面雨强等级下的 廓线分布情况(图8 )可以看出, 随高度降低 廓线总体呈增大的趋势。相较于对流性强降水, 层云性强降水的 廓线在雨顶高度和冻结层间的弯曲程度更为明显。对于强降水的 廓线而言[图8 (e), (j)], 高山10 km以上的气层所对应的 明显要比平原地区小。结合强降水的 廓线[图6 (e), (j)]可以看出, 相较于平原地区, 高山的降水粒子在10 km以上呈现数浓度较低、 尺度较大的特征。
一般而言, 大直径的降水粒子对应着强雷达反射率。而从图6 (e)和(j)可见, 对流性强降水在近地面的 值是明显大于层云性强降水的, 但其与层云性强降水的在近地面的雷达反射率却相差不大[图3 (e), (j)], 这是因为对流性强降水在近地面的 比层云性强降水的 要小许多[图8 (e), (j)]。由此可见, 雷达反射率、 和 三者之间的关联十分密切。
4 结论
基于ETOPO1高程资料将四川盆地及其周边区域分为平原、 山地和高山三类地形, 利用2014 -2021年5 -9月的GPM DPR资料分析了发生在这三类地形上对流和层云性降水事件的雷达反射率因子以及降水粒子的垂直结构特征, 得到以下主要结论:
(1) 不同于对流性降水, 层云性雷达反射率因子廓线在冻结层附近出现明显弯折。相较于其他雨强等级的降水, 平原对流性弱降水的降水粒子在近地面受蒸发, 湿度等因素影响最为明显, 其反射率因子在近地层波动较大且呈减弱趋势。对流性强降水中, 随着地势抬升, 雷达反射率因子中心高度也随之升高。
(2) 分析降水粒子的 垂直结构可得: 同类地形下对流性强降水的 分布域宽度、 谱高度、 分布域中直径最大值都要大于层云性强降水。随着地势升高, 两类强降水类型的 分布域都随之增大但谱高度降低。在对流性强降水中, 随着地势升高, 大雨滴( ≥2.6 mm)出现的概率增加, 地面至4 km的气层中 主要集中区的分布范围变广, 这可能与地形作用引起的强上升气流有关。对于层云性强降水, 高山冻结层高度以下中等直径的降水粒子(1.4 mm≤ ≤1.65 mm)出现的概率比平原高, 可能是由于高山下垫面距离冻结层更近, 更有利于水汽垂直输送至冻结层, 使冻结层上方的雪和霰粒子迅速增长, 从而更易生成粒径偏大的雨滴。地面雨强等级为强降水时, 在10 km以上的高空, 山地和高山的 均大于平原, 且地势越高其值越大。
(3) 分析降水粒子的 垂直结构可知: 两类降水的 廓线总体均随高度降低而增大。对于对流性强降水, 平原的 高频区的分布较山地和高山更为集中, 而层云性强降水的情形正好相反。在10 km以上的高空, 高山强降水的 明显比平原小, 降水粒子呈现数浓度较低、 尺度较大的特征, 可能与10 km以上的云内丰富的水冰有关。
(4) 雷达反射率、 和 三者之间关联密切。冻结层以下, 对流性强降水粒子的 高频区分布范围与雷达反射率高频区的分布区间高度吻合。对流性强降水的降水粒子在近地面的 比层云性强降水的大, 但其 却比层云性强降水的小, 从而显示出两类强降水在近地面雷达反射率的差异并不大。
本文利用GPM双频降水雷达对发生在平原、 山地和高山三类地形上的强降水事件进行了分析和讨论, 初步揭示了不同地形下强降水垂直结构特征, 对于认识地形对强降水的影响具有重要参考意义。但本文目前只讨论了雷达反射率因子、 降水粒子DSD信息、 雨顶高度和冻结层高度等物理量, 下一步工作将尝试加入更多物理量, 并努力将卫星遥感的降水产品与地形强降水机理的研究相联系, 以期更好地推进地形强降水的科学认识和业务应用。