

1 引言
2 龙卷个例介绍及其发生的环境条件
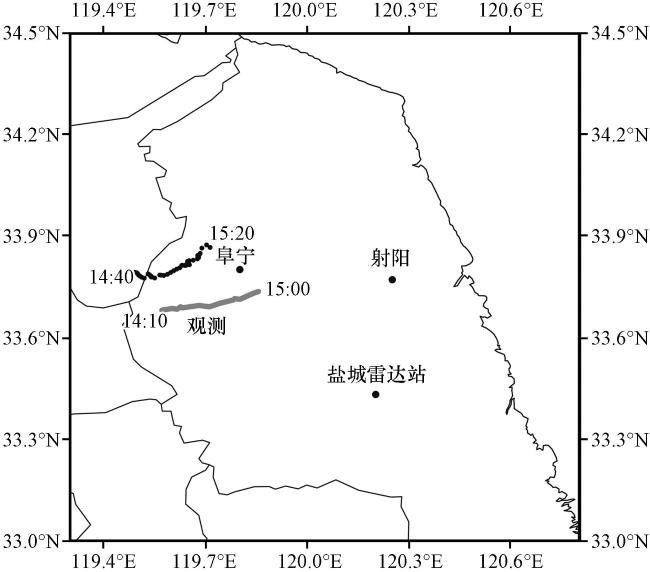
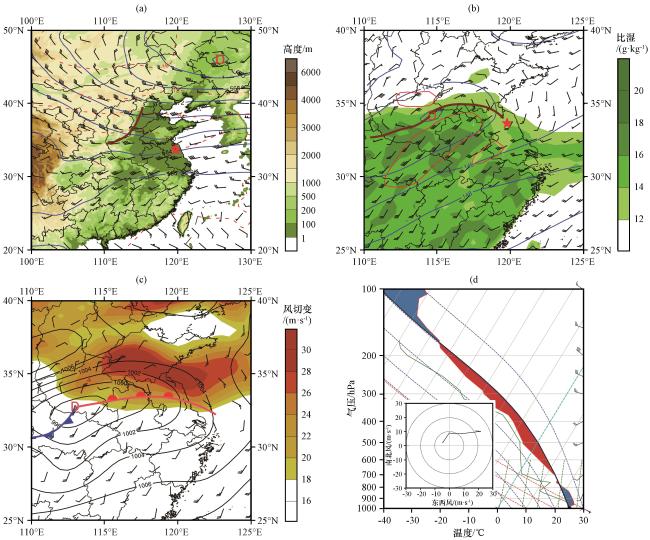
图2 2016年6月23日14:00 500 hPa位势高度(蓝线, 单位: dagpm)、 温度(红色虚线, 单位: ℃)、 风(风羽, 风羽杆长划代表4 m·s-1)和地形高度(彩色区, 单位: m)分布(a), 850 hPa位势高度(蓝线, 单位: dagpm)、 比湿(彩色区, 单位: g·kg-1)、 风(风羽, 单位: m·s-1)和风速≥12 m·s-1的急流区(红线)(b), 海平面气压(黑线, 单位: hPa)、 风(风羽, 单位: m·s-1)、 0~6 km垂直风切变(彩色区, 单位: m·s-1)和地面锋分布(c)以及射阳站风矢端图和 图(d)(a)和(b)中的红色五角星代表阜宁龙卷位置, 棕色线分别为500 hPa槽线和850 hPa切变线 Fig.2 The distribution of geopotential heights (blue line, unit: dagpm), temperature (red dashed line, unit: ℃), wind barbs (barb, a barb is 4 m·s-1) at 500 hPa and terrain height (color area, unit: m) (a), geopotential heights (blue line, unit: dagpm), specific humidity (color area, unit: g·kg-1), wind barbs (barb, unit: m·s-1) and jet of wind speed ≥12 m·s-1 (red line) at 850 hPa (b), sea level pressure (black lines, hPa), surface wind barbs (barb, unit: m·s-1), 0~6 km bulk wind difference (color area, unit: m·s-1) and fronts at surface (c). and hodograph (inset in the lower-left corner) of the Sheyang radiosonde (the location in Fig.1) (d) at 14:00 on 23 June 2016.In Fig.2(a) and (b), the location of the Funing tornado is denoted by a red star respectively.The thick brown line in Fig.2(a) denotes 500 hPa trough and in Fig.2(b) denotes 850 hPa shear line |
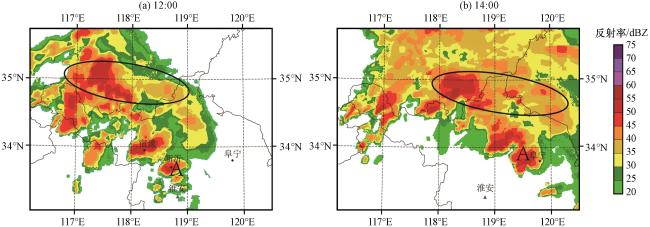
图3 2016年6月23日12:00(a)和14:00(b)观测的1 km高度雷达反射率(彩色区, 单位: dBZ)椭圆所在区域为暖锋云带; 黑点表示宿豫、 新沂、 阜宁和淮安的位置; A为龙卷风暴 Fig.3 The observed radar reflectivity (color area, unit: dBZ) on 1 km AGL at 12:00 (a) and 14:00 (b) on 23 June 2016.The ellipse denotes cloud systems of the warm front.The dots mark the locations of Suyu, Xinyi, Funing and Huaian.The letter A represents tornadic thunderstorm |
3 模拟试验方案设计
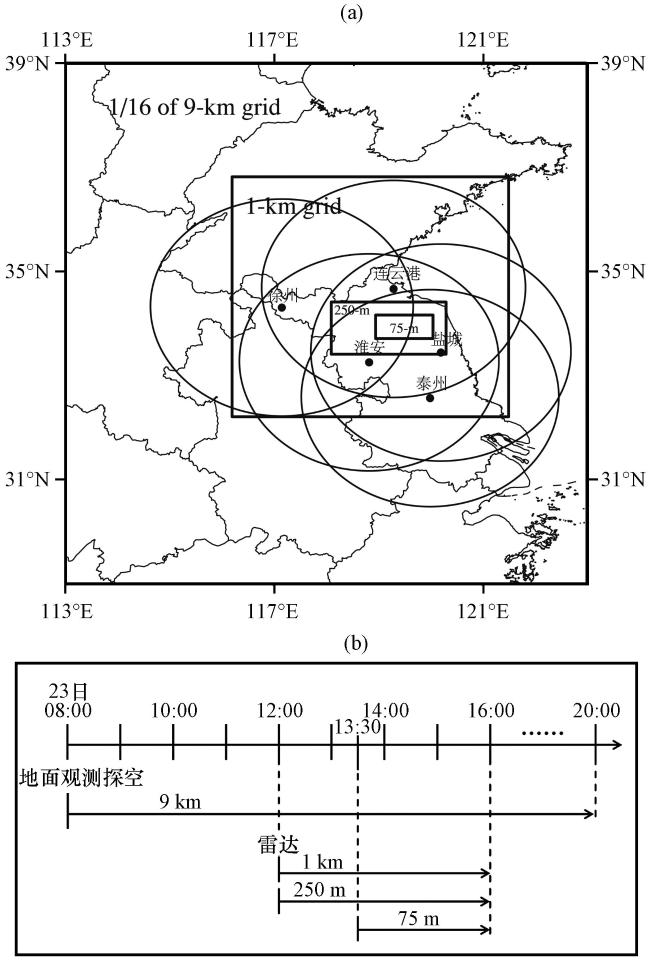
图4 四重嵌套(9 km、 1 km、 250 m和75 m)网格区域和5部多普勒雷达(徐州、 连云港、 淮安、 泰州和盐城)位置(a)及四层嵌套的分析和预报时间轴(b)(a)中圆圈表示雷达230 km的探测范围 Fig.4 The nested domains of 9 km, 1 km, 250 m, and 75 m horizontal grid spacings, and the locations of the five Dopplar radars (Xuzhou, Lianyungang, Huaian, Taizhou and Yancheng) (a), and the timeline of the analyses and forecasts on each of the four grids (b).In Fig.4(a), the circles represent the 230 km range rings of the radar |
4 模拟结果分析
4.1 1 km网格龙卷超级单体风暴的模拟
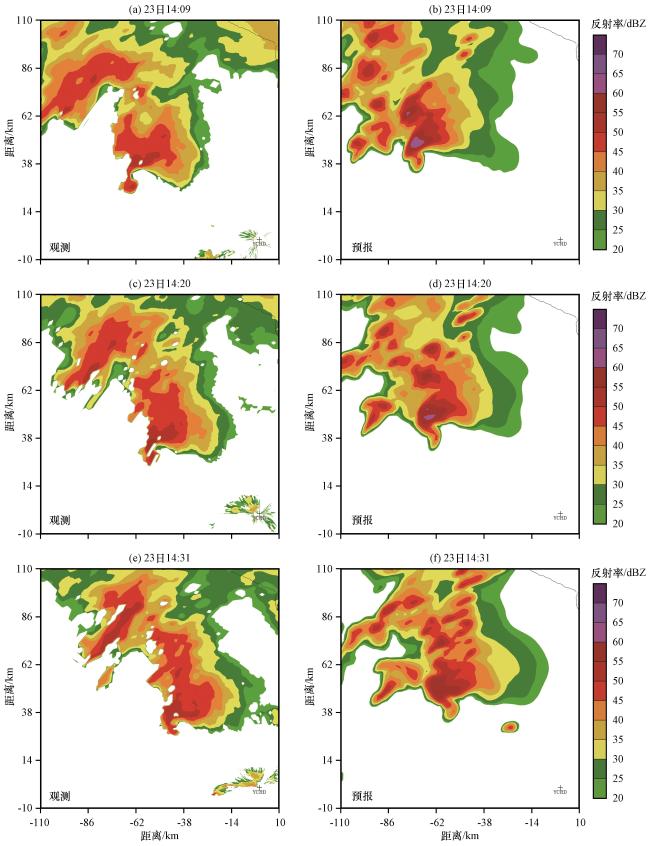
图5 2016年6月23日14:09(a, b), 14:20(c, d), 和14:31(e, f)0.5°仰角盐城雷达观测(左列)和模式1 km网格模拟(右列)的反射率(单位: dBZ)右下角的十字代表盐城雷达站(YCRD)位置 Fig.5 The observed (left column) and simulated (right column) reflectivity fields at 0.5 elevation from Yancheng Radar (YCRD) on 1-km grid at 11-min intervals from 14:09 to 14:31 on 23 June 2016.Unit: dBZ.In the lower right corner, the cross denoted Yancheng Radar (YCRD) |
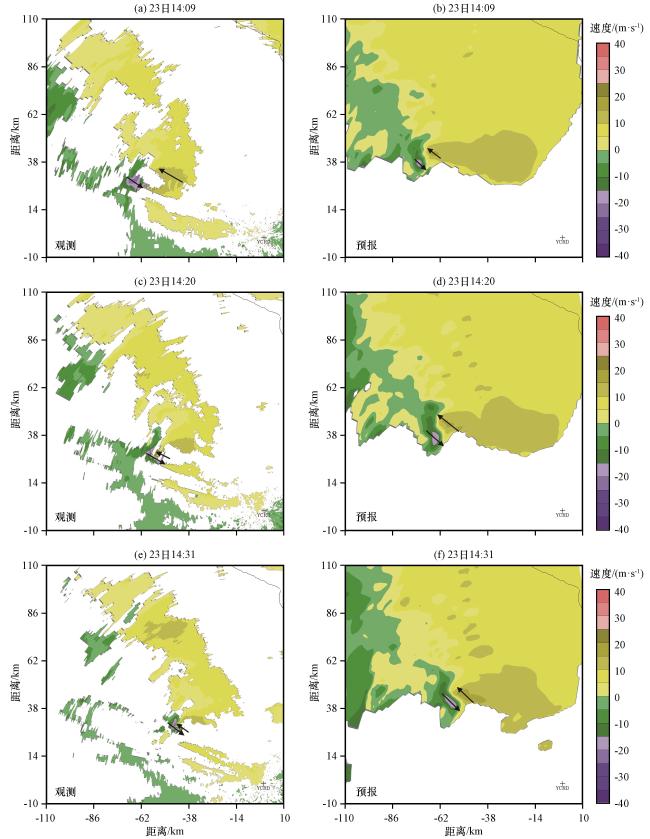
图6 2016年6月23日14:09(a, b), 14:20(c, d), 和14:31(e, f)0.5°仰角盐城雷达观测(左列)和模式1 km网格模拟(右列)的径向速度(单位: m·s-1)右下角的十字代表盐城雷达站(YCRD)位置, 黑色箭头代表旋转中心附近的速度方向 Fig.6 The observed (left column) and simulated (right column) radial velocity fields at 0.5 elevation from Yancheng Radar (YCRD) on 1 km grid at 11 min intervals from 14:09 to 14:31 on 23 June 2016.Unit: m·s-1.In the lower right corner, the cross denoted Yancheng Radar (YCRD).The black arrows denote the direction of the radial velocity near the rotation center |
4.2 250 m和75 m网格对龙卷的模拟
4.2.1 250 m和75 m网格对龙卷超级单体的模拟
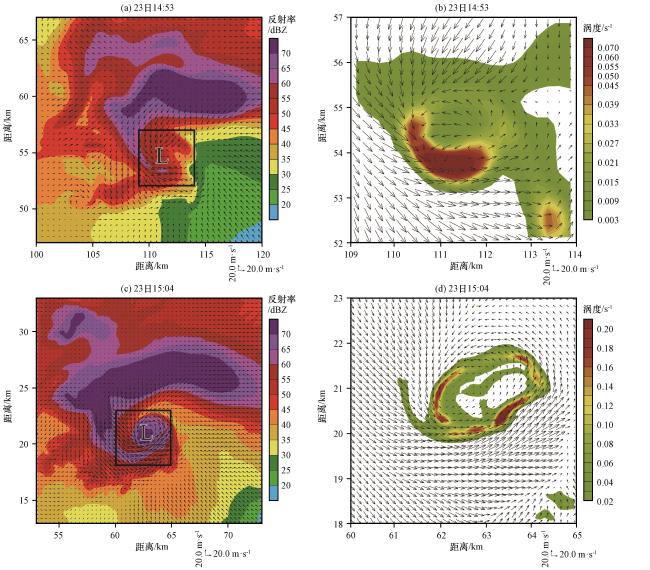
图7 250 m(a, b)和75 m(c, d)网格预报的500 m高度反射率(彩色区, 单位: dBZ)和水平风(矢量, 单位: m·s-1)(a, c)及左图中黑框区域相应时刻的50 m高度垂直涡度(彩色区, 单位: s-1)和水平风(矢量, 单位: m·s-1)(b, d)分布L为龙卷涡旋 Fig.7 The reflectivity (color area, unit: dBZ) and horizontal winds fields (vector, unit: m·s-1) on 500 m AGL (a, c), and vertical vorticity (color area, unit: s-1) and horizontal winds (vector, unit: m·s-1) fields on 50 m AGL plotted in the domain of black boxes in left-hand panels (b, d) at 14:53 on 250 m gird (a, b) and at 15:04 on 75 m gird (c, d).The letter L denote tornadic vortex |
4.2.2 TLVs的生成
4.2.3 模拟的龙卷强度和演变
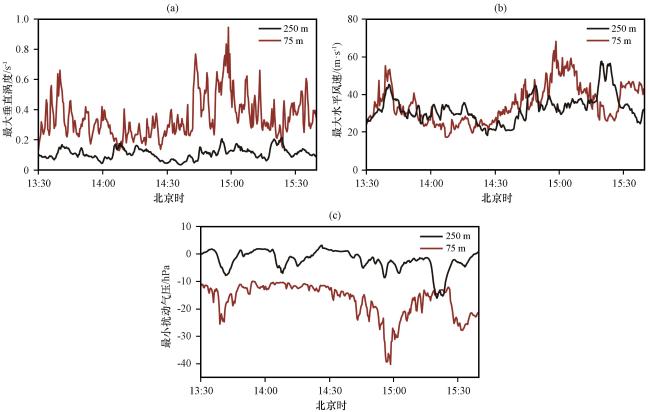
4.3 75 m网格龙卷涡旋结构和演变
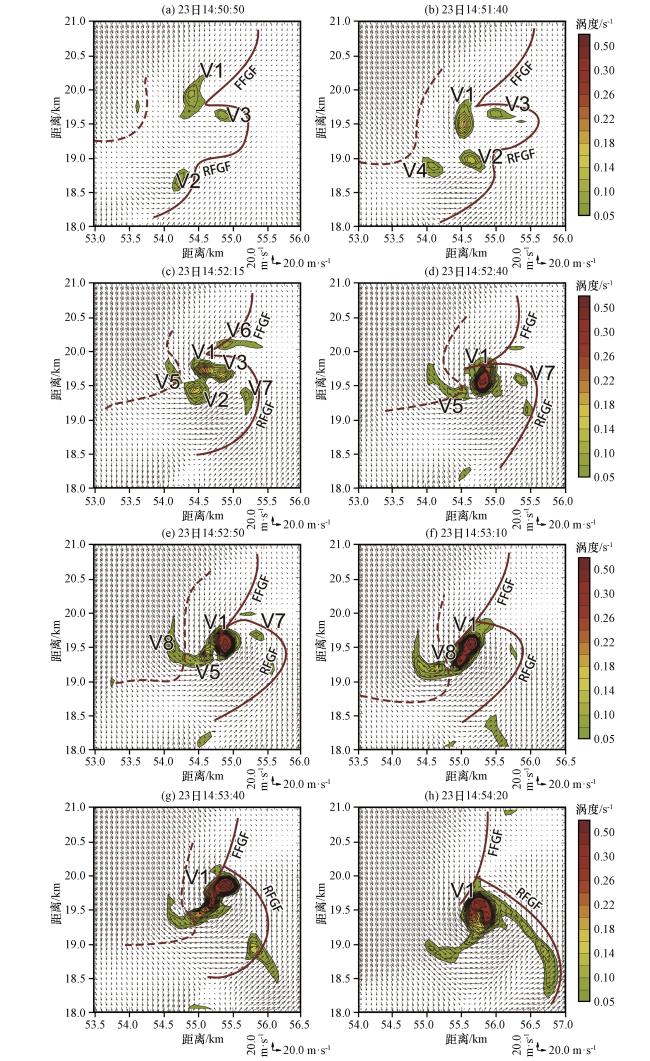
图10 2016年6月23日75 m网格模拟的50 m高度垂直涡度(彩色区和等值线, 单位: s-1)和水平风场(矢量, 单位: m·s-1)分布棕色实线表示FFGF和RFGF, 棕色虚线表示次级出流阵风锋 Fig.10 Distribution of simulated vertical vorticity (color area and contour, unit: s-1) and horizontal winds (vector, unit: m·s-1) at 50 m AGL of 75 m grid on 23 June 2016.The solid and dash brown lines mark the locations of the FFGFs, RFGFs and the front gust of the secondary outflow, respectively |
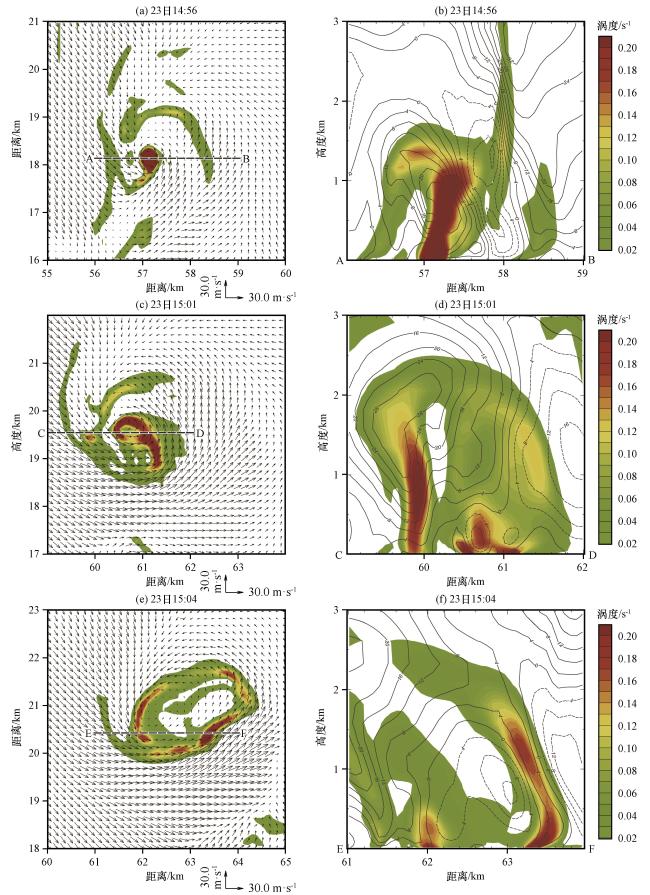


图11 2016年6月23日75 m网格预报的50 m高度垂直涡度(彩色区, 单位: s-1)和水平风场(矢量, 单位: m·s-1)(左列), 及沿左列虚线标记剖面的垂直涡度(彩色区, 单位: s-1)和垂直速度(等值线, 单位: m·s-1)(右列)分布Fig.11 The simulated vertical vorticity (color area, unit: s-1) and horizontal winds (vector, unit: m·s-1) on 50 m AGL (left column), and the cross section of the vertical vorticity (color area, unit: s-1) and vertical velocity (contour, unit: m·s-1) (right column) along the left-hand panels with the black dashed lines on 75 m grid on 23 June 2016 |