1 引言
2 资料选取
3 质量控制算法设计
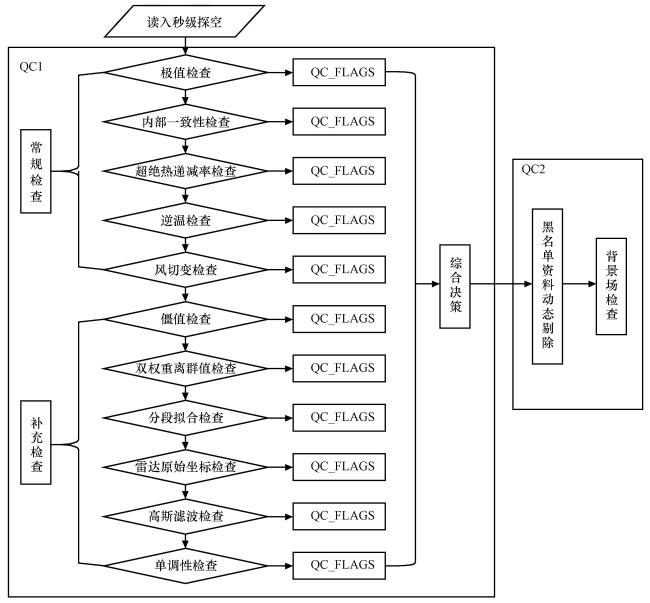
3.1 过失误差质量控制(QC1)
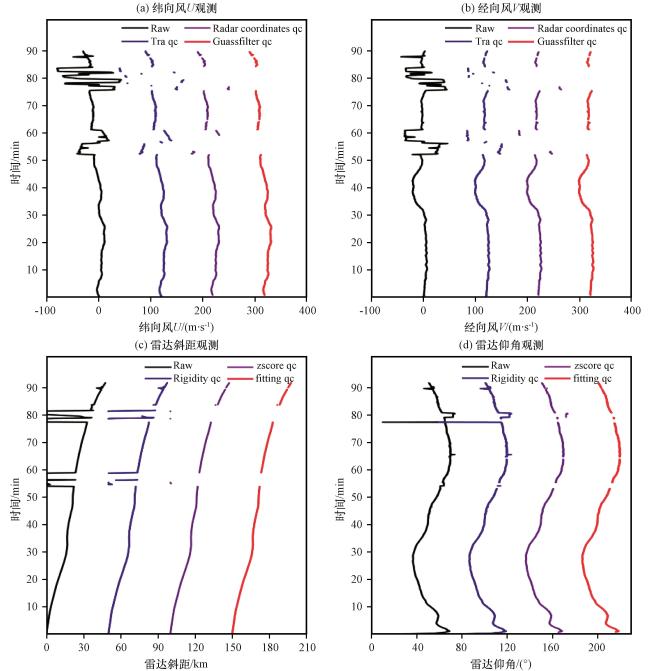
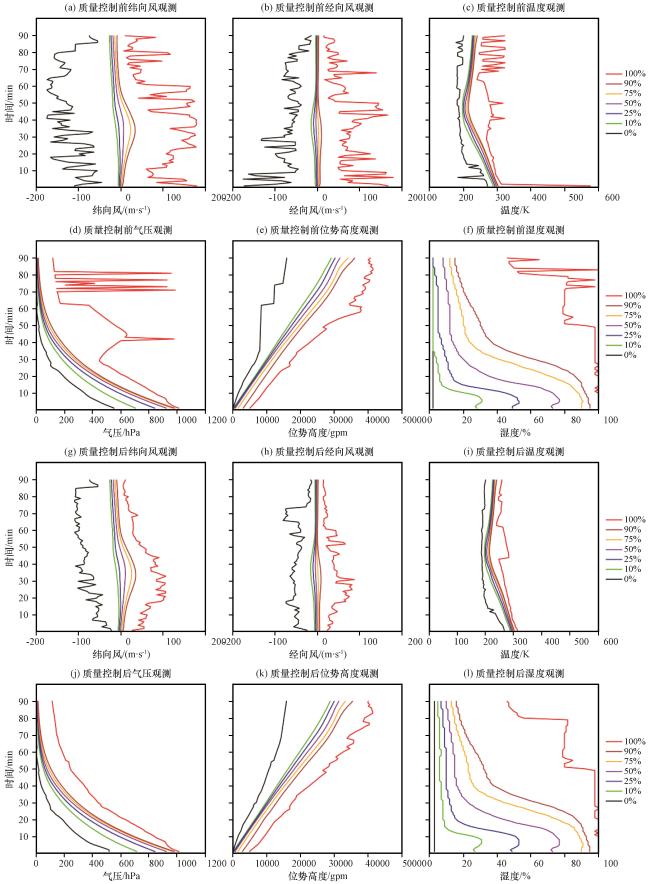
图4 2018年6月1日至8月31日秒级探空观测资料集的质量控制前后的风场观测、 温度观测、 气压观测、 位势高度和湿度观测在不同百分位的抽样分布Fig.4 Observation samples at different percentile of wind filed, temperature, pressure, geopotential height and relative humidity of radiosonde datasets before quality control and after quality control from 1 June to 31 August 2018 |
表1 秒级探空观测资料集质量控制前后观测要素的样本量、 时间变率标准差, 以及资料剔除率Table 1 The sample numbers, standard deviations of time variability and data rejection of observation elements from second radiosonde datasets before and after quality control |
| 观测要素 | 样本数 | 时间变率的标准差 | 资料剔除率 | ||
|---|---|---|---|---|---|
| 质量控制前 | 质量控制后 | 质量控制前 | 质量控制后 | ||
| 纬向风 | 67019871 | 58225081 | 0.167 m·s-2 | 0.117 m·s-2 | 13.1% |
| 经向风 | 67019871 | 58225081 | 0.146 m·s-2 | 0.092 m·s-2 | 13.1% |
| 温度 | 69761326 | 65726971 | 0.098 k·s-1 | 0.067 k·s-1 | 5.8% |
| 气压 | 69610936 | 63284624 | 1.156 hPa·s-1 | 1.026 hPa·s-1 | 9.1% |
| 位势高度 | 69761326 | 66341278 | 0.403 gpm·s-1 | 0.211 gpm·s-1 | 4.9% |
| 相对湿度 | 69761326 | 54878211 | 0.383% ·s-1 | 0.287%·s-1 | 21.3% |
3.2 代表性偏差质量控制(QC2)
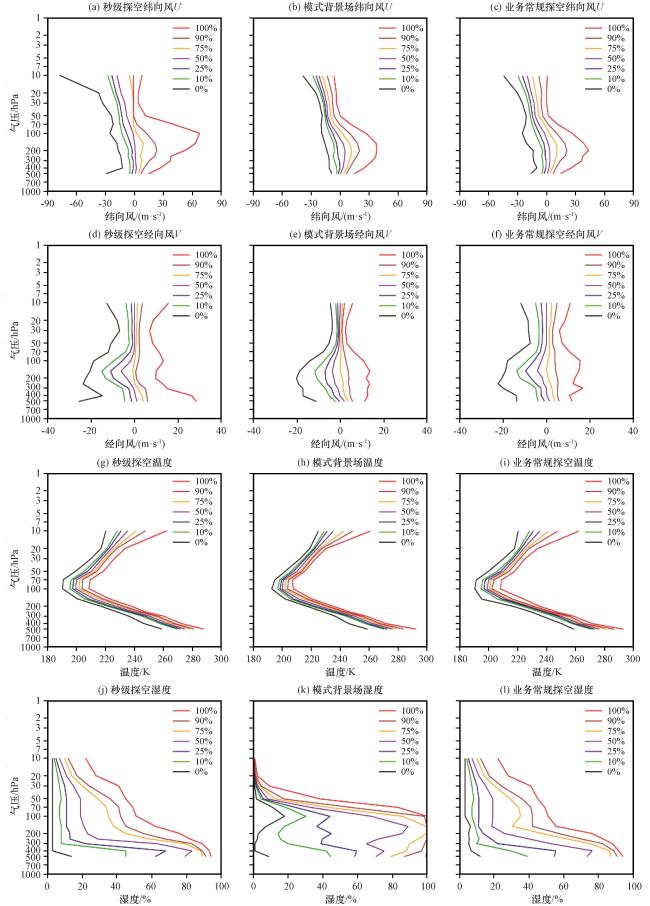
图6 2018年6月1日至8月31日那曲站(55299)秒级探空、 对应模式背景场和业务常规探空的风场、 温度和湿度场在不同百分位的廓线分布Fig.6 Vertical distribution at different percentiles of second-level radiosonde’s wind filed, temperature and relative humidity, corresponding model background field and operational traditional radiosonde at Naqu (55299) station from 1 June to 31 August 2018 |
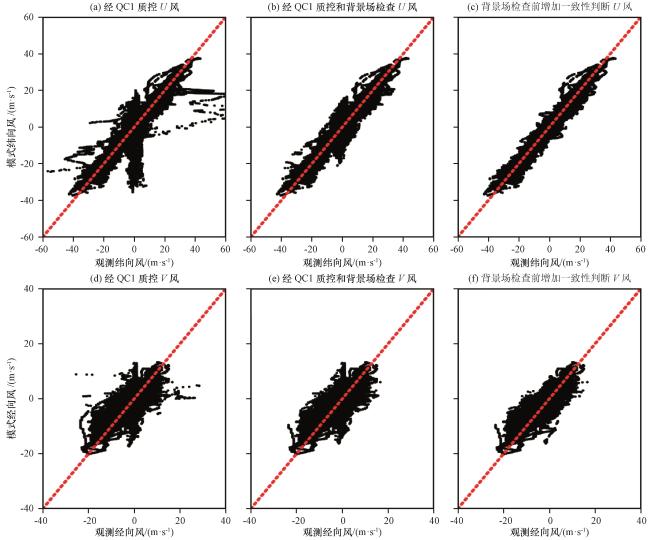
表2 那曲站(55299)风场观测相对于模式背景场的标准差和偏差Table 2 Standard deviations and bias of wind observations at Naqu(55299) station against model background |
| 质量控制方案 | 标准差/(m·s-1) | 偏差/(m·s-1) | 累积资料剔除率/% | |||||
|---|---|---|---|---|---|---|---|---|
| U | V | U | V | U | V | |||
| 仅QC1 | 7.02 | 3.16 | 1.88 | 0.21 | 35.1 | 35.1 | ||
| 加QC2(仅背景场检查) | 4.61 | 3.10 | 0.64 | 0.19 | 40.9 | 35.7 | ||
| 加QC2(加上d指数检查) | 2.79 | 2.95 | 0.25 | -0.02 | 53.1 | 56.4 | ||
3.3 质量控制效果综合分析
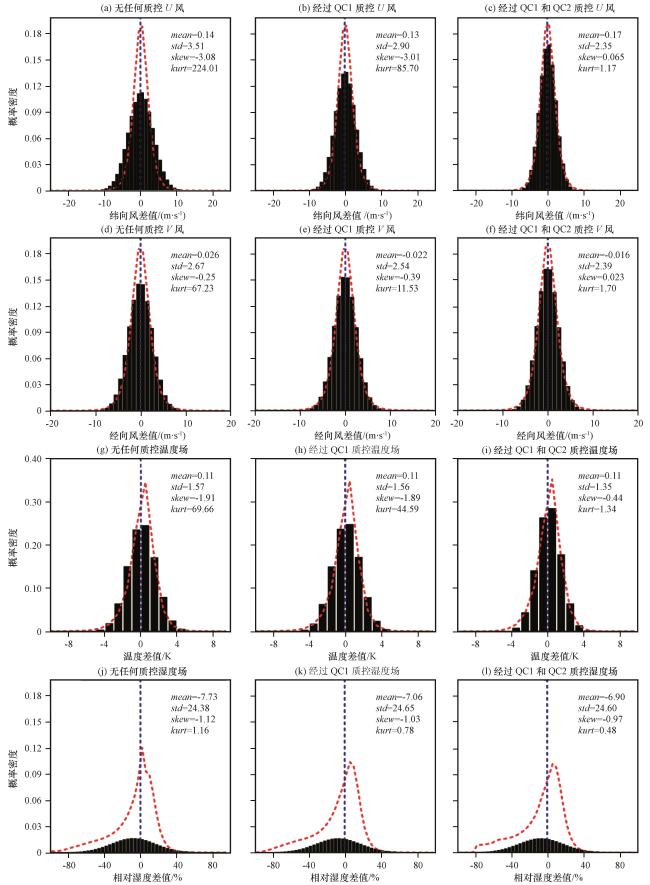
4 数值试验
4.1 试验方案
表3 数值试验方案设计Table 3 Numerical experiment schemes |
| 试验 | 方案 |
|---|---|
| Exp1 | 同化资料为地面、 飞机、 云导风、 船舶、 掩星折射率、 卫星洋面风+全国120站秒级探空(00:00/12:00), 其中秒级探空仅经过背景场检查(同化系统中自带缺省方案), 为控制试验 |
| Exp2 | 同Exp1, 但秒级探空经过本文提出的两步质量控制方案, 为敏感性试验, 旨在考察两步质量控制法在实际同化应用中的效果 |
| Exp3 | 同Exp1, 但探空资料为目前业务常规探空, 为平行试验, 旨在探讨两步质控后秒级探空是否具备替代业务常规探空的潜力 |
4.2 新息向量分析
表4 不同数值试验方案下OMB/OMA的均方根误差(RMSE)Table 4 RMSE (root mean square error) of OMB/OMA in assimilation system of different numerical experiment schemes |
| 观测要素 | O-B (A) | Exp1 (Sec-default) | Exp2 (Sec-2stepqc) | Exp3 (Oper-Tra) |
|---|---|---|---|---|
| U-wind/(m·s-1) | O-B | 3.22 | 2.71 | 2.91 |
| O-A | 3.10 | 2.03 | 2.25 | |
| V-wind/(m·s-1) | O-B | 2.97 | 2.69 | 2.91 |
| O-A | 2.88 | 2.01 | 2.23 | |
| T/K | O-B | 1.98 | 1.50 | 1.57 |
| O-A | 2.37 | 1.18 | 1.32 | |
| RH/% | O-B | 18.17 | 17.14 | 16.83 |
| O-A | 18.05 | 14.60 | 15.26 |
4.3 同化效果分析
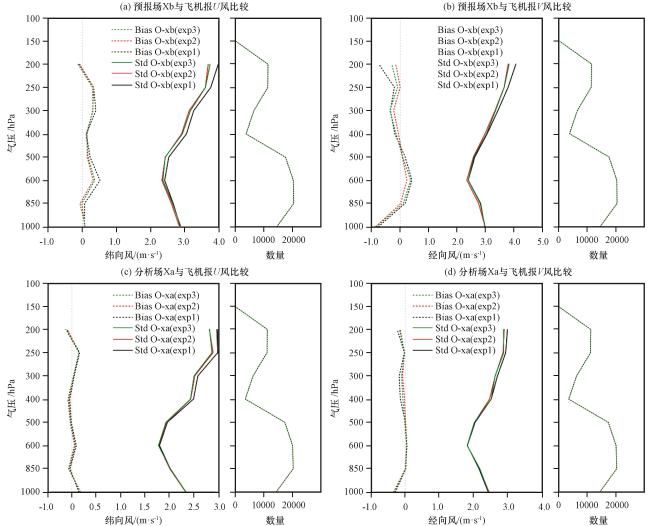
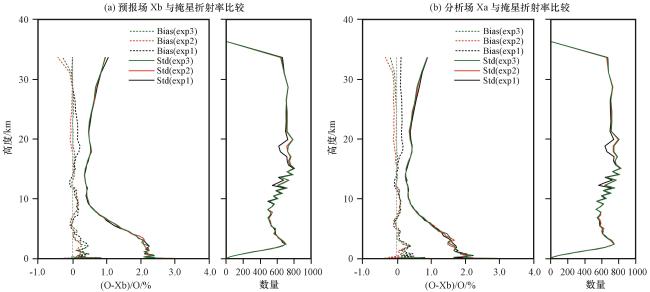
图9 循环同化分析场Xa和预报场Xb相对于飞机报观测的标准差和偏差的垂直分布exp1代表控制试验, exp2代表敏感性试验, exp3代表平行试验 Fig.9 Vertical distribution of STD (standard deviation) and Bias of cycling analyzed field (Xa) and forecast field (Xb) against aircraft observation.the label “exp1” represents control experiment, “exp2” means sensitive experiment, “exp3”indicate parallel experiment |