1 引言
2 方法、 资料及试验设计
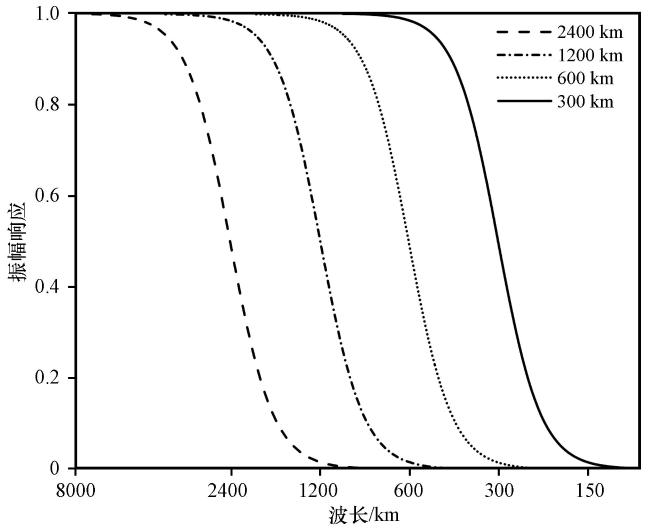
2.1 Blending方案
2.2 区域及试验设置
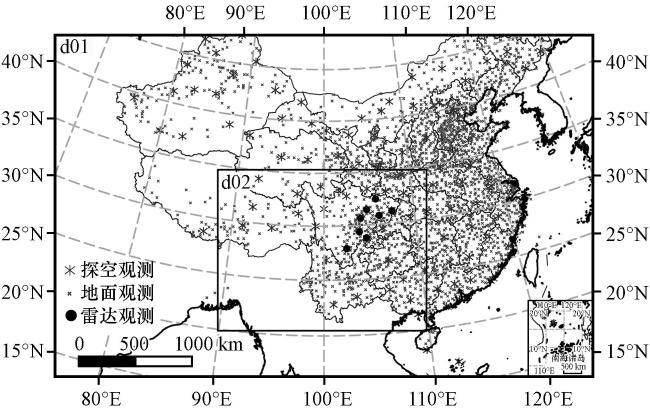
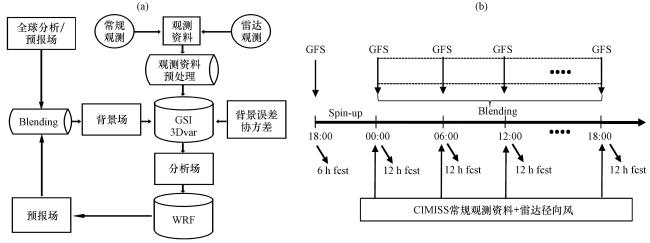
图3 引入了Blending方案的循环同化系统流程图(a)和循环同化方案示意图(b)Fig.3 Flow chart (a) and schematic diagram (b) of update cycle system with Blending scheme |
表1 试验方案设计Table 1 Design of experiments |
| 试验名称 | 同化资料 | 截断尺度 |
|---|---|---|
| NoBld | 常规观测、 雷达径向风 | - |
| Bld_1200 | 常规观测、 雷达径向风 | 1200 km |
| Bld_600 | 常规观测、 雷达径向风 | 600 km |
| Bld_mix | 常规观测、 雷达径向风 | U, V: 600 km; T, Q: 1200 km |
-表示无数据 |
3 试验结果分析
3.1 批量试验结果
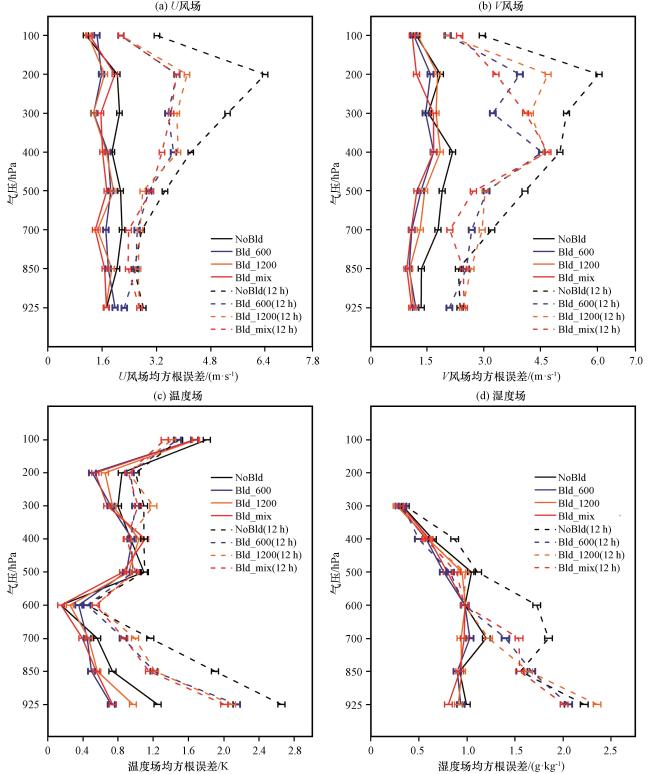
图4 连续一周循环平均的均方根误差分析场(实线), 12 h预报场(虚线), 水平误差条表示95%的置信区间 Fig.4 Root mean square error for a continuous week.Analysis field (solid line), forcast field (dotted line), Horizontal error bar represents 95% confidence interval |
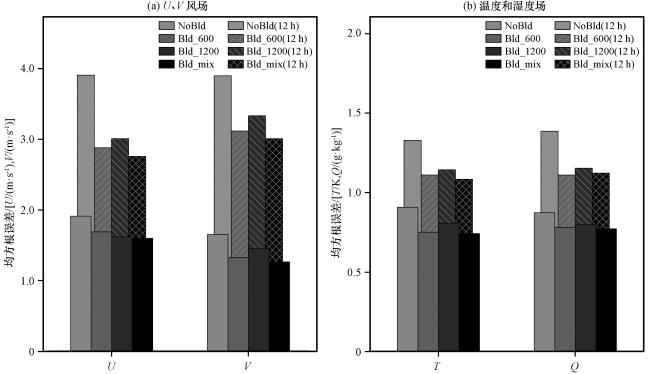
3.2 降水预报分析
3.2.1 定量降水评估
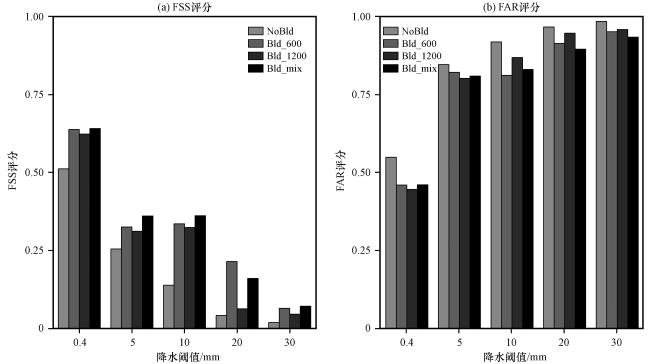
图6 2019年7月10日12:00至11日18:00四组试验不同降水阈值逐6 h平均累计降水FSS评分和FAR评分Fig.6 6-hour average cumulative precipitation FSS and FAR score of four experiments at different precipitation thresholds from 12:00 on 10 to 18:00 on 11 July 2019 |
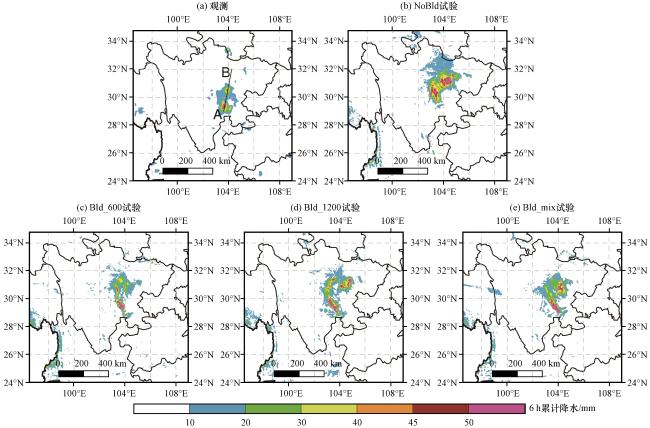
3.2.2 降水分布及物理量场诊断
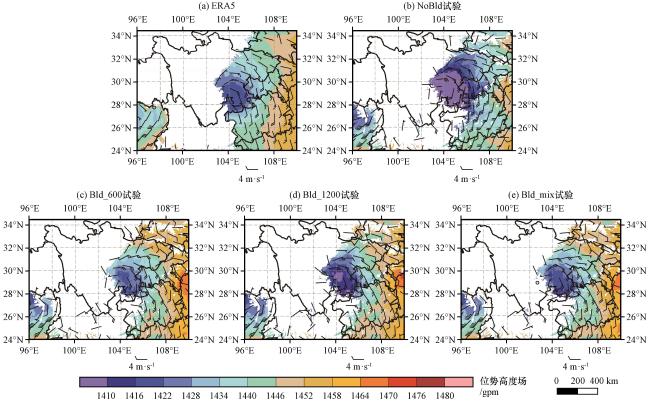
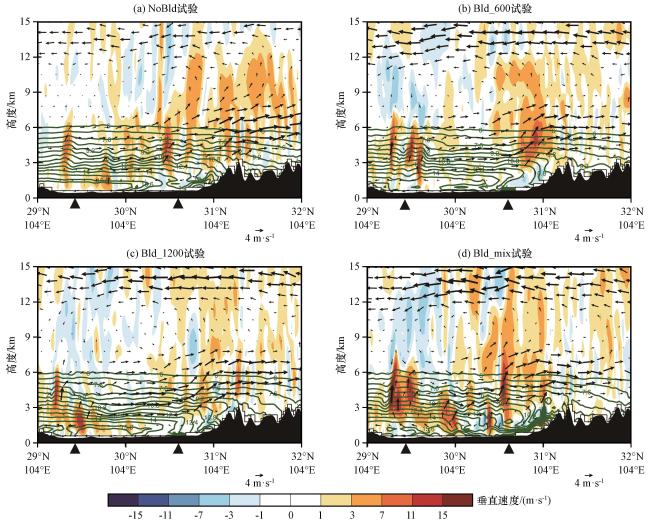
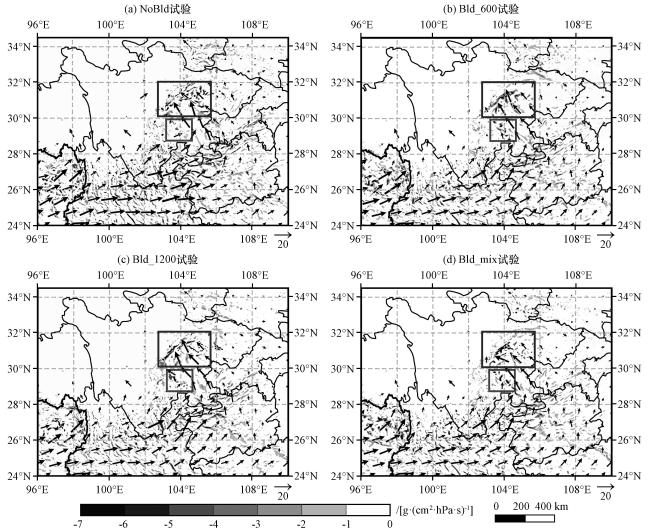
图9 2019年7月10日21:00二维风场u, w(矢量, 单位: m·s-1)、 垂直速度(彩色区, 放大10倍, 单位: m·s-1)和水汽混合比(等值线, 单位: g·kg-1)沿A、 B两个点的剖面▲标识对应实况观测的降水中心位置, 黑色阴影为地形, 折线区域缺数据 Fig.9 Wind field u, w (vector, unit: m·s-1)) and vertical velocity (color area, ω magnified 10 times, unit: m·s-1) and water vapor mixing ratio (isoline, unit: g·kg-1) along the profile of points A and B at 21:00 on 10 July 2019.The mark ▲ corresponds to the precipitation center position of the actual observation, the black shadow is the terrain, and the polyline area lacks data |