
1 引言
2 资料来源与方法介绍
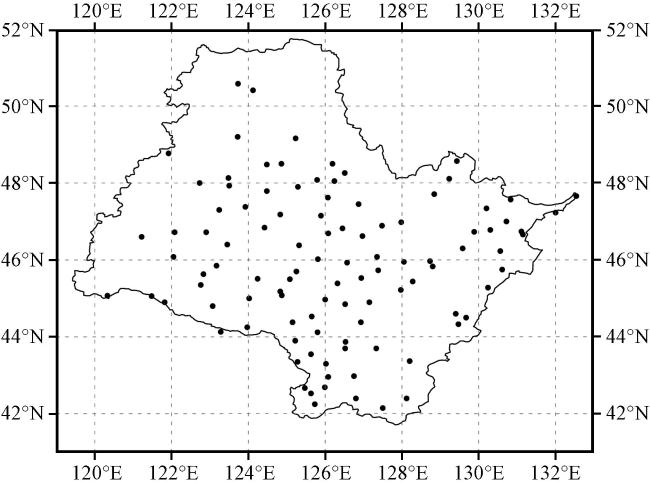
2.1 资料来源
2.2 方法介绍
3 松花江流域冬季降雪变化特征及其与环流的关系
3.1 松花江流域冬季降雪特征
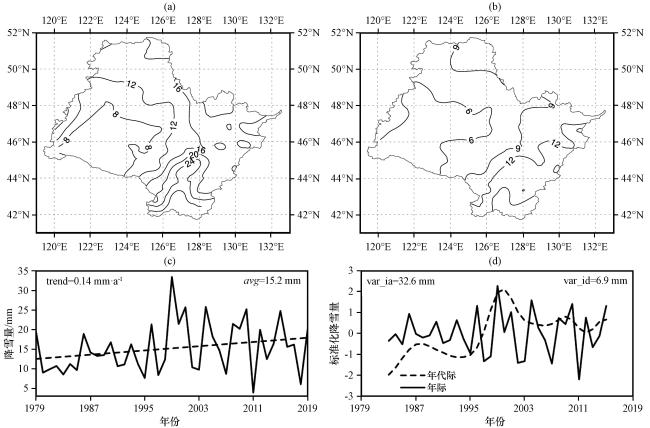
图2 1979 -2019年松花江流域冬季降雪的气候平均态(a, 单位: mm·sea-1)和标准差(b, 单位: mm·sea-1)分布; 以及103站平均降雪的滤波前(c)与滤波后标准化年际(实线)和年代际(虚线)(d)的时间序列Fig.2 Distribution of the climatology (a, unit: mm·sea-1) and standard deviations (b, unit: mm·sea-1) of snowfall; original (c), standardized interannual (solid line) and interdecadal (dashed line) (d) time series of 103-station-averaged snowfall in winter over SRB for 1979 -2019 |
3.2 松花江流域冬季降雪的相关环流特征
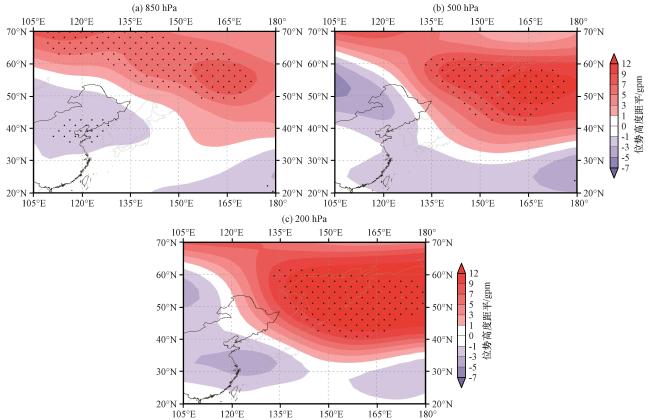
图4 1979 -2019年SRBI与冬季850 hPa, 500 hPa, 200 hPa位势高度距平的回归系数分布(单位: gpm)打点区域通过90%显著性检验 Fig.4 Regressions of winter 850 hPa, 500 hPa, 200 hPa geopotential height anomalies (unit: gpm) against SRBI from 1979 to 2019.The dotted areas indicate values that are statistically significant at the 90% level |
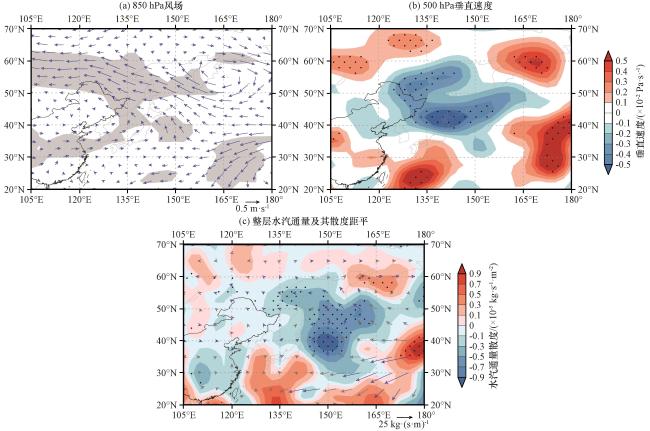
图5 1979 -2019年SRBI与冬季850 hPa风场(矢量, 单位: m·s-1), 500 hPa垂直速度(单位: ×10-2 Pa·s-1)和整层水汽通量[矢量; 单位: kg·(s·m) -1]及其散度(阴影区, 单位: ×10-5 kg·s-1·m-2)距平的回归系数分布(a)中阴影和(b, c)中打点区域通过90%显著性检验 Fig.5 Regressions of winter 850 hPa wind (vector, unit: m·s-1), 500 hPa vertical velocity (unit: ×10-2 Pa·s-1), whole layer moisture flux [vector; nuit: kg·(s·m)-1] and divergence (shaded; unit: ×10-5 kg·s-1·m-2) anomalies against SRBI from 1979 to 2019. The shaded in (a) and dotted areas in (b, c) indicate values that are statistically significant at the 90% level |
4 松花江流域冬季降雪与西北太平洋海温的关系
4.1 松花江流域冬季降雪与西北太平洋海温异常的协同变化
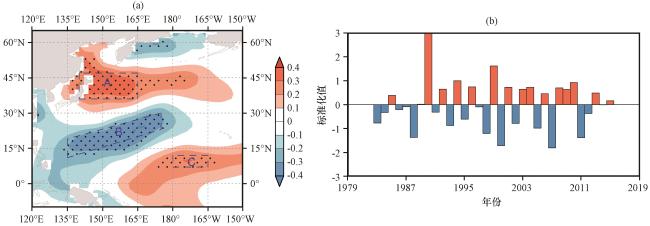
图6 1979 -2019年SRBI与冬季西北太平洋地区海温距平的相关系数分布(a, 打点区域通过90%显著性检验), 西北太平洋海温指数的时间序列(b)Fig.6 Correlation coefficients between SRBI and winter SSTA over west north Pacific (a, dotted areas indicate values that are statistically significant at the 90% level), time series of west north Pacific index for 1979 -2019 (b) |
4.2 西北太平洋海温异常影响松花江流域降雪的可能机制
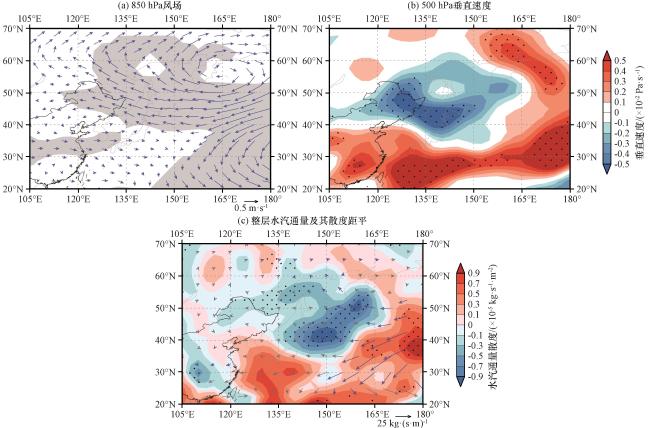
图7 1979 -2019年WNPI与冬季850 hPa风场(矢量, 单位: m·s-1), 500 hPa垂直速度(单位: ×10-2 Pa·s-1)和整层水汽通量[矢量, 单位: kg·(s·m) -1]及其散度(阴影区, 单位: ×10-5 kg·s-1·m-2)距平的回归系数分布(a)中阴影和(b, c)中打点区域通过90%显著性检验 Fig.7 Regressions of winter 850 hPa wind (vector, unit: m·s-1), 500 hPa vertical velocity (unit: ×10-2 Pa·s-1), whole layer moisture flux [vector, nuit: kg·(s·m)-1] and divergence (shaded, unit: ×10-5 kg·s-1·m-2) anomalies against WNPI from 1979 to 2019. The shaded in (a) and dotted areas in (b, c) indicate values that are statistically significant at the 90% level |
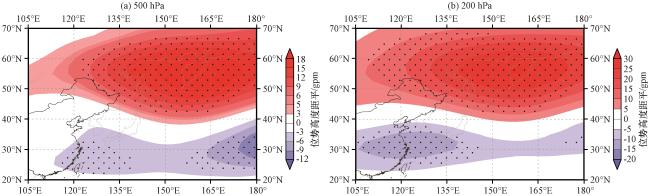
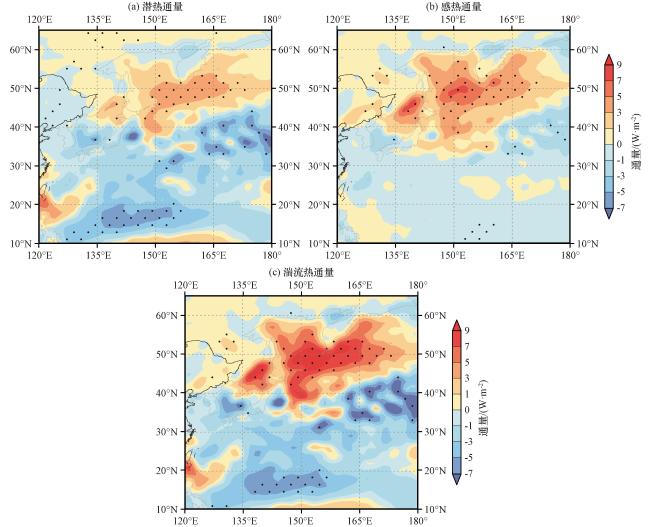
图9 1979 -2019年WNPI与冬季潜热通量, 感热通量以及湍流热通量距平(单位: W·m-2)的回归系数分布打点区域通过90%显著性检验 Fig.9 Regressions of winter latent heat flux, sensible heat flux and turbulent heat flux anomalies (unit: W·m-2) against WNPI from 1979 to 2019. The dotted areas indicate values that are statistically significant at the 90% level |
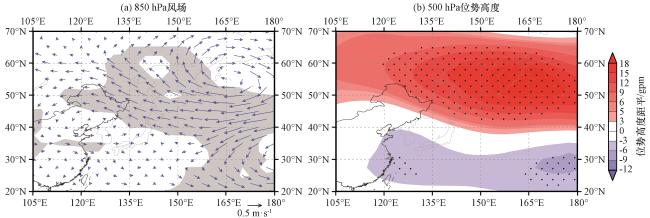
图10 1979 -2019年WNPI与冬季850 hPa风场(单位: m·s-1)和500 hPa位势高度(单位: gpm)距平的回归系数分布阴影和打点区域通过90%显著性检验, 数据中区域C海温的影响已去除 Fig.10 Regressions of winter 850 hPa vector (unit: m·s-1) and 500 hPa geopotential height (unit: gpm) anomalies against WNPI from 1979 to 2019.The shaded and dotted areas indicate values that are statistically significant at the 90% level, the signal of SST over area C in Fig.6a has been removed from data |