
1 引言
2 双偏振参量简述及资料分析方法
3 天气背景
表1 两次强对流天气过程中章丘探空资料Table 1 The sounding data of Zhangqiu in two severe convective weather |
| 日期 | 0 ℃, -10 ℃, -20 ℃层/km | CAPE /(J·kg -1) | W sr/(m·s -1) | Δ T/℃ |
|---|---|---|---|---|
| 2019-05-10 | 2.9, 4.4, 5.9 | 1200~2460 * | 13.9 | 30 |
| 2021-07-09 | 4.3, 6.0, 7.4 | 4550.5 * | 19.5 | 30 |
*表示订正后的CAPE数据 |
4 湍流回波特征分析
4.1 2019年 5月 10日超级单体风暴
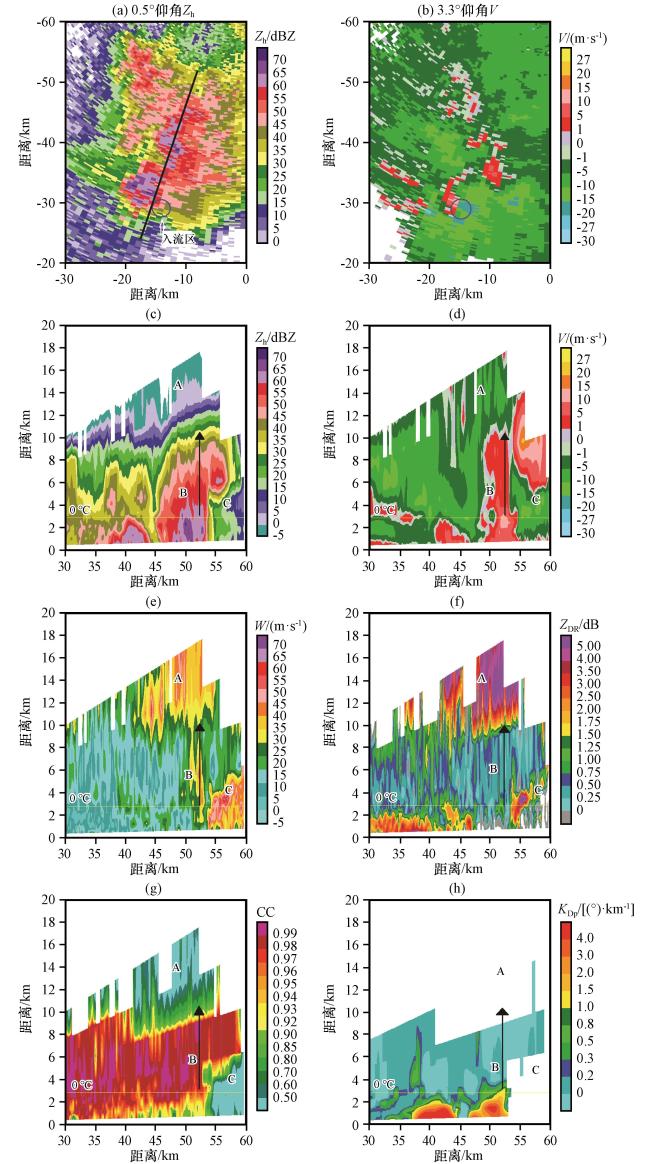
图1 2019年5月10日18:18济南雷达0.5°仰角反射率因子 Z h(a), 3.3°仰角多普勒速度 V(b), 沿图(a)中黑色实线所做的垂直剖面, 水平反射率因子 Z h(c), 多普勒速度 V(d), 谱宽 W(e), 差分反射率因子 Z DR(f), 相关系数CC(g)及差分相移率 K DP(h)图(a)、 (b)中的坐标是指以雷达中心为坐标0点, 雷达西、 南方向用负距离表示, 东、 北方向用正距离表示, 黄色实线为0℃等温线 Fig.1 Reflectivity factor Z h (a) at 0.5° elevation, velocity V (b) at 3.3° elevation, and vertical profile of horizontal reflectivity factor (c), Doppler velocity (d), spectral width W (e), differential reflectivity factor (f), correlation coefficient (g), differential phase constant K DP (h) along solid black line in Fig.1(a) from Jinan radar at 18:18 on 10 May 2019. The coordinates in figure (a) and (b) refer to the radar center as the coordinate point 0, the west and south directions of the radar are represented by a negative distance, and the east and north directions are represented by a positive distance.The yellow line is the 0 ℃ isotherm |
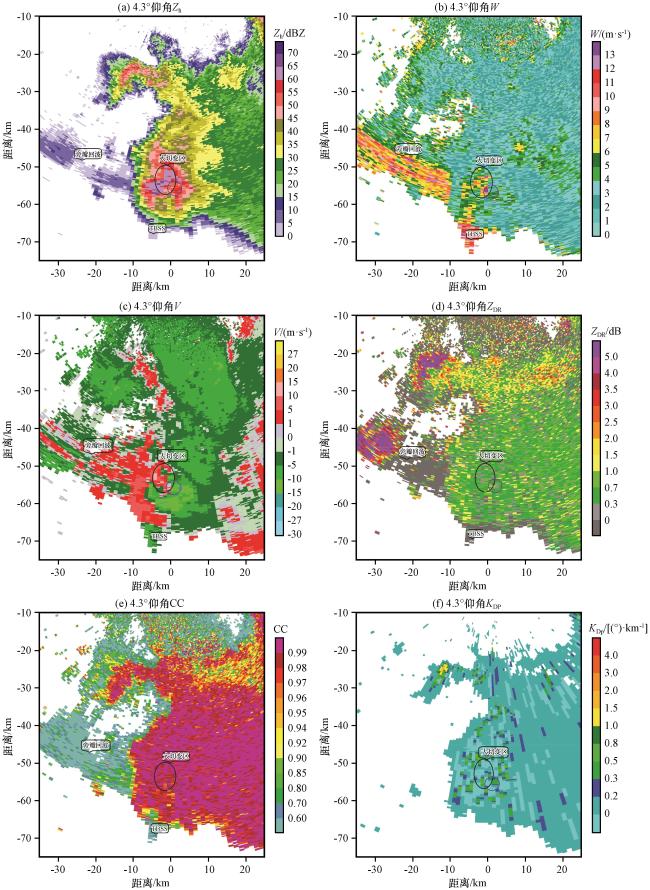
图2 2019年5月10日18:47 济南雷达4.3°仰角 Z h(a)、 W(b)、 V(c)、 Z DR(d)、 CC(e)、 K DP(f)图中坐标是指以雷达中心为坐标0点, 雷达西、 南方向用负距离表示, 东、 北方向用正距离表示 Fig.2 Z h(a), W(b), V(c), Z DR(d), CC(e)and K DP(f)at 4.3° elevation from Jinan radar at 18:47 on 10 May 2019. The coordinates in figure refer to the radar center as the coordinate point 0, the west and south directions of the radar are represented by a negative distance, and the east and north directions are represented by a positive distance |
4.2 2021年 7月 9日超级单体风暴
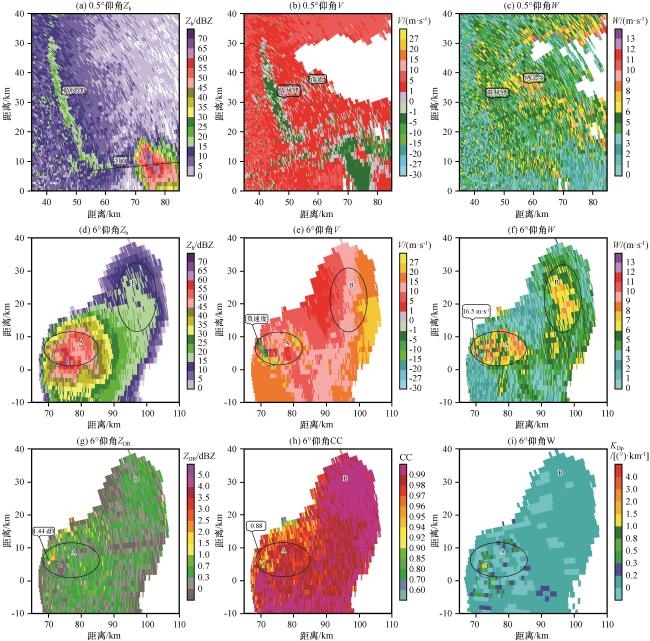
图3 2021年7月9日14:19 济南雷达0.5°仰角 Z h(a)、 V(b)、 W(c), 6°仰角 Z h(d)、 V(e)、 W(f)、 Z DR(g)、 CC(h)、 K DP(i)图(a)、 (b)、 (c)中的坐标是指以雷达中心为坐标0 点, 雷达西、 南方向用负距离表示, 东、 北方向用正距离表示 Fig.3 Z h (a), V (b)and W (c)at 0.5° elevation and Z h (d), V (e), W (f), Z DR (g), CC (h), and K DP (i) at 6° elevation from Jinan radar at 14:19 on 10 July 2021. The coordinates in figure (a), (b) and (c) refer to the radar center as the coordinate point 0, the west and south directions of the radar are represented by a negative distance, and the east and north directions are represented by a positive distance |
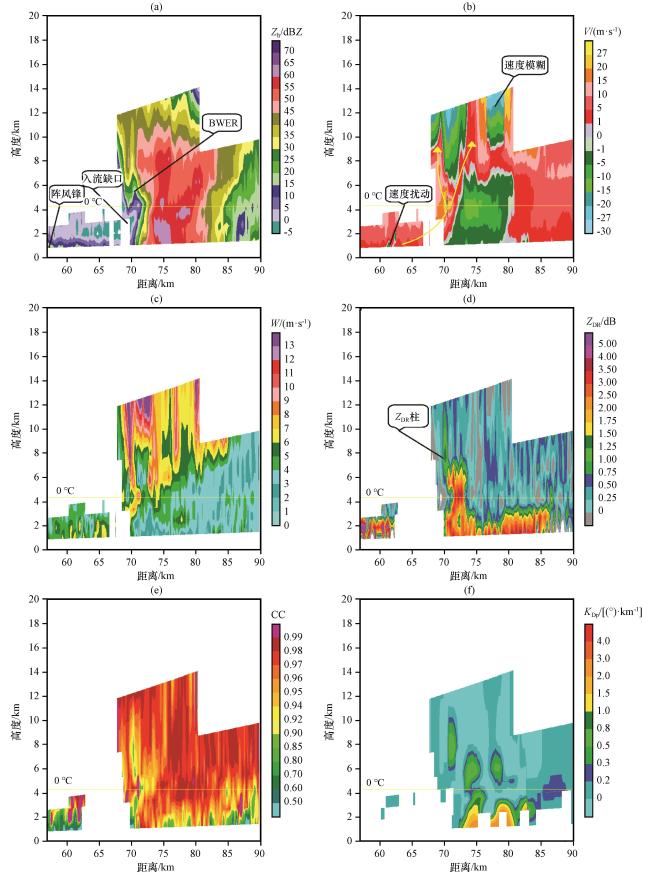
图4 沿图3(a)中黑色实线所做的 2021年7月9日14:19济南雷达回波垂直剖面, Z h(a)、 V(b)、 W(c)、 Z DR(d)、 CC(e)、 K DP(f)黄色实线为0 ℃等温线 Fig.4 Vertical profile of Z h (a), V (b), W (c), Z DR (d), CC (e) and K DP (f) along solid black line in Fig.3(a) from Jinan radar at 14:19 on 9 July 2021. The yellow dash line is the 0 ℃ isotherm |