
1 引言
2 资料来源与方法介绍
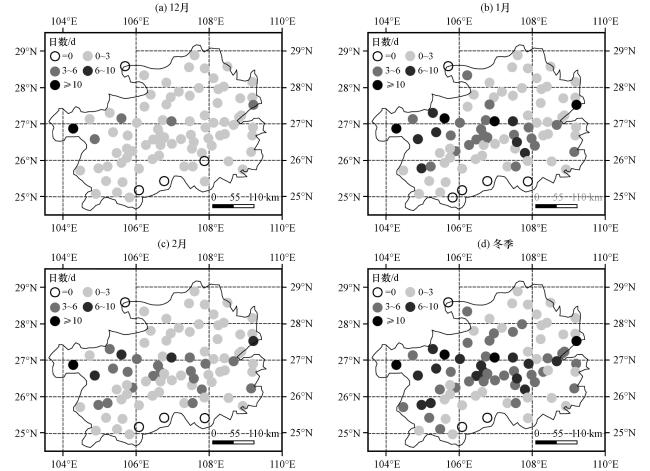
3 冬季凝冻日数的气候态特征
3.1 平均凝冻日数
3.2 凝冻日数极值
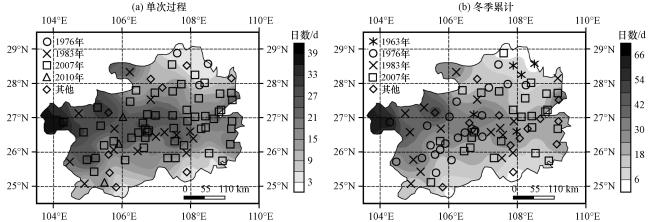
图2 贵州省单次凝冻过程持续日数(a)和冬季累计凝冻日数(b)极大值的空间分布(阴影, 单位: d)以及各站点凝冻日数极大值所出现的年份(不同形状标记表示对应年份)Fig.2 Spatial distributions of the maximum duration (the shaded, unit: d) of both single events (a) and winter (b) in Guizhou and the years of the maximum events (different marks indicate different years) |
表1 贵州省单次凝冻过程最长持续日数和冬季凝冻日数极大值出现年份及站数的统计分析Table 1 Statistics of the duration of the single process and maximum number of winter freezing days in Guizhou |
| 单次凝冻过程最长持续日数 | 冬季凝冻日数极大值 | ||||||||
|---|---|---|---|---|---|---|---|---|---|
| 排序 | 年份 | 站数/个 | 占比 | 平均日数/d | 排序 | 年份 | 站数/个 | 占比 | 平均日数/d |
| 1 | 2007 | 52 | 64.2% | 20.2 | 1 | 2007 | 25 | 30.9% | 16.7 |
| 2 | 1983 | 14 | 17.3% | 18.9 | 2 | 1976 | 22 | 27.2% | 26.6 |
| 3 | 2010 | 3 | 3.7% | 23.7 | 3 | 1983 | 16 | 19.8% | 26.6 |
| 4 | 1976 | 3 | 3.7% | 3.0 | 4 | 1963 | 5 | 6.2% | 13.0 |
| 5 | 2011 | 3 | 3.7% | 43.3 | |||||
4 冬季凝冻日数的时空分布
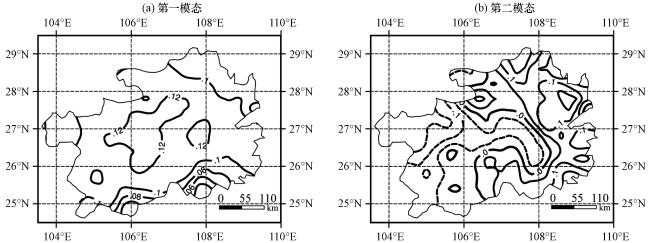
4.1 空间分布
表2 贵州冬季凝冻日数EOF分解的前2个模态结果统计Table 2 Statistics of the first and second patterns by the EOF of winter freezing days in Guizhou |
| 模态 | 特征值 i | 方差/% | 累计方差/% | i - i +1 | ei |
|---|---|---|---|---|---|
| 1 | 3108.05 | 65.04 | 65.04 | 2792.97 | 572.24 |
| 2 | 315.08 | 6.59 | 71.63 | 87.92 | 58.01 |
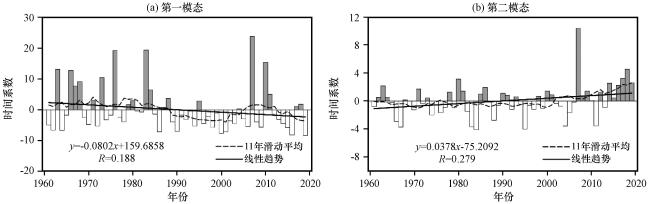
4.2 年(代)际变化特征
5 凝冻日数典型年份的大气环流特征
5.1 欧亚环流异常下的波动作用
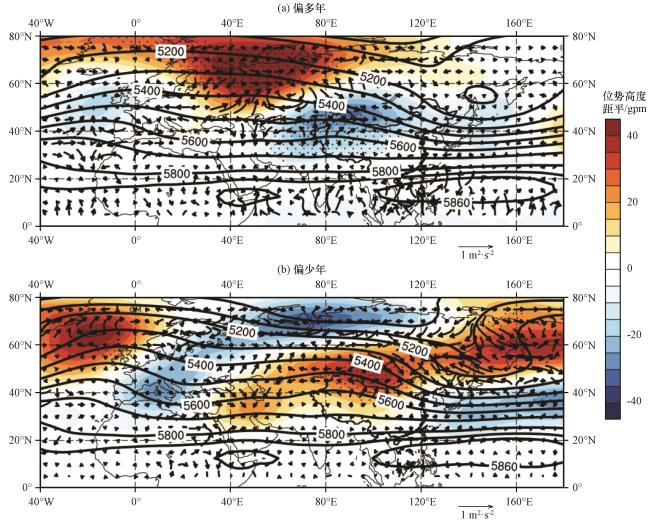
图5 贵州冬季凝冻日数异常偏多年(a)和偏少年(b)的500 hPa位势高度(单位: gpm)合成平均(等值线)及其距平(阴影), 以及相对应的T-N通量(矢量, 单位: m2·s-2)打点区域表示位势高度距平通过90%信度的显著性t检验 Fig.5 Composites (contour) and anomalies (the shaded) of geopotential height (unit: gpm) and T-N fluxes (vector, unit: m2·s-2) at 500 hPa in excessive (a) and deficient (b) years. Dotted areas are significant at a 0.05 significance t-test |
5.2 东亚局地环流异常
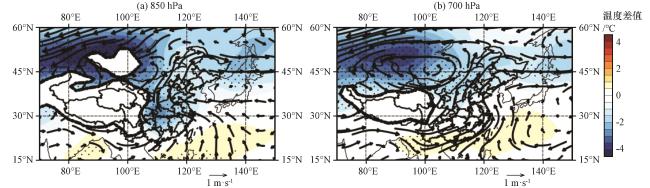
图6 贵州冬季凝冻日数异常偏多年与偏少年850 hPa(a)和700 hPa(b)风场(矢量, 单位: m·s-1)和温度(阴影, 单位: ℃)的合成差值打点区域表示温度距平通过95%信度的显著性t检验; 粗虚线表示地形 Fig.6 Composite differences of wind (vector, unit: m·s-1) and air temperature (the shaded, unit: ℃) at 850 hPa (a) and 700 hPa (b). Dotted areas are significant at a 0.05 significance t-test, thick dotted lines indicate the topography |
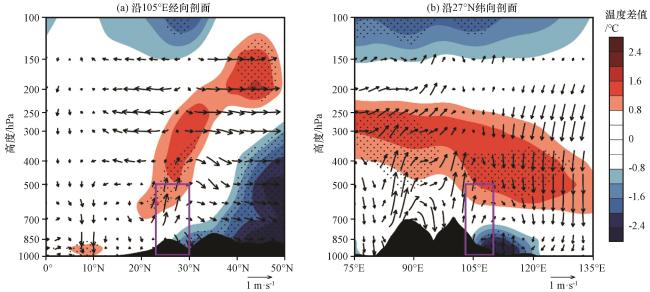
图7 贵州冬季凝冻日数异常偏多年与偏少年的垂直剖面合成差值矢量为垂直环流(单位: m·s-1); 彩色区为温度(单位: ℃); 紫色框线为贵州地区所在范围; 打点区域为温度通过95%信度的显著性t检验; 黑色阴影为地形 Fig.7 Composite differences of vertical circulations and temperatures. The vectors are vertical circulations (unit: m·s-1); color areas are temperatures (unit: ℃), purple borders indicate the region of Guizhou and black shaded indicate topographies |
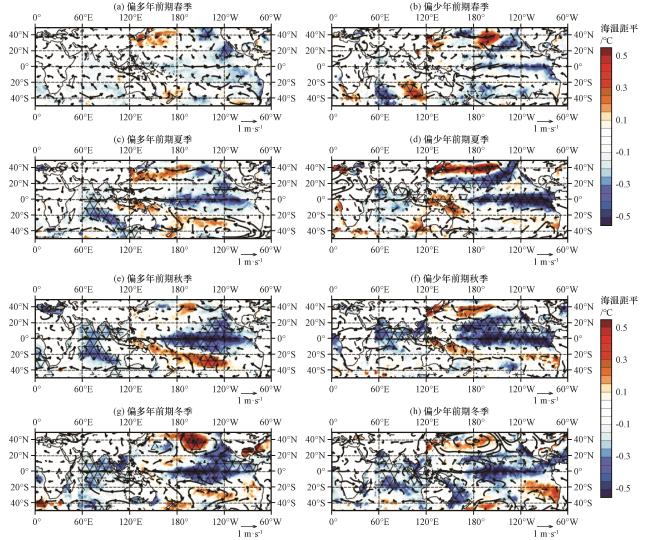
6 海温及风场演变特征
图8 贵州冬季凝冻日数异常偏多年(a, c, e, g)和偏少年(b, d, f, h)发生前期和同期海温距平(彩色区, 单位: ℃)及850 hPa风场距平(矢量, 单位: m·s-1)的合成交叉斜线区域表示海温距平通过90%信度的显著性检验 Fig.8 Anomalies of SSTA (color area, unit: ℃) and 850 hPa wind (vector, unit: m·s-1) in the early of freezing days in the excessive (a, c, e, g) and deficient (b, d, f, h) years in Guizhou. Cross-hatched areas are significant at a 0.05 significance t-test |