

1 引言
2 数据来源和方法介绍
2.1 数据来源
表1 模式列表Table 1 Model description |
| 模式名称 | 所属国家 | 分辨率(纬向格点数× 经向格点数) |
|---|---|---|
| BCC-CSM1.1(m) | 中国 | 160×320 |
| BNU-ESM | 中国 | 64×128 |
| CanESM2 | 加拿大 | 64×128 |
| CCSM4 | 美国 | 192×288 |
| GFDL-ESM2G | 美国 | 90×144 |
| IPSL-CM5A-LR | 法国 | 96×96 |
| MIROC-ESM | 日本 | 64×128 |
| MPI-ESM-MR | 德国 | 96×192 |
2.2 方法介绍
2.2.1 2 ℃温升时间的确定
2.2.2 线性回归
3 2 ℃温升背景下高原植被对变暖的响应
3.1 叶面积指数、 植被储碳量的变化
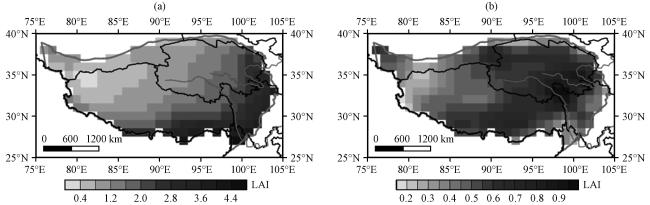
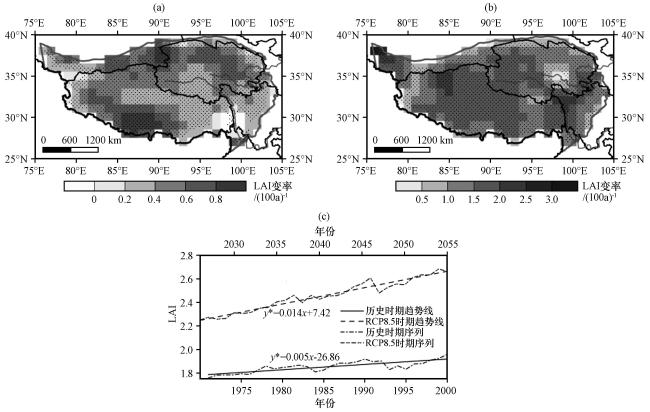
图2 历史时期(a)和2 ℃温升期(b)LAI变率[单位: (100a)-1]及高原区域平均LAI的时间序列(c)图(a)和(b)中打点区域为变化率通过95%信度检验的区域; 图(c)中加*号表示变率通过了95%的信度检验 Fig.2 LAI variability [unit: (100a)-1] during historical period (a) and 2 ℃ global warming (b), and region-averaged LAI time series over the Qinghai-Xizang Plateau (QXP) (c).Areas with dots in Fig.2(a) and (b) are values passing by the 95% confidence level.Trend lines with * in Fig.2(c) represent variability passing by the 95% confidence level |
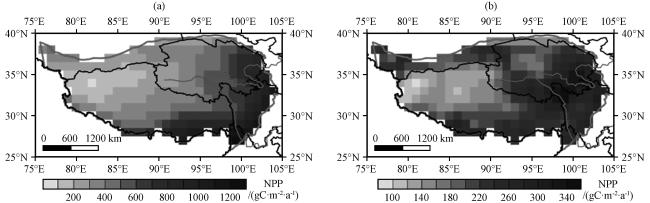
图3 NPP历史时期(1971 -2000年)空间分布(a)及其与2 ℃温升期(2026 -2055年)空间分布差异(b)(单位: gC·m-2·a-1)Fig.3 Spatial distribution of NPP during historical period (from 1971 to 2000) (a) and difference [(2026 -2055) minus(1971 -2000)] between historical period and 2 ℃ global warming (from 2026 to 2055) (b).Unit: gC·m-2·a-1 |
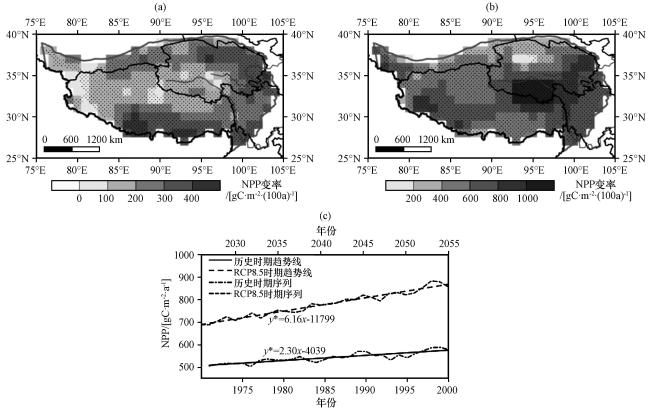
图4 历史时期(a)和2 ℃温升期(b)NPP变率[单位: gC·m-2·(100a-1)]及高原区域平均的NPP时间序列(c)图(a)和(b)中打点区域为变率通过95%信度检验的区域; 图(c)中加*号表示变化趋势通过了95%的信度检验 Fig.4 NPP variability [unit: gC·m-2·(100a-1)] during historical period (a) and 2 ℃ global warming (b), and region-averaged NPP time series over the QXP (c).Areas with dots in Fig.4(a) and (b) are values passing by the 95% confidence levelTrend lines with * in Fig.4(c) represent variability passing by the 95% confidence level |
3.2 主要下垫面类型覆盖率变化
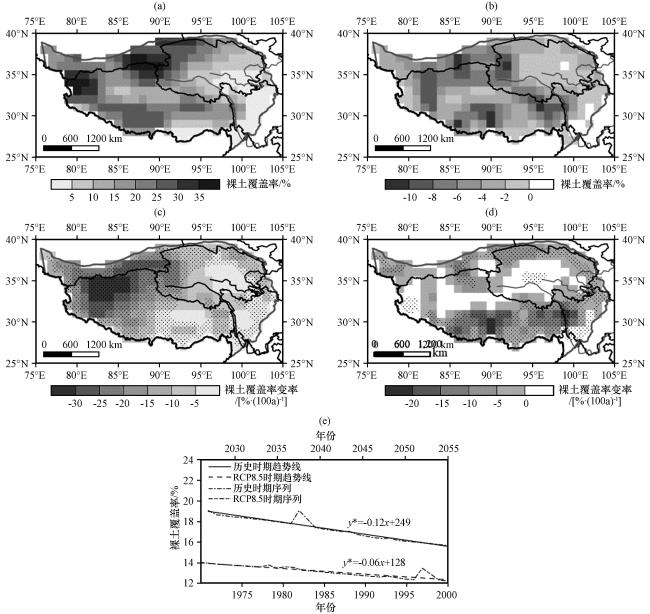
图5 裸土覆盖率历史时期空间分布(a)和变化[(2026 -2055)减(1971 -2000)] (b) (单位: %), 历史参考期(c)和2 ℃温升期(d)覆盖率变率(线性趋势)的空间分布[单位: %·(100a)-1]及高原区域平均的时间序列(e)Fig.5 Spatial distribution of bare ground coverage fraction (unit: %) during historical period (a) and its changes [(2026 -2055) minus (1971 -2000)] (b), and distribution of fraction variability (linear trend)[unit: %·(100a)-1] during historical period (c) and 2 ℃ global warming (d), and region-averaged time series over the QXP (e) |
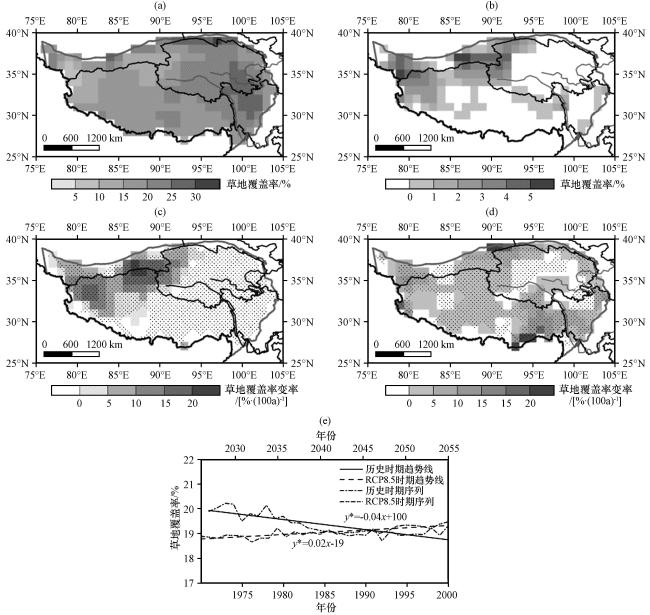
图6 草地覆盖率历史时期的空间分布(a)和变化[(2026 -2055)减(1971 -2000)] (b)(单位: %)历史参考期(c)和2 ℃温升期(d)覆盖率变化率的空间分布[单位: %·(100a)-1]及高原区域平均时间序列(e)Fig.6 Spatial distribution of grass coverage fraction (unit: %) during historical period (a) and its changes [(2026 -2055) minus (1971 -2000)] (b), distribution of fraction variability[unit: %·(100a)-1] during historical period (c) and 2 ℃ global warming (d), and region-averaged fraction time series over the QXP(e) |
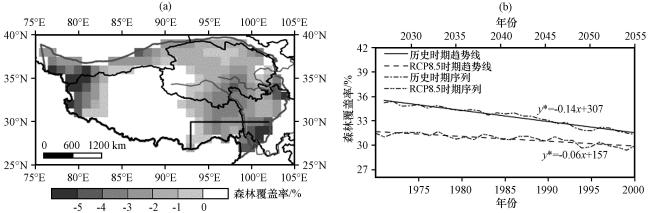
图7 历史时期与2 ℃温升期森林覆盖率的空间分布变化[(2026 -2055) -(1971 -2000)](a, 单位: %)和高原区域平均的森林覆盖率时间序列(b)图(a)中右下角的黑框为实际的森林覆盖区(王青霞等, 2014) Fig.7 Difference of spatial distribution of forest coverage fraction between historical period and 2 ℃ global warming[(2026 -2055) -(1971 -2000)] (a, unit: %), and region-averaged fraction time series over the forest-covered area (b) over the QXP.The square at the bottom right corner in Fig.7(a) is real forest-covered area (from Wang et al, 2014) |
4 高原植被对气候因子的敏感性分析
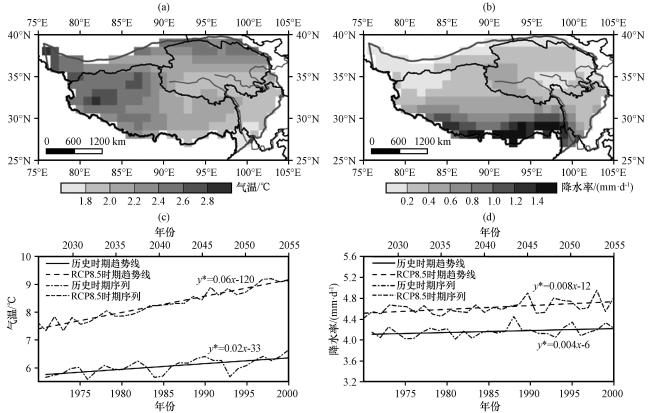


图8 历史时期与2 ℃温升期气温(a, 单位: ℃)和降水率(b, 单位: mm·d-1)的变化[(2026 -2055)减(1971 -2000)]及高原区域平均气温(c)、 降水率(d)的时间序列Fig.8 Changes of air surface temperature (a, unit: ℃) and precipitation (b, unit: mm·d-1)[(2026 -2055) minus (1971 -2000)], and region-averaged time series of air surface temperature (c) and precipitation rate (d) between historical period and 2 ℃ global warming |