1 引言
2 数据来源与方法介绍
2.1 数据来源
表1 第六次国际耦合模式比较计划(CMIP6)中25个地球气候系统模式基本信息Table 1 Basic information on the 25 Earth-Climate SystemModels in the Coupled Model Intercomparison Project Sixth Phase (CMIP6) |
| 序号 | 模式名称 | 所属国家 | 研发机构简称 | 模式分辨率 (经向×纬向) |
|---|---|---|---|---|
| A | ACCESS-CM2 | 澳大利亚 | CSIRO-ARCCSS | 1.875°×1.25° |
| B | ACCESS-ESM1-5 | 澳大利亚 | CSIRO | 1.875°×1.25° |
| C | AWI-CM-1-1-MR | 德国 | AWI | 0.94°×0.93° |
| D | BCC-CSM2-MR | 中国 | BCC | 1.12°×1.12° |
| E | CAMS-CSM1-0 | 中国 | CAMS | 1.12°×1.12° |
| F | CESM2-WACCM | 美国 | NCAR | 1.25°×0.9° |
| G | CMCC-CM2-SR5 | 意大利 | CMCC | 1.12°×1.12° |
| H | CanESM5 | 加拿大 | CCCma | 2.81°×2.77° |
| I | EC-Earth3-Veg | 欧洲 | EC-Earth-Cons | 0.7°×0.7° |
| J | EC-Earth3 | 欧洲 | EC-Earth-Cons | 0.7°×0.7° |
| K | FGOALS-f3-L | 中国 | CAS | 1.25°×1° |
| L | FGOALS-g3 | 中国 | CAS | 2°×2.02° |
| M | GFDL-ESM4 | 美国 | NOAA-GFDL | 1.25°×1° |
| N | IITM-ESM | 印度 | CCCR-IITM | 1.88°×1.91° |
| O | INM-CM4-8 | 俄罗斯 | INM | 2°×1.5° |
| P | INM-CM5-0 | 俄罗斯 | INM | 2°×1.5° |
| Q | IPSL-CM6A-LR | 法国 | IPSL | 2.5°×1.27° |
| R | KACE-1-0-G | 韩国 | NIMS-KMA | 1.875°×1.25° |
| S | MIROC6 | 日本 | MIROC | 1.4°×1.4° |
| T | MPI-ESM1-2-HR | 德国 | DKRZ | 0.94°×0.93° |
| U | MPI-ESM1-2-LR | 德国 | MPI-M | 1.875°×1.875° |
| V | MRI-ESM2-0 | 日本 | MRI | 1.12°×1.12° |
| W | NESM3 | 中国 | NUIST | 1.88°×1.88° |
| X | NorESM2-LM | 挪威 | NCC | 2.5°×1.89° |
| Y | NorESM2-MM | 挪威 | NCC | 1.25°×0.94° |
表2 情景模式比较计划中未来时段试验情景描述Table 2 ScenarioMIP experiment scenario descriptions in future period |
| 情景 | 辐射强迫类型 | 2100年辐射强迫 /(W·m-2) | SSP | 情景描述 |
|---|---|---|---|---|
| SSP1-2.6 | 低 | 2.6 | 1可持续发展 | 代表低脆弱性、 低减缓压力和低辐射强迫的综合影响 |
| SSP2-4.5 | 中 | 4.5 | 2中度发展 | 代表中等社会脆弱性与中等辐射强迫的组合 |
| SSP3-7.0 | 高 | 7.0 | 3局部发展 | 代表相对较高社会脆弱性与人为辐射强迫的组合 |
| SSP5-8.5 | 高 | 8.5 | 5常规发展 | 唯一一个排放高到足以在2100年产生8.5 W·m-2辐射强迫的排放情景 |
2.2 研究方法
3 结果分析
3.1 模式对青藏高原降水模拟能力评估
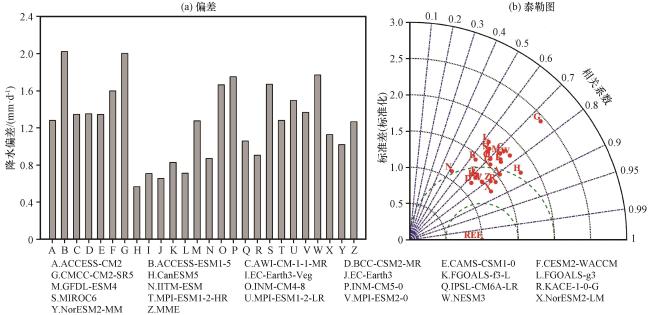
图2 CMIP6模式模拟的青藏高原1961 -2014年年均降水与观测数据之间的偏差(a)以及泰勒图(b)REF代表观测, MME是多模式集合平均Fig.2 Bias (a) and Taylor diagram (b) in simulating precipitation between individual models in CMIP6 and observational data over the Qinghai-Xizang Plateau during 1961 -2014.REF represents the observations, MME represents the multi-model ensemble mean |
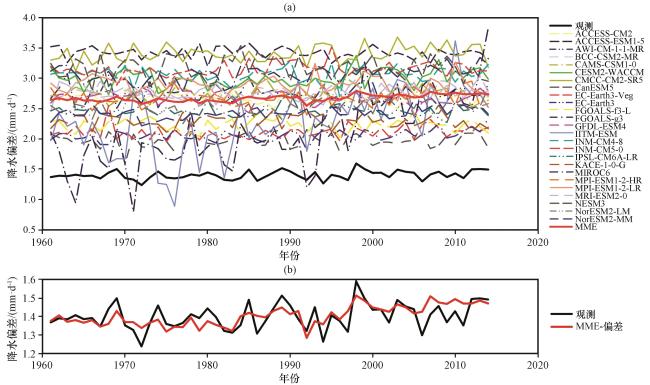
图3 CMIP6模式模拟的青藏高原1961 -2014年年均降水和观测降水的时间序列(a)以及偏差移除后的多模式集合平均与观测数据的趋势比较(b)Fig.3 Time series of annual mean precipitation in observational data and individual CMIP6 models over the Qinghai-Xizang Plateau during 1961-2014 (a) and trend comparison between multi-model ensemble mean after the bias was removed and the observational data (b) |
3.2 2015-2099年青藏高原降水变化特征
3.2.1 降水的年际变化
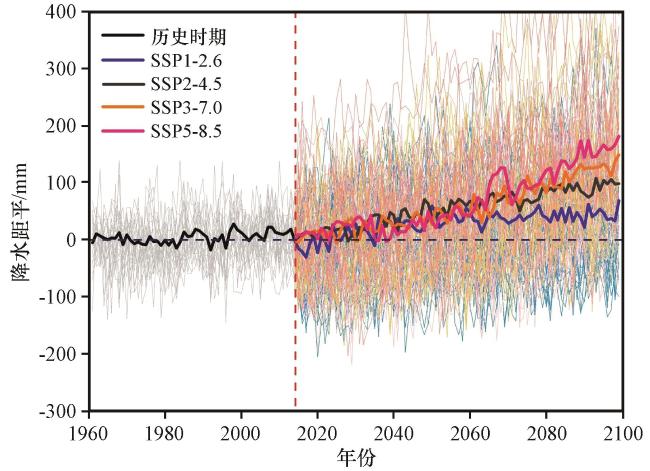
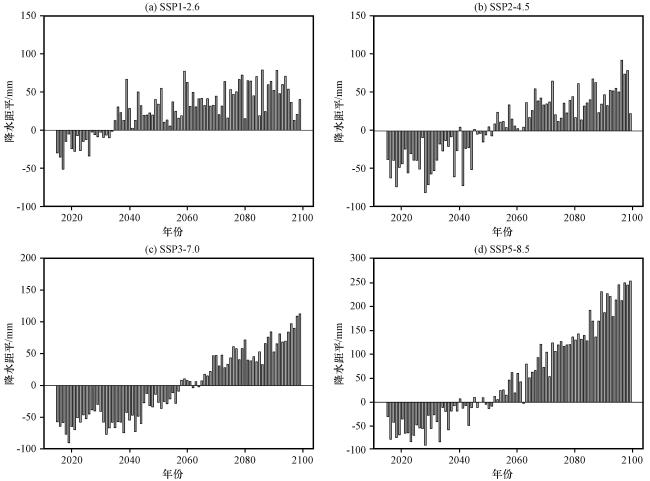
图4 25个模式及多模式集合平均模拟的青藏高原在不同情景下1961 -2099年年降水量变化趋势(距平值相对于1995 -2014年参考时段)Fig.4 Annual mean precipitation changes of the Qinghai-Xizang Plateau from 25 CMIP6 models and their multi-model ensemble mean during 1961 -2099 under different SSP scenarios (the anomaly is relative to 1995 -2014) |
3.2.2 降水变化趋势空间特征
3.2.3 不同时期降水增幅的变化特征
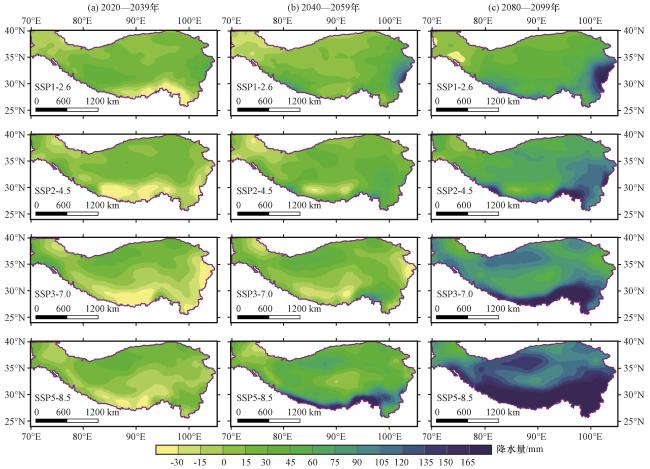
图6 相对于1995 -2014年参考时段, 多模式集合平均预估的不同情景下青藏高原未来年降水在近期(a, 2020 -2039年)、 中期(b, 2040 -2059年)和末期(c, 2080 -2099年)的空间变化Fig.6 Spatial distribution of the annual precipitation by multi-model ensemble mean projections under different SSP scenarios during the near-term (a, 2020 -2039), mid-term (b, 2040 -2059) and long-term (c, 2080 -2099) over the Qinghai-Xizang Plateau relative to 1995 -2014 |