

1 引言
2 资料来源和方法介绍
2.1 资料来源
2.2 方法简介
3 结果分析
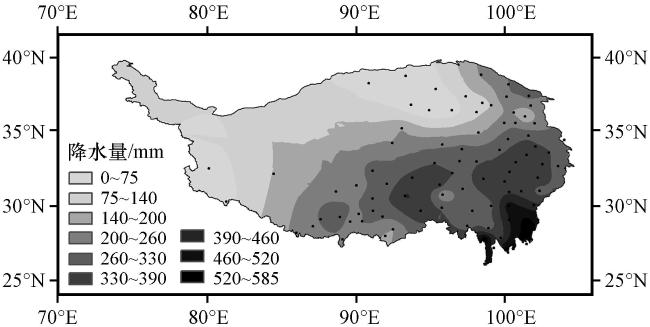
3.1 夏季高原降水的时空分布
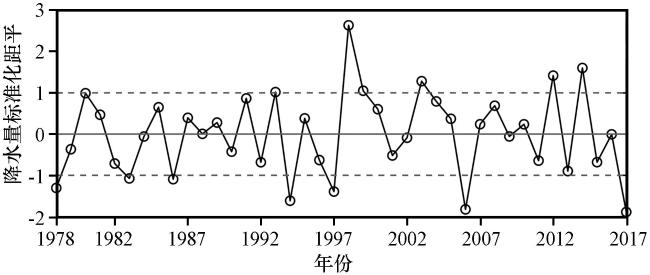
3.2 旱涝年高原夏季降水的周期特征
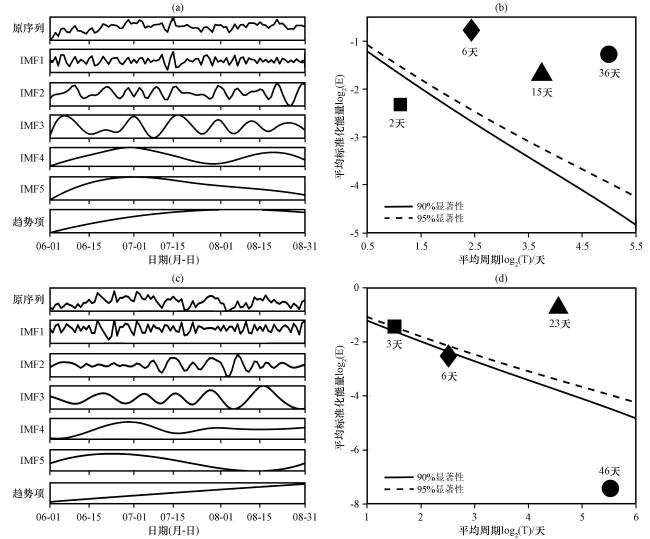
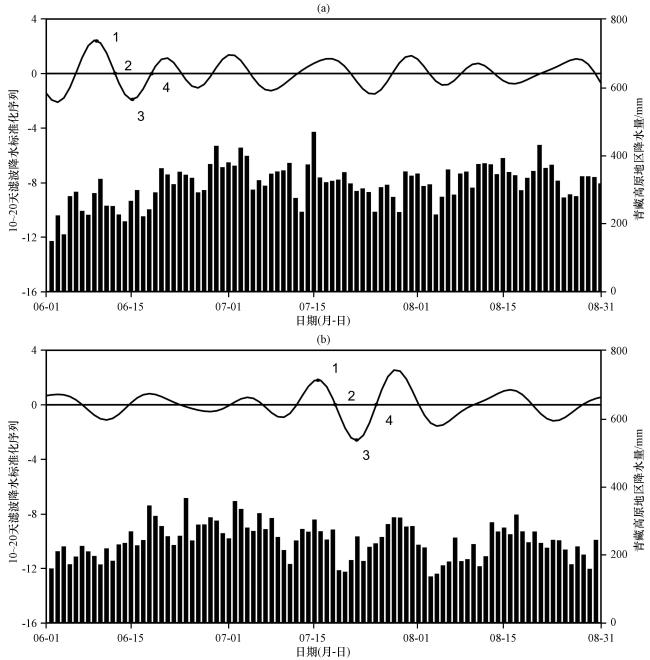
图4 涝年(a)和旱年(b)夏季高原地区降水量(柱状图)及其10~20天振荡成分(波浪线)变化降水量为高原站点总降水量Fig.4 Precipitation (bar chart) and its 10~20 day oscillation component (wavy line) changes in summer during flood years (a) and drought years (b) over the Qinghai-Xizang Plateau.The precipitation is the total daily precipitation of the stations on the Qinghai-Xizang Plateau |
3.3 旱涝年高原降水高低空低频环流特征
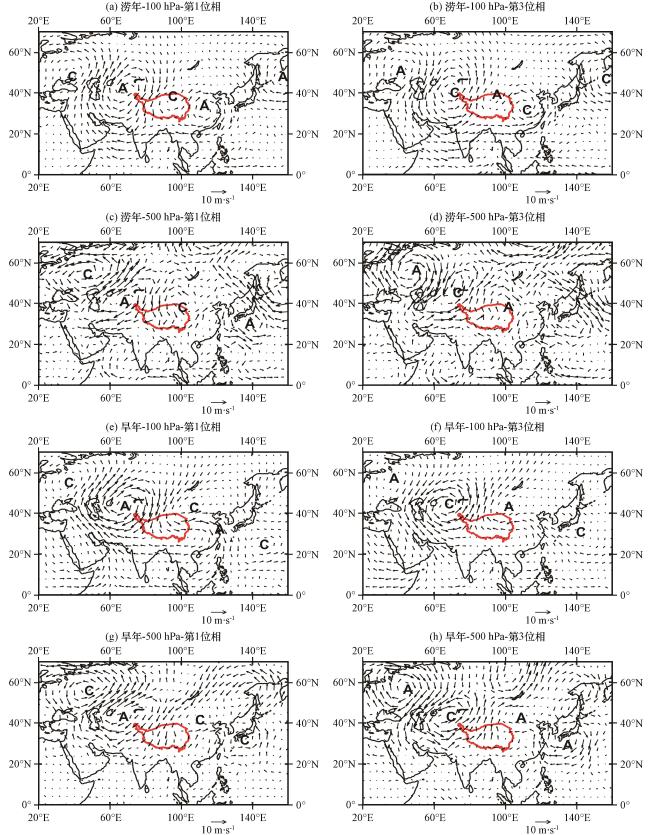
图5 涝年(a~d)和旱年(e~h)高原地区夏季低频降水过程强弱位相100 hPa、 500 hPa低频风场(矢量, 单位: m·s-1)红线区域为青藏高原地区, A和C分别表示气旋和反气旋Fig.5 Low frequency precipitation process of flood years (a~d) and drought years (e~h) with low frequency wind field (vector, unit: m·s-1) on 100 hPa and 500 hPa over the Qinghai-Xizang Plateau in summer.The red line indicates the Qinghai-Xizang Plateau area.The letters A and C stand for cyclone and anticycle, respectively |
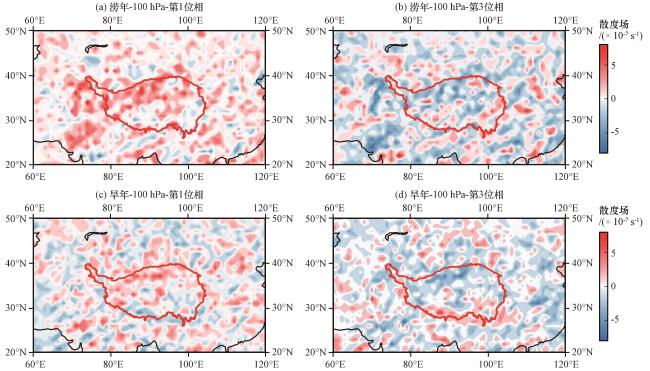
图6 涝年(a, b)和旱年(c, d)高原地区夏季低频降水过程强弱位相500 hPa低频散度场(彩色区, 单位: ×10-7 s-1)的空间分布 红线区域为高原地区Fig.6 Distribution of low frequency divergence field (color area, unit: ×10-7 s-1) on 500 hPa in the strong and weak phases of low frequency precipitation in summer of flood years (a, b) and drought years (c, d) over the Qinghai-Xizang Plateau.The red line indicates the Qinghai-Xizang Plateau area |
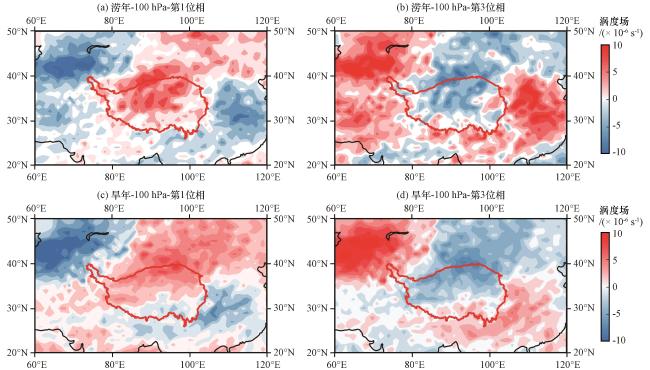
图7 涝年(a, b)和旱年(c, d)高原地区夏季低频降水过程强弱位相500 hPa低频涡度场(彩色区, 单位: ×10-6 s-1)的空间分布 红线区域为高原地区Fig.7 Distribution of low frequency vorticity field (color area, unit: ×10-6 s-1) on 500 hPa in the strong and weak phases of low frequency precipitation in summer of flood years (a, b) and drought years (c, d) over the Qinghai-Xizang Plateau.The red line indicates the Qinghai-Xizang Plateau area |
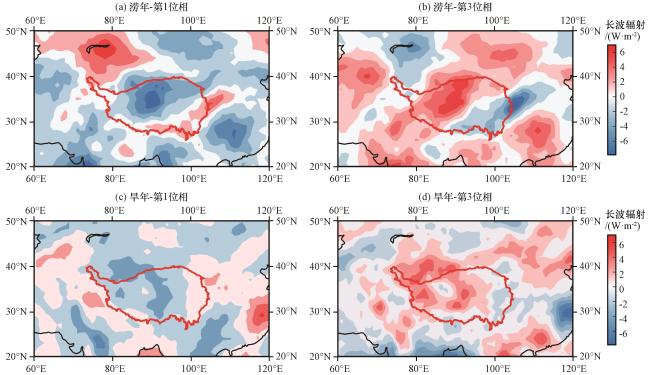
图8 涝年(a, b)和旱年(c, d)夏季低频降水过程强弱位相500 hPa低频射出长波辐射场(彩色区, 单位: W·m-2)的空间分布 红线区域为高原地区Fig.8 Distribution of Low-frequency outgoing longwave radiation field (color area, unit: W·m-2) on 500 hPa at strong and weak phase during low-frequency precipitation in summer of flood years (a, b) and drought years (c, d).The red line indicates the Qinghai-Xizang Plateau area |
3.4 旱涝年高原低频振荡传播特征
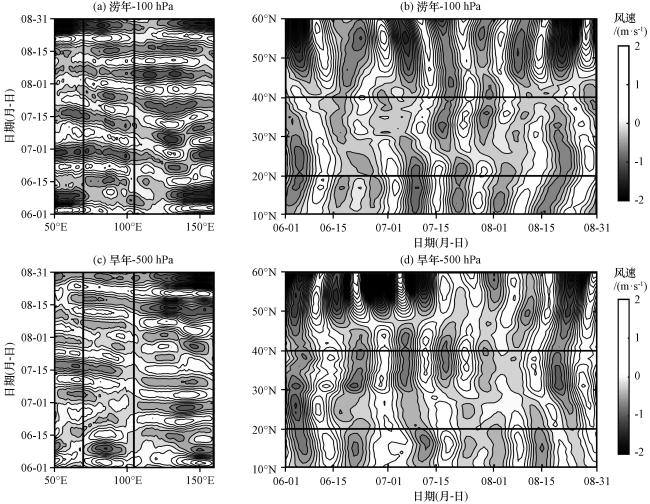
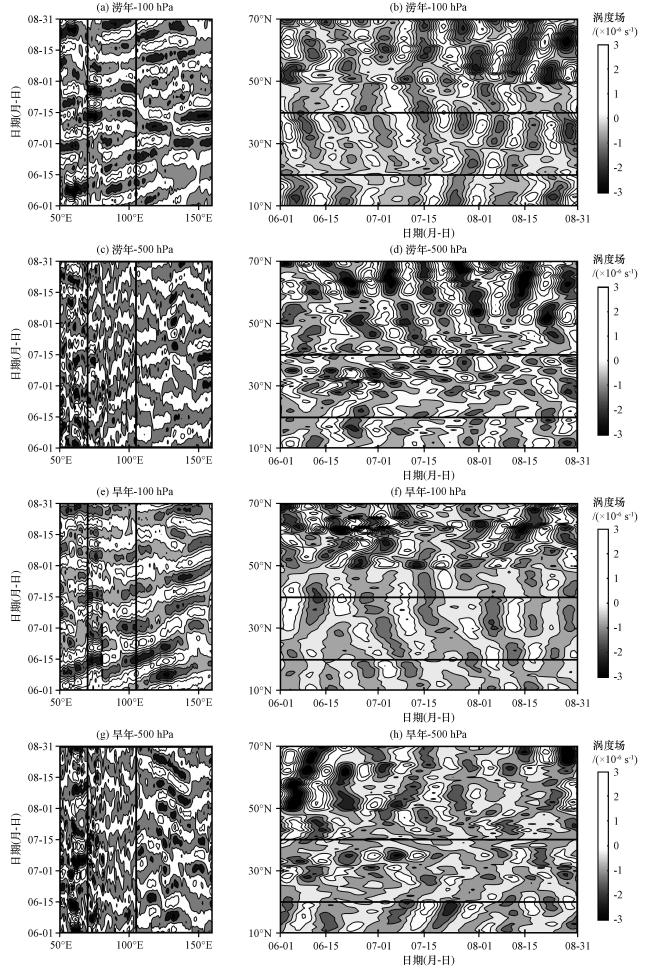


图10 涝年(a~d)和旱年(e~h)高原地区夏季低频降水过程100 hPa(a, b, e, f)、 500 hPa(c, d, g, h)低频涡度场的时间剖面(单位: ×10-6 s-1)Fig.10 Time profiles of low-frequency vorticity field on 100 hPa (a, b, e, f) and 500 hPa (c, d, g, h) of the low-frequency precipitation process in summer of flood years (a~d) and drought years (e~h) over the Qinghai-Xizang Plateau.Unit: ×10-6 s-1 |