

1 引言
地表植被是生物圈和大气圈相互作用的重要纽带(Rohatyn et al, 2021)。森林生态系统占陆地总面积的1/3, 它通过吸收大气二氧化碳的生物化学过程 (biochemical processes)和调节陆-气之间能量、 水分交换的生物物理过程(biophysical processes), 对地球气候系统产生重要的影响。与生物化学过程的降温效应相比, 森林生态系统的生物物理过程具有很强的局地效应, 即森林增降温效应(郭飞等, 2021; 赵倩倩等, 2021)。此外, 森林与当地居民的生态福祉、 生物多样性的保护及林业管理等密切相关。因此, 厘清森林生态系统生物物理过程对气候的影响机制, 不仅对制定合理的气候应对政策具有重要的理论价值, 也对实现森林服务功能的最优化具有指导作用。
在过去的20多年里, 关于森林生态系统的生物物理过程对气候的影响研究主要集中在热带、 温带和极地地区(Bonan, 2008; Betts, 2000; Lee et al, 2011; Peng et al, 2014; Wang et al, 2018)。例如, 地表反照率的降低对极地森林生态系统起升温作用(Bonan, 2008; Betts, 2000); 而热带雨林强烈的蒸发作用则起到地表降温作用(Lawrence and Vandecar, 2015; Li et al, 2022)。干旱区约占全球陆地总面积的40%, 这里生态系统脆弱, 是对气候变化和人类活动最为敏感的陆地生态系统之一(王宇轩等, 2021)。但是, 干旱区植被变化将如何影响局地气候还存在很大的不确定性(Alkama and Cescatti, 2016), 也缺乏直接野外观测数据(Rotenberg and Yakir, 2010; Su et al, 2023)。此外, 为了缓解气候变暖, 很多国家和地区进行了大量的旱地造林活动(Goffner et al, 2019; Rohatyn et al, 2022)。但在不同纬度、 水分状况和植被类型条件下, 造林对局地气候的影响也会随着这些情况的变化而产生差异(孙舒轻, 2021; 狄文丽, 2022)。因此, 河岸林生态系统如何影响地表温度?西北干旱区是否适合大规模造林活动?还需要进行科学评价。
在本研究中, 以西北干旱区内陆河典型河岸林生态系统和周围荒漠为对照实验样地, 利用野外直接观测数据和温度分解方法(Decomposed Temperature Metric, DTM), 系统分析了河岸林生态系统对局地温度的影响, 并分析不同生物物理因素对温度差异的影响机制。该研究不仅有助于提升我们对干旱生态系统与气候相互作用的认识, 也对合理评估干旱生态系统的生态服务功能具有重要的作用。
2 数据来源与方法介绍
2.1 研究区概况
研究区位于黑河下游的额济纳旗, 该地区深居欧亚大陆腹地, 昼夜温差大且风沙多, 是典型的大陆性气候。多年平均气温8.2 ℃, 极端最低温度-37.6 ℃, 极端最高温达43.1 ℃(Si et al, 2015); 多年平均降雨量仅为42 mm, 而潜在蒸发量高达2241 mm, 为降雨量的50多倍(Su et al, 2022), 是中国最干旱的地区之一(司建华等, 2007)。
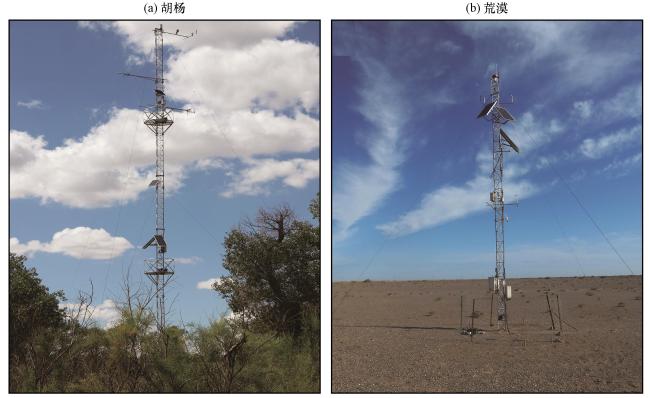
试验点位于额济纳胡杨林自然保护区(101.14°E, 42.00°N; 海拔874 m)和绿洲外围的荒漠(100.99°E, 42.11°N; 海拔1054 m) (图1 )。胡杨站点位于河道附近, 地下水埋深在2 m左右, 河流补给的地下水是维持胡杨群落稳定的主要水分来源。土壤类型为灰棕漠土、 林灌草甸土, 土壤质地较粗(刘蔚等, 2005)。观测点胡杨群落组成结构简单, 乔木层主要是以胡杨(Populus euphratica Oliv)为主, 伴生有柽柳(Tamarix ramosissima), 林下植被主要为苦豆子(So‐phana alopecuroides)、 甘草(Glyc yrrhizauralensis)等荒漠化或盐渍化多年生植物(罗欢等, 2020)。荒漠站点地势平坦, 地表为粗沙和小颗粒卵石, 零星分布着红砂 (Reaumuria soongorica) 、 沙蒿(Artemisia sp.)等耐旱性杂草。地下水位埋深大于4 m, 荒漠植被主要依赖大气降水和凝结水。
2.2 数据来源和仪器介绍
本研究实验数据来自“黑河流域生态-水文过程综合遥感观测联合试验”(Li et al, 2013), 可从国家青藏高原科学数据中心获取(http: //tpdc.ac.cn)。选取2016年观测的气象要素(包括四分量辐射、 净辐射、 土壤热通量)和涡度通量(感热、 潜热)进行分析。实验所采用的主要仪器、 观测高度如表1 所示。具体数据处理和质量控制可参考有关文献(李新等, 2012; 徐自为等, 2020)。利用观测得到的向上/向下长波辐射, 可获得不同下垫面的地表温度:
式中: 为地表温度(单位: K); 为向上长波辐射(单位: W·m-2); 为向下长波辐射(单位: W·m-2); 为地表发射率(本文取0.98); 为Stephan-Boltzmann常数,取值为5.67×10⁻⁸ W·m-2·K-4。地表反照率是地表能量平衡的关键组分, 其计算公式为:
式中: 为地表反照率; 为向下短波辐射(单位: W·m-2); K↑为向上的短波辐射(单位: W·m-2)。
表1 额济纳胡杨和荒漠站点观测变量所采用的仪器和观测高度Table 1 Detailed information of instrument and observation height at the forest and desert sites |
| 观测变量 | 胡杨站点 | 荒漠站点 | |||
|---|---|---|---|---|---|
| 仪器型号 | 高度/m | 仪器型号 | 高度/m | ||
| 感热/潜热通量 | Campbell & Li-Cor, USA | 28 | Campbell & Li-Cor, USA | 4.7 | |
| 四分量辐射/净辐射 | CNR4, Kipp & Zonen, Netherland | 24 | CNR1, Kipp & Zonen, Netherland | 6 | |
| 土壤热通量 | HFP01, Hukseflux, Netherland | 0.06 | HFT3, Campbell, USA | 0.06 | |
2.3 温度分解方法(DTM)
在DTM方法中, 地表能量平衡方程表述为:
式中: R n为地表净辐射(单位: W·m-2); S为净短波辐射(单位: W·m-2); H为感热通量(单位: W·m-2); LE为潜热通量(单位: W·m-2); G为地表热通量(单位: W·m-2); I为能量不平衡项(单位: W·m-2), 其他符号意义与公式(1) 一致。其中, 净短波辐射的计算公式为 。
忽略地表发射率(ɛ)的差异, 对方程(1)两边求一阶导数可以得到不同下垫面的温度差异(Juang et al, 2007; Luyssaert et al, 2014):
式中: 表示相关变量( )在不同下垫面之间的差异(即森林减去荒漠的差值, 单位: W·m-2)。方程右边各项分别代表由净短波辐射(S)、 向下长波辐射( )、 感热(H)、 潜热(LE)、 地表热通量(G)和能量不平衡(I)引起的冠层温度差异。
3 结果分析
3.1 能量收支分量和水热通量的季节变化特征
首先, 下垫面的变化导致地表反照率(α)存在明显差异[图2 (a)]。河岸林冠层的地表反照率要明显低于荒漠, 尤其是地表有积雪影响的冬季(Δα的年平均值为-0.08; 变化范围为-0.15~-0.05)。其次, 河岸林和荒漠的净地表短波辐射(S)的季节变化特征一致, 呈钟型分布, 但河岸林冠层的净地表短波辐射显著高于周围荒漠(ΔS的年平均值为13.8 W·m-2; 变化范围为7.27~18.3 W·m-2)[图2 (b)]。另外, 观测结果还表明河岸林冠层和荒漠的向下长波辐射(L↓)的季节变化特征也是一致的, 且都在夏季达到最大, 但河岸林的向下长波辐射要高于荒漠(ΔL↓的变化范围为10.9~17.0 W·m-2, 均值为14 W·m-2)[图2 (c)]。由于这些能量分量的差异, 河岸林冠层吸收的净辐射(Rn )要显著高于荒漠(ΔRn 变化范围为21.8~49.7 W·m-2; 年平均值为35.4 W·m-2)[图2 (d)]。
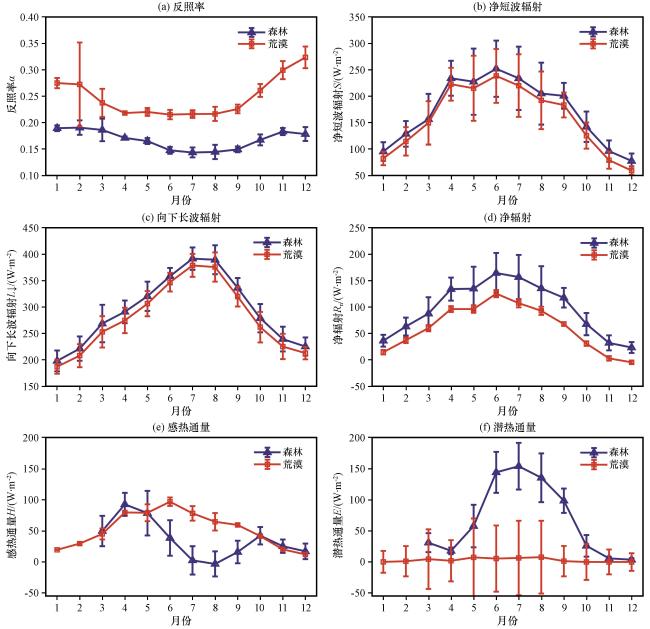
图2 不同下垫面观测变量反照率(a), 净短波辐射(b), 向下长波辐射(c), 净辐射(d), 感热通量(e), 潜热通量(f)的季节变化特征Fig.2 Annual patterns in albedo (a), net shortwave radiation (b), downward longwave radiation (c), net radiation (d), sensible heat flux (e), and latent heat flux (f) at the forest and desert site.These monthly means were calculated based in 0.5-hour values from eddy covariance and hydro-meteorological measurements |
水热通量的季节变化特征如图2 (e)~(f)所示。总的来说, 河岸林生态系统的感热(H)、 潜热(LE)的季节变化特征与荒漠具有明显差异[图2 (e), (f)]。从6 -9月, 河岸林生态系统的潜热显著超过感热, 且明显上升, 而感热明显下降。因此, 河岸林的净辐射(Rn )主要被潜热(LE)所消耗(LE/Rn >90%)。对于荒漠生态系统, 潜热随季节变化无明显波动且数值较小, 感热通量一直超过潜热, 并且在3 -9月明显上升。荒漠的净辐射(Rn )主要被感热(H)所消耗(H/Rn >70%)。在不同下垫面上, 感热(H)和潜热(LE)是主要能量消耗方式, 而土壤热通量占比小于10%。
3.2 河岸林生态对地表温度的影响及原因
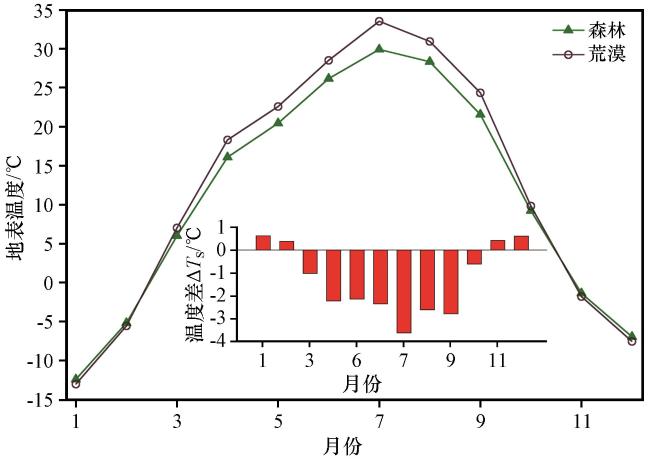
图3 胡杨冠层温度、 荒漠地表温度季节变化特征, 及二者差异差异(胡杨-荒漠, ΔT s)的季节变化特征Fig.3 Annual patterns in surface temperature (T s) at the two sited.The inset plot showed the temperature difference between the two sites (ΔT s) with positive (negative) values indicating warmer (cooler) temperatures at the forest site compared to the background desert |
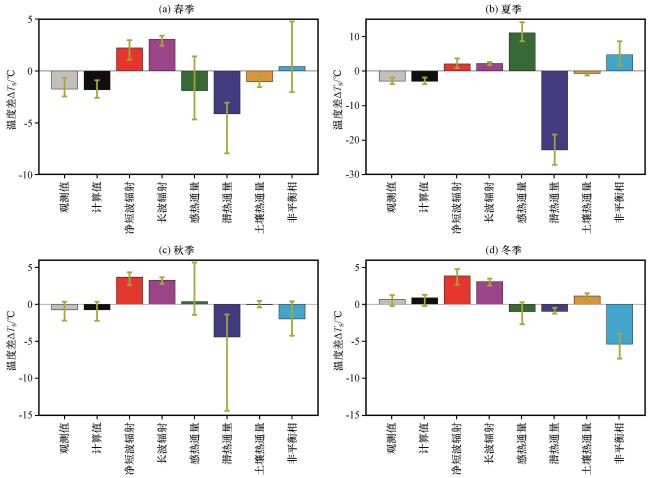
进一步利用DTM方法对不同生物物理因素对地表温度差异(ΔT s)的影响机制进行了分析。总体上, DTM方法计算的地表温度差异与观测值基本一致(图4 )。DTM结果表明, 在春季, 潜热(LE)、 感热(H)和土壤热通量(G)分别造成了河岸林冠层温度下降了约-4.0 ℃、 -2.0 ℃ 和-1 ℃; 净短波辐射(S)和向下长波辐射(L↓)分别引起河岸林温度升高了3 ℃ 和2.2 ℃。在夏季, 河岸林生态系统的高潜热通量(LE)导致森林冠层温度降低-23 ℃左右; 而造成河岸林冠层温度升高的主要原因是感热(H)、 净地表短波辐射(S)和向下长波辐射(L↓)的增加, 其贡献分别为12 ℃、 3.0 ℃和2.0 ℃左右[图4 (b)]。在秋季, 潜热通量(LE)引起河岸林冠层温度下降了-5 ℃, 而净短波辐射(S)和向下长波辐射(L↓)分别造成了河岸林温度上升4.0 ℃和3.5 ℃左右。在冬季, 河岸林冠层温度高于荒漠的主要由净地表短波辐射(S)和向下长波辐射(L↓)的增加而造成的, 它们分别引起河岸林冠层温度升高了3~4 ℃; 而导致河岸林冠层温度低于荒漠的主要原因是感热(H)和潜热(LE)的差异, 其贡献分别为-1.0 ℃和-0.9 ℃[图4 (d)]。


4 讨论
4.1 河岸林生态系统对地表能量分配的影响
地表反照率决定了物体表面吸收的太阳辐射。由于河岸林森林冠层的颜色比荒漠深, 且具有较高的粗糙度, 使得河岸林的地表反照率明显低于荒漠。因此, 河岸林相对较低的地表反照率使得其冠层获得的净地表短波辐射显著高于周围荒漠。Rotenberg and Yakir (2010)的研究也发现了植树活动导致地表反照率增加, 使得森林冠层净短波辐射增加了大约24 W·m-2。另外, 我们观测发现河岸林冠层向下长波辐射要高于荒漠, 说明河岸林生态系统对大气背景产生了一定的影响 (冯起等, 2006)。类似的观测现象在其他研究中也有所报道(Broucke et al, 2015; Wang et al, 2018)。这可能是由于植被蒸腾作用导致森林冠层上方的水汽浓度比较高; 而水汽作为主要的温室气体, 可以显著提高对长波辐射的吸收率(Christy et al, 2006)。在本研究, 由于缺乏直接的大气水汽垂直梯度观测, 这种下垫面变化对近地面的影响还需要进一步的实验予以确认。
受地表反照率、 向下长波辐射和短波辐射的共同影响, 河岸林冠层吸收的净辐射(Rn )要显著高于荒漠。类似地, Rotenberg and Yakir (2010)也报道过反照率的下降和向下长波辐射的增加是造成以色列干旱森林生态系统净辐射增加的主要因。但需要指出的是: 这种净辐射的增加并不一定会导致森林冠层温度高于荒漠, 下垫面温度的变化还要受到感热、 潜热分配的影响。在植物生长季节(如从6 -9月), 河岸林生态系统在发达根系的帮助下, 可以充分吸收地下水, 以满足蒸发潜力的需求(李建林等, 2008; Su et al, 2022), 使得河岸林的净辐射主要被潜热消耗(LE/Rn >90%)。与此相反, 由于地下水位深、 土壤水分低、 植被稀疏, 荒漠的净辐射主要被感热所消耗(H/Rn >70%)。Xu et al (2020)报道了在黑河流域不同下垫面的能量消耗方法, 与本研究所得的结果一致。
因此, 为了维护下游河岸林生态系统的服务功能, 需要地下水位维持在合理的范围内, 以保证植被正常生长需求(冯起等, 2006; 陈亚宁等, 2019; Rohde et al, 2021)。在过去的几十年, 随着中上游用水量的增加, 黑河下游的额济纳地区来水量逐年减少, 导致地下水位下降, 胡杨林大面积退化(冯起等, 2006; 李建林等, 2008; 刘树宝等, 2016)。自2000年以后, 黑河流域实施的分水计划使得下游的地下水位普遍抬升, 河岸林生态系统呈现好转趋势(Su et al, 2022)。因此, 需要进一步加强内陆河流域经济-生态-水之间相互作用关系的研究, 协调好流域上中下游的生产、 生活和生态用水量。这不仅对河岸林生态系统的保护和恢复具有重要的指导作用, 也是实现干旱区社会经济的可持续发展的关键。
4.2 河岸林生态系统对地表温度的影响
在本研究中, 我们发现河岸林整体上表现为降温效应, 但存在明显的季节非对称性, 即从11月到次年2月, 为弱的增温效应; 从3 -10月, 为显著的降温效应。该结果与前期研究一致。如, Lee et al (2011)报道45°N以南的森林生态系统在1月份表现为增温效应, 而6月份则为弱的降温效应; Alkama and Cescatti (2016)基于卫星遥感提取的地表辐射温度数据, 发现北半球中高纬度的森林在冬季为增温效应, 而在夏季为降温效应。
进一步利用DTM方法对各个生物物理因素(反照率、 长波辐射、 潜热和感热等)对温度影响进行了深入分析。在春季, 河岸林进入生长季, 植被能够以较高的速率进行蒸腾作用, 蒸散发的增加导致的降温效应高于反照率低带来的增温效应, 河岸林表现为降温效应。在夏季, 植被进入生长旺盛期, 蒸散发的增长产生了显著的降温效应 (Broucke et al, 2015); 而荒漠的净辐射主要被感热消耗, 产生了较大的增温效应。在秋季, 随着河岸林进入生长后期, 植被蒸腾开始下降, 蒸腾降温作用减弱, 但仍高于向下长波辐射和净短波辐射仍表现出增温作用(Wang et al, 2018)。在冬季, 由于高大的树冠结构, 存在雪遮效应, 河岸林冬季地表反照率高于其他季节 (Alkama and Cescatti, 2016)。但是, 冬季干燥寒冷, 限制了植被的蒸散发的降温效应 (狄文丽, 2022)。整体上, 河岸林在冬季表现为增温效应。因此, 在研究陆地生态系统对温度的影响时, 需要考虑季节性差异的影响(王欢欢, 2021; Li et al, 2020)。
需要指出的是, 剩余能量分量(非平衡项)主要受涡度通量的观测误差影响。理论上, 该分项越小越好。但受仪器的系统误差(仪器的安装、 调试以及仪器固有误差相关)和下垫面植被覆盖的空间异质性等的影响, 涡度通量观测普遍存在能量不闭合的情况(Foken et al, 2006; Panin et al, 1998; Mauder et al, 2006)。这使得剩余能量无法达到接近于0的理想情况。前人的研究发现: 非平衡项和其他主要能量分量引起的温度差没有很强的相关性, 说明非平衡项并不会对其他能量分量的结果产生影响(Luyssaert et al, 2014)。在前期研究中, 我们对涡度通量观测数据进行了闭合处理, 所得结论基本一致(Su et al, 2023)。
5 结论
本研究基于野外站点直接观测数据, 通过温度分解方法系统解析了干旱区河岸林生态系统对局地温度的影响机制。结果表明, 河岸林生态系统冠层吸收更多的净辐射, 整体上表现为降温效应(-1.3 ℃), 且不同月份温度变化存在差异。其中, 潜热是导致河岸林冠层温度降低的主要驱动因素, 而地表反照率和下行长波辐射是导致冠层温度升高的主要原因。可见, 河岸林生态系统作为一种独特的下垫面, 在调节干旱区局地气温方面具有重要影响。另外, 在认识河岸林生态系统与大气之间相互作用时, 要综合考虑其季节性, 科学评价干旱区河岸林对地表温度的影响。研究结果可为干旱区河岸林生态系统保护和河岸林生态系统的服务功能评价提供一定参考。