

1 引言
2 天气过程概况
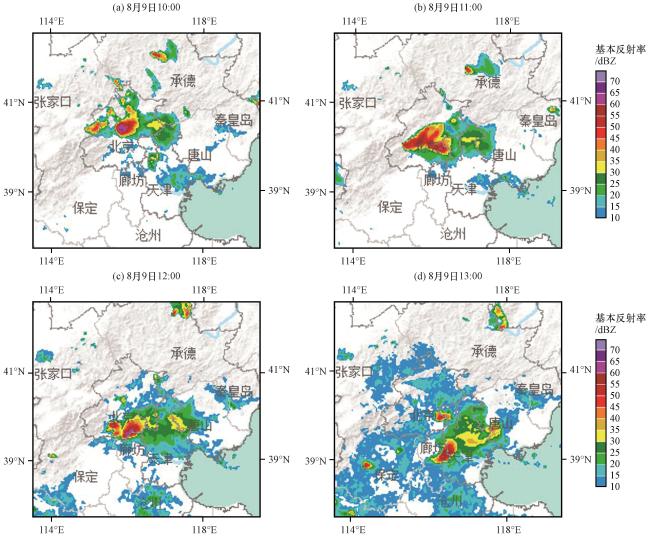
图1 2021年8月9日10:00(a)、 11:00(b)、 12:00(c)、 13:00(d)大兴雷达站的基本反射率(单位: dBZ)图像为来自国家气象科学数据中心的基本反射率图像产品 Fig.1 The basic reflectivity (unit: dBZ) of the DaXing radar station at 10:00 (a), 11:00 (b), 12:00 (c), 13:00 (d) on August 9, 2021.The image comes from the basic reflectance image product of the National Meteorological Science Data Center |
3 环流特征及不同再分析资料的差别
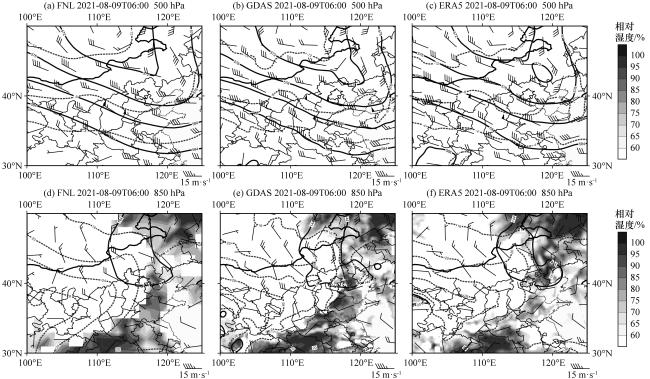
图2 2021年8月9日06:00 FNL(a, d)、 GDAS(b, e)、 ERA-5(c, f)资料500 hPa(a~c)、 850 hPa(d~f)的环流形势实线表示位势高度场(单位: dagpm); 虚线表示温度场(单位: °C); 阴影区表示相对湿度场(单位: %) Fig.2 FNL (a, b), GDAS (b, e), ERA (c, f) data of 500 hPa (a, b, c), 850 hPa (d, e, f) circulation situation at 06:00 on August 9, 2021.The solid line represents the geopotential height field (unit: dagpm); the dashed line represents the temperature field (unit: °C); the shading represents the relative humidity field (unit: %) |
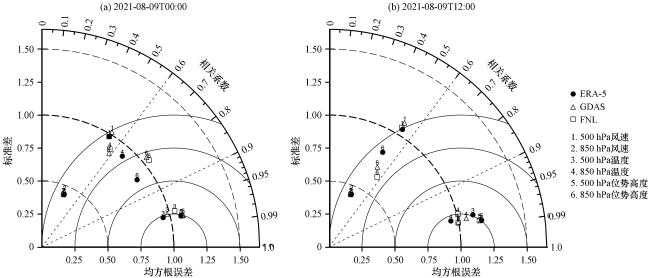
图3 2021年8月9日00:00(a)和12:00(b)初边场资料的泰勒图点到原点的距离代表其相对于观测的标准差, 点在图中方位角的余弦代表其与观测的相关系数, 点到横坐标数值1.0的距离代表均方根误差 Fig.3 Taylor diagram of the initial-boundary data at 00:00 (a) and 12:00 (b) on August 9, 2021.The distance from the point to the origin represents standard deviation to observation, the cosine of the azimuth of the point represents the correlation coefficient with observation, and the distance from the point to 1.0 on the x-axis represents the root mean square error |
4 模式设置及初边界资料简介
表1 试验使用初边界场的情况Table 1 The information of the initial boundary field in each experiment |
| 名称 | 初边场 资料 | 分辨率 | 垂直层数 /层 | 时间间隔 /h |
|---|---|---|---|---|
| FNL_1_6h | FNL | 1°×1° | 34 | 6 |
| GDAS _0.25_6h | GDAS | 0.25°×0.25° | 34 | 6 |
| ERA5_0.25_6h | ERA5 | 0.25°×0.25° | 38 | 6 |
| ERA5_0.25_1h | ERA5 | 0.25°×0.25° | 38 | 1 |
表2 不同模拟初始时刻试验的情况Table 2 The initial time of simulation experiments |
| 名称 | 模拟初始时刻 |
|---|---|
| ERA_0800 | 2021-08-08T00:00 |
| ERA_0812 | 2021-08-08T12:00 |
| ERA_0900 | 2021-08-09T00:00 |
| ERA_0908 | 2021-08-09T08:00 |
5 模拟结果分析
5.1 不同初边界资料对超级单体模拟的影响
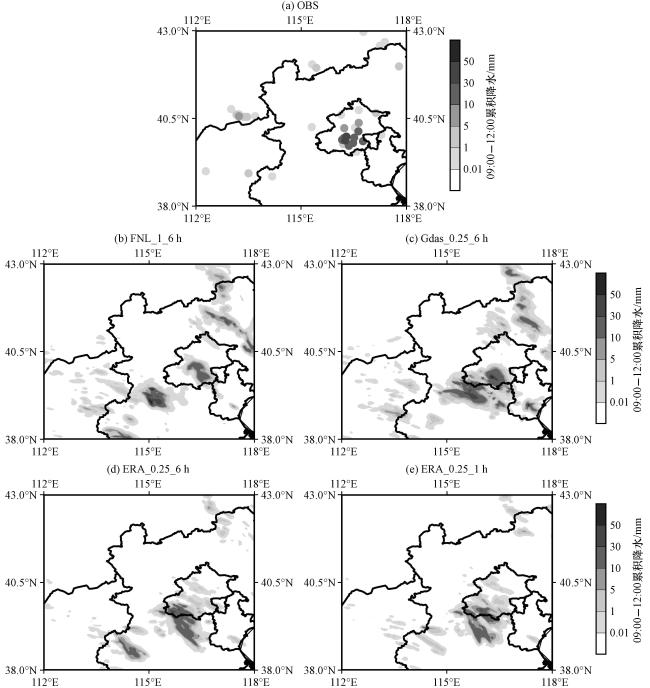
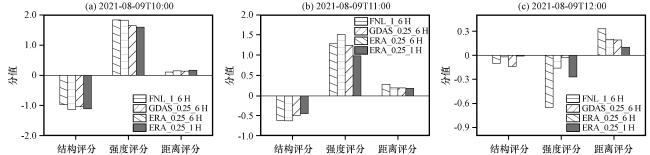
图5 2021年8月9日09:00 -12:00, D03模拟域中观测(a)、 FNL_1_6h(b)、 GDAS_0.25_6h(c)、 ERA_0.25_6h(d)和ERA_0.25_1h(e)的3 h累计降水(单位: mm)分布Fig.5 The distribution of 3-hour accumulated precipitation (unit: mm) of the observation (a), FNL_1_6h (b), GDAS_0.25_6h (c), ERA_0.25_6h (d) and ERA_0.25_1h (e) in the D03 domain from 09:00 to 12:00 on 9 August 2021 |
5.2 不同模拟初始时刻对超级单体模拟的影响
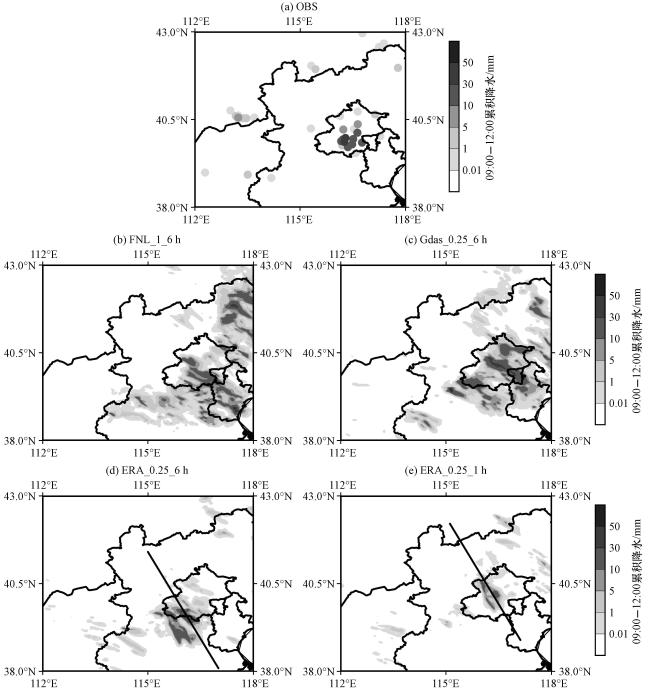
图7 2021年8月9日09:00 -12:00, D03模拟域中观测(a)、 ERA_0800(b)、 ERA_0812(c)、 ERA_0900(d)和ERA_0908(e)的3 h累计降水(单位: mm)分布(d)、(e)中黑色剖线为超级单体西北-东南移动方向 Fig.7 The distribution of 3-hour accumulated precipitation (unit: mm) of the observation (a), ERA_0800 (b), ERA_0812 (c), ERA_0900 (d) and ERA_0908 (e) in the D03 domain from 09:00 to 12:00 on 9 August 2021.The black line in (d) and (e) is the northwest-sactheast movement of the supercell |
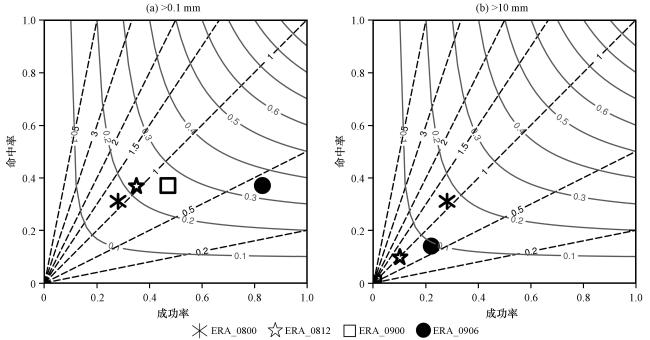
图8 大于0.1 mm(a)和大于10 mm(b)阈值下ERA_0800、 ERA_0812、 ERA_0900和 ERA_0908试验的3 h降水评分图横坐标为成功率(1-FAR), 纵坐标为命中率(POD), 曲线为TS分数(TS), 虚线为命中率和成功率的比值 Fig.8 The score of simulated 3 h precipitation with simulations of ERA_0800, ERA_0812, ERA_0900, and ERA_0900 under 0.1 mm (a) and 10 mm (b) thresholds.The abscissa is the success rate (1-FAR), the ordinate is the hit rate (POD), the curve is the TS score (TS), and the dashed line is POD/(1-FAR) |
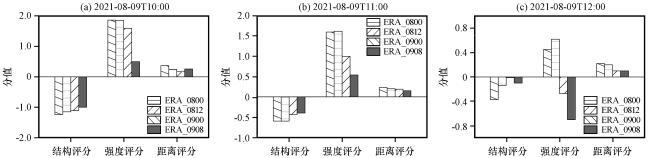
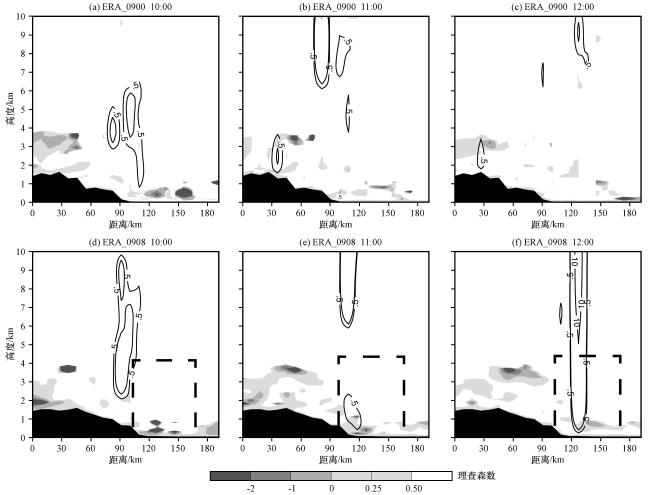
图10 沿超级单体过程西北东南移动方向(图7黑色剖线)的WRF_0900和WRF_0908试验中的垂直速度(黑色等值线, 单位: m·s-1)和Richardson数(阴影区)的垂直剖面Fig.10 Vertical cross-section of vertical velocities (black contours, unit: m·s-1) and Richardson numbers (the shaded) of the WRF_0900 and WRF_0908 experiments along the northwest-southeast movement of the supercell (black line in Fig.7) |
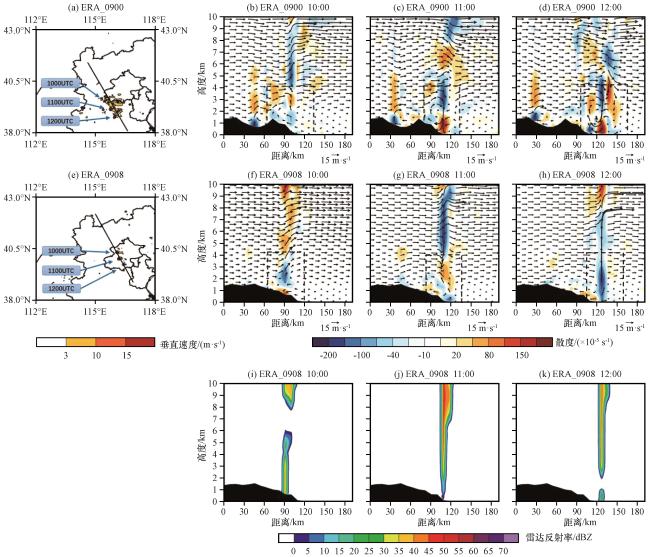


图11 2021年8月9日10:00 -12:00 ERA_0900(a)和ERA_0908(e)最大垂直速度(彩色区, 单位: m·s-1)的演变;ERA_0900和ERA_0908在10:00(b, f)、 11:00(c, g)和12:00(d, h)分别沿图11(a)和(e)中黑色直线的散度(彩色区, 单位: ×10-5 s-1)和风场(矢量, 单位: m·s-1)剖面以及ERA_0908在10:00(i)、 11:00(j)和12:00(k)沿着(e)中黑色直线的雷达回波(彩色区, 单位: dBZ)剖面Fig.11 Evolution of the maximum vertical velocity (color area, unit: m·s-1) of ERA_0900 (a) and ERA_0908 (e) from 10:00 to 12:00 on 9 August 2021; vertical cross-section of divergence (color area, unit: ×10-5 s-1) and wind (vector, unit: m·s-1) of ERA_0900 and ERA_0908 at 10:00 (b, f), 11:00 (c, g), and 12:00 (d, h) along the black value lines in Fig.11 (a) and (e); vertical cross-section of radar reflectivity (color area, unit: dBZ) of WRF_0908 at 10:00 (i), 11:00 (j) and 12:00 (k) along the black lines of (e) |