1 引言
2 数据来源与方法介绍
2.1 数据资料
2.2 客观分型方法
2.3 后向轨迹及潜在源分析
3 结果与讨论
3.1 臭氧污染特征分析
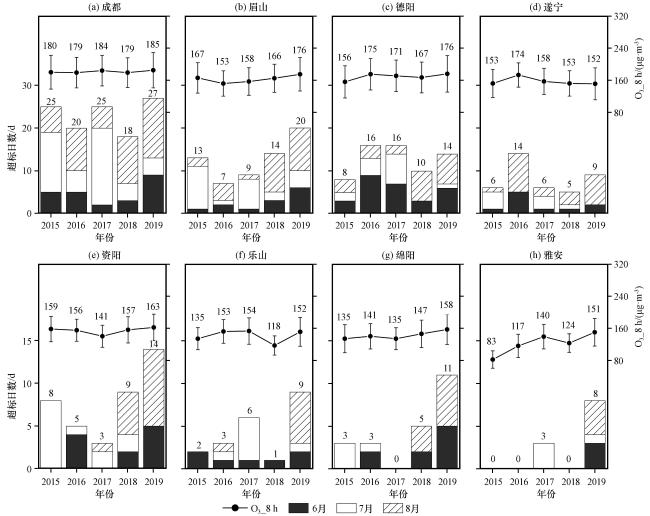
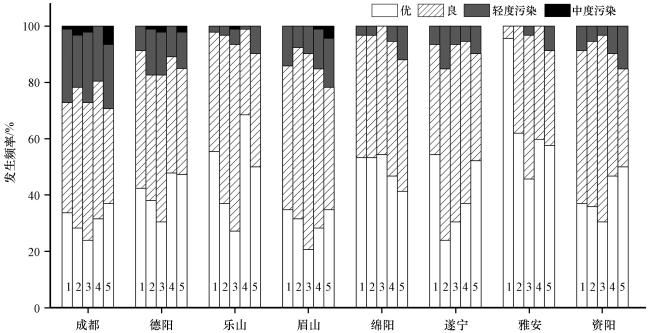
图2 2015 -2019年夏季成都平原城市O3_8 h第90百分位浓度平均值和超标状况年变化Fig.2 Annual changes in the average concentration and excess of O3_8 h in Chengdu plain cities in the summer of 2015 -2019 |
3.2 臭氧污染天气分型
3.2.1 天气形势的分型结果及其环流特征
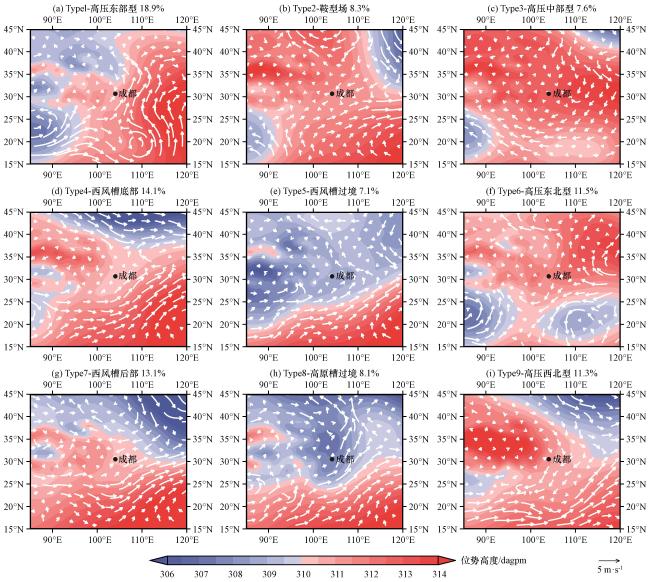
图4 2015 -2019年夏季700 hPa位势高度(彩色区, 单位: dagpm)及风场分型(矢量, 单位: m·s-1)白色箭头为700 hPa高度层U、 V合成风 Fig.4 700 hPa geopotential height(the colour area, unit: dagpm) and wind field classification(vector, unit: m·s-1) in the summer of 2015 -2019.The white arrow is the combined wind of U and V at the 700 hPa |
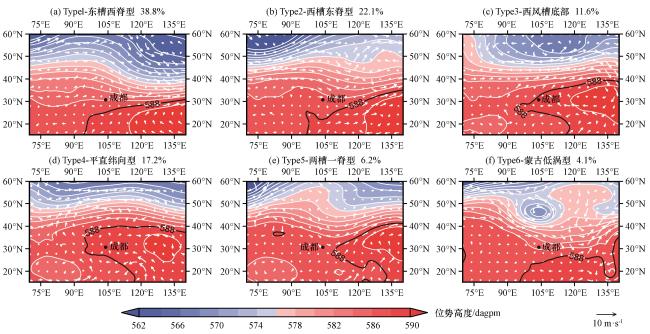
图5 2015 -2019年夏季500 hPa位势高度(彩色区, 单位: dagpm)及风场分型(矢量, 单位: m·s-1)等值线为等高线(间隔2 dagpm), 黑色加粗线为副高“588位势高度线”, 白色箭头为500 hPa高度层U、 V合成风 Fig.5 500 hPa geopotential height(the colour area, unit: dagpm) and wind field classification(vector, unit: m·s-1) in the summer of 2015 -2019.The contours line is the isotherm (interval 2 dagpm), the black line is the "588 potential height line" of the subtropical high, the white arrow is the combined wind of U and V at the 500 hPa, the black dot is the location of Chengdu |
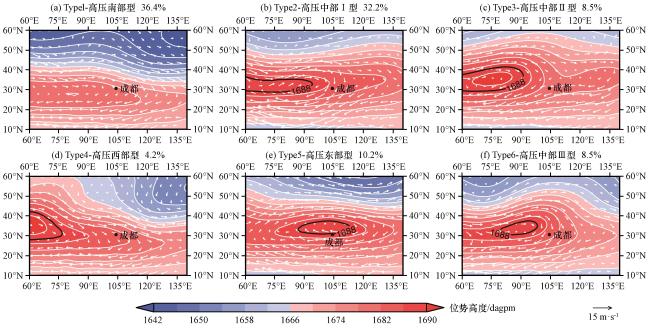
图6 2015 -2019年夏季100 hPa位势高度(彩色区, 单位: dagpm)及风场分型(矢量, 单位: m·s-1)等值线为等高线(间隔4 dagpm), 黑色加粗线为南亚高压“1688特征线”, 白色箭头为100 hPa高度层U、 V合成风 Fig.6 100 hPa geopotential height (the colour area, unit: dagpm) and wind field classification (vector, unit: m·s-1) in the summer of 2015 -2019.The contours line is the isotherm (interval 4 dagpm), the black line is the "1688 potential height line" of the asia high, the white arrow is the combined wind of U and V at the 100 hPa |
3.2.2 不同天气型下地面O3 污染特征
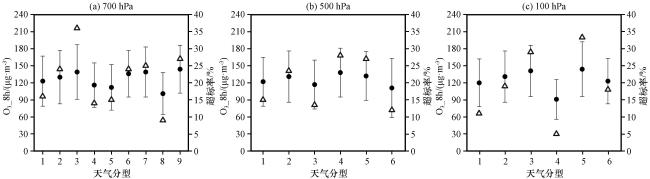
图7 2015 -2019年夏季不同天气型下成都市O3污染特征实心圆点为O3_8 h平均浓度, 线杆代表浓度±标准差; 空心三角形为该分型下的O3超标率 Fig.7 Characteristics of O3 pollution in Chengdu under different weather classification in the summer of 2015 -2019.The solid dots are O3_8 h concentration, the bars represent concentration ± standard deviation, the hollow triangle is the O3 over-standard rate under this classification |
3.3 成都平原夏季区域O3 污染天气形势
3.3.1 近5年夏季典型O3 污染事件及天气型特征
表1 2015 -2019年夏季臭氧污染和非污染时期的天气形势及对应的成都市O3 污染特征Table 1 Weather situation and O3 pollution characteristics in Chengdu during ozone pollution and non-pollution periods in the summer of 2015 -2019 |
| 类型 | 环流特征 | 700 hPa | 500 hPa | 100 hPa | 出现 天数 | 超标率 | O3_8 h /(μg·m-3) | O3_8 h≥ 150天数 |
|---|---|---|---|---|---|---|---|---|
| 1 | 成都平原700 hPa和500 hPa高空受西风槽后部的西北气流控制 | Type7 Type9 | Type1 Type2 | Type1 | 59 d | 33% | 148 | 29 d |
| Type2-3 | 20 d | 65% | 168 | 14 d | ||||
| 2 | 700 hPa高压位于成都平原东部, 副高脊线和南亚高压中心向平原靠近 | Type1 Type6 | Type2 Type4 | Type2 Type5 | 50 d | 46% | 147 | 25 d |
| 3 | 700 hPa高压和南亚高压中心位于成都平原附近, 副高脊线西伸北抬 | Type3 | Type4 | Type5 | 15 d | 69% | 175 | 12 d |
| 4 | 700 hPa西风槽或高原短波槽东移影响成都平原 | Type5 Type8 | Type1 Type3 | — | 45 d | 2% | 91 | 1 d |
表2 2015 -2019年夏季成都平原城市群典型O3 污染过程(共计55天)Table 2 Typical O3 pollution process in the Chengdu Plain in the summer of 2015 -2019 (55 days in total) |
| 污染 程度 | 案例 | 污染时期 | 持续 时间/d | 成都O3_8 h /(μg·m-3) | 平原O3_8 h /(μg·m-3) | 主要 超标城市 | 污染 天气型 |
|---|---|---|---|---|---|---|---|
| 超标城市 ≥4个 | 1 | 2017年7月7 -14日 | 8 | 189 | 164 | 成都、 德阳、 眉山、 雅安、 乐山 | 类型1、 2 |
| 2 | 2018年8月26 -29日 | 4 | 183 | 169 | 成都、 德阳、 绵阳、 资阳 | 类型2 | |
| 3 | 2019年6月1 -6日 | 6 | 185 | 169 | 成都、 德阳、 绵阳、 资阳 | 类型1 | |
| 4 | 2019年8月10 -18日 | 9 | 189 | 168 | 成都、 德阳、 眉山、 绵阳、 资阳 | 类型1 | |
| 3个≤ 超标城市 <4个 | 5 | 2015年7月10 -12日 | 3 | 176 | 140 | 成都、 遂宁、 资阳 | 类型2 |
| 6 | 2015年7月24 -29日 | 6 | 172 | 136 | 成都、 眉山、 资阳 | 类型1 | |
| 7 | 2016年6月5 -8日 | 4 | 154 | 147 | 德阳、 遂宁、 资阳 | 类型1 | |
| 8 | 2016年8月19 -25日 | 7 | 189 | 141 | 成都、 德阳、 遂宁 | 类型2、 3 | |
| 9 | 2018年6月5 -7日 | 3 | 188 | 164 | 成都、 德阳、 眉山 | 类型1 | |
| 10 | 2019年8月22 -26日 | 5 | 185 | 157 | 成都、 眉山、 遂宁 | 类型3 |
3.3.2 污染天气型下成都平原边界层气象特征
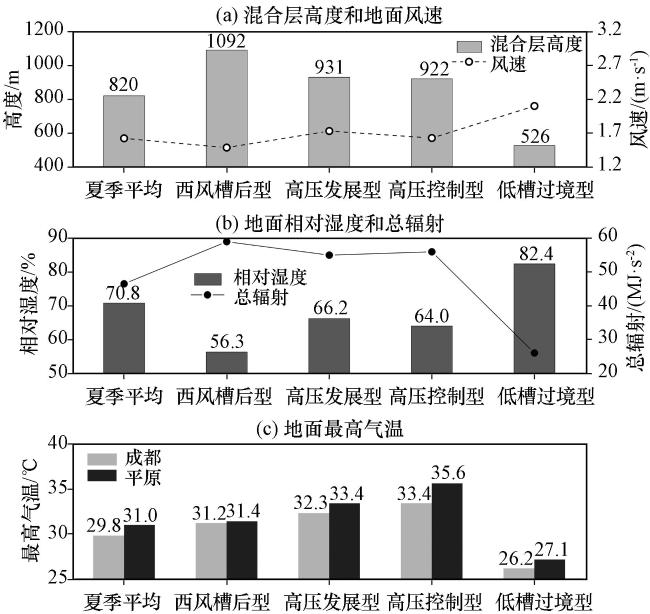
图8 夏季不同天气型下的成都市基本气象要素特征Fig.8 Characteristics of basic meteorological elements in Chengdu under different weather patterns in summer |
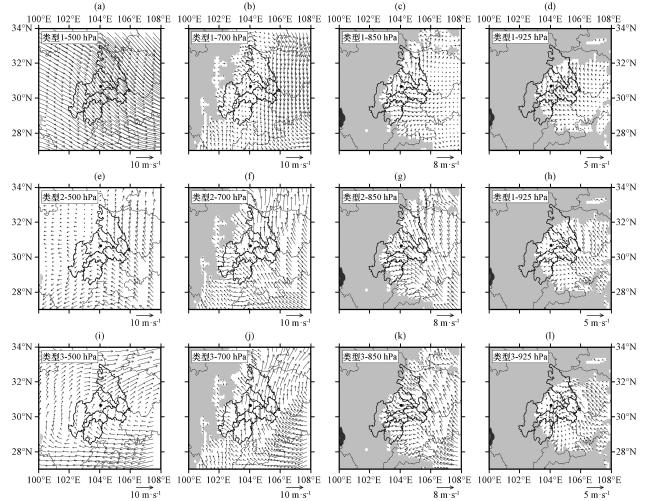
图9 夏季臭氧污染天气型的成都平原各高度层白天时段内的平均流场特征Fig.9 The characteristics of the average flow field during the daytime at each altitude of the Chengdu Plain under different weather pattern in summer |
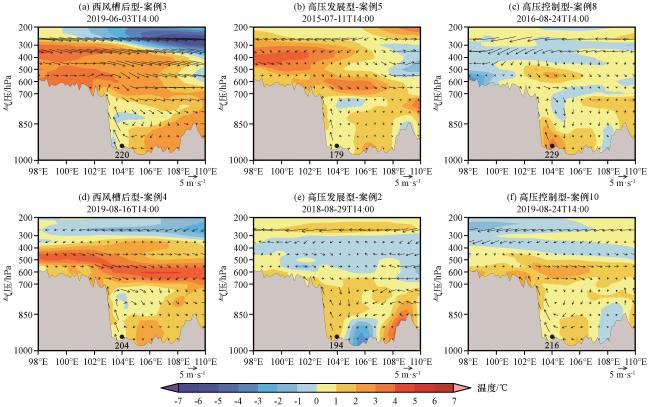
图10 夏季臭氧污染天气型的污染发展阶段24 h变温(彩色区, 单位: °C)和u、 w合成风(矢量, 单位: m·s-1)通过(30.75°N, 104.00°E)的剖面阴影为地形, 黑色圆点和数值为成都及当天O3_8 h浓度(单位: μg·m-3), 箭头为u、 w*10合成矢量 Fig.10 Cross-sectional view of the 24-hour variable temperature (colour area, unit: °C) and the combined wind (vector, unit: m·s-1) of u and w passing (30.75°N, 104.00°E) in the development stage of the pollution under different weather pattern in summer.The gray shadows are terrain, black dots represent Chengdu, black value is the O3_8 h concentration in Chengdu on that day (unit: μg·m-3), the arrow is u, w * 10 composite vector |