1 引言
2 资料选取和方法简介
2.1 资料选取
2.2 方法介绍
2.2.1 FQXP强度的定义方法
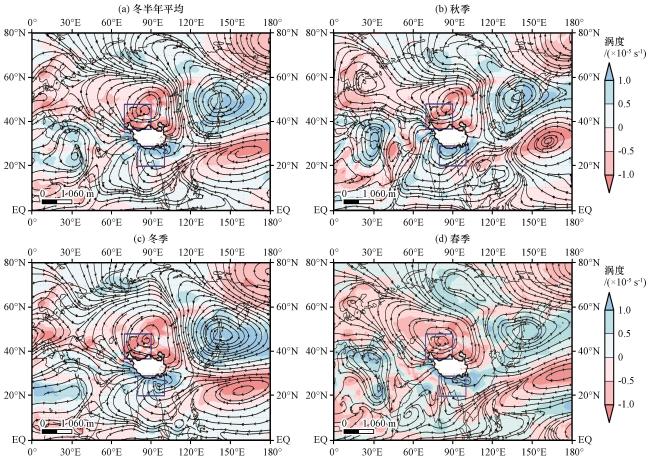
图1 1979 -2019年600 hPa冬半年平均、 秋季、 冬季和春季纬向偏差流场(箭头, 单位: m·s-1)和涡度场(阴影, 单位: ×10-5s-1)的空间分布空白处为超过4 km高原地形, 高原以北和以南的蓝色方框分别表示NBR(35°N -45°N, 70°E -90°E)和SBT(20°N -28°N, 80°E -100°E)的平均位置 Fig.1 The mean zonal deviation circulation (unit: m·s-1, arrow) and vorticity (unit: ×10-5 s-1, shaded) field in winter half-year, autumn, winter, spring at 600 hPa.The blank is for QXP terrain over 4 km.The blue square frame to the north and south of the QXP represent the average positions of the NBR (35°N -45°N, 70°E -90°E) and the SBT (20°N -28°N, 80°E -100°E) respectively |
2.2.2 统计方法简介
3 FQXP强度演变与中国降水、 气温的关系
3.1 年际演变特征和异常年份的选取
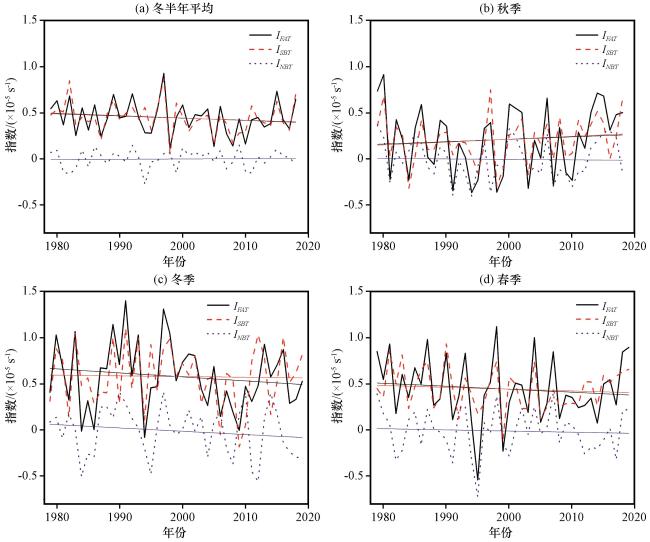
图2 冬半年平均、 秋季、 冬季和春季IFQXP 、 ISBT 和INBR 时间序列Fig.2 The time series of IFQXP, ISBT and INBR in winter half-year, autumn, winter, spring |
表1 IFQXP 、 ISBT 和 INBR 各时间段的相关关系Table 1 The correlation of IFQXP 、 ISBT and INBR at each time period |
| 各时间段的各 指数间关系 | ISBT | INBR | ISBT 和INBR 的 相关关系 |
|---|---|---|---|
| 冬半年平均的IFQXP | 0.841*** | 0.414** | -0.144 |
| 秋季的IFQXP | 0.813*** | 0.751*** | 0.226 |
| 冬季的IFQXP | 0.705*** | 0.499** | -0.262* |
| 春季的IFQXP | 0.722*** | 0.755*** | 0.092 |
*、 **和***分别代表相关关系超过0.1、 0.01和0.001显著性水平 |
表2 IFQXP 各时间段的偏强/弱年份Table 2 The stronger / weaker year of IFQXP in each time period |
| 年型 | 年份 | |
|---|---|---|
| 冬半年平均 | 偏强年 | 1980、 1982、 1989、 1992、 1997、 2015、 2018 |
| 偏弱年 | 1983、 1987、 1998、 2005、 2008、 2010 | |
| 秋季 | 偏强年 | 1979、 1980、 1986、 2000、 2006、 2014、 2015 |
| 偏弱年 | 1981、 1984、 1991、 1994、 1995、 1998、 1999、 2003、 2007、 2010 | |
| 冬季 | 偏强年 | 1980、 1983、 1989、 1991、 1993、 1997、 1998 |
| 偏弱年 | 1984、 1986、 1994、 2006、 2008、 2009 | |
| 春季 | 偏强年 | 1979、 1981、 1987、 1990、 1993、 1998、 2004、 2007、 2018 |
| 偏弱年 | 1994、 1995、 1999、 2005、 2014 | |
3.2 与中国降水的关系
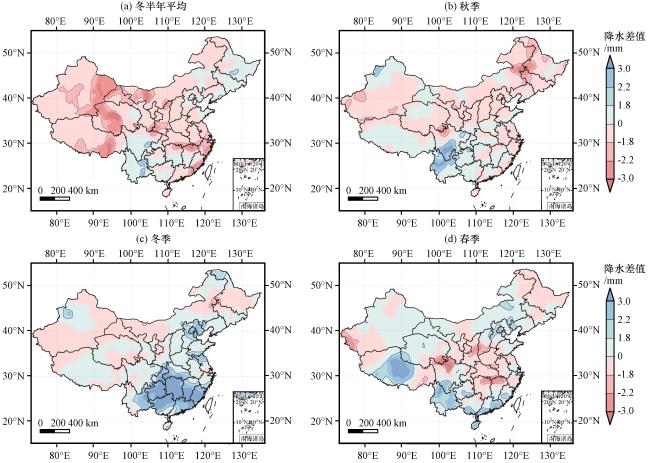
图3 冬半年平均、 秋季、 冬季、 春季的IFQXP 偏强年和偏弱年与中国降水的差值(阴影, 单位: mm)t检验分布等值线表示超过0.1的显著性水平, 实线和虚线分别表示正值与负值; 浅色和深色阴影区分别表示超过0.1, 0.05和0.01的显著性水平 Fig.3 The t-test results of the difference between the stronger and weaker IFQXP and precipitation (the shaded, unit: mm) in winter half-year, autumn, winter, spring over China.Contours indicate significance levels above 0.1.The solid lines and dashed lines represent positive and negative values respectively.Light and dark shaded areas indicate significance levels above 0.1, 0.05 and 0.01, respectively |
3.3 与中国气温的关系
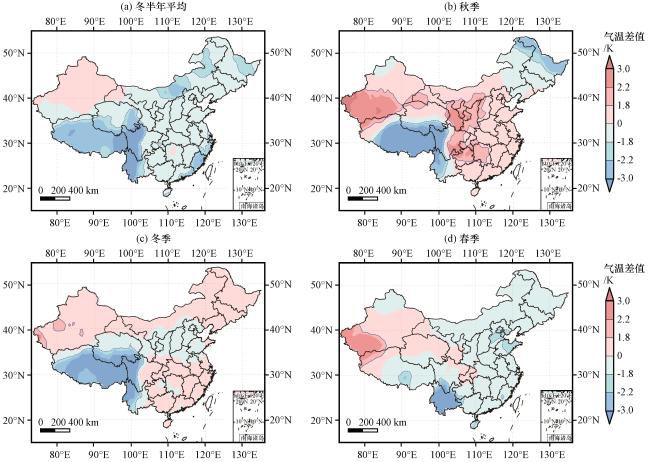
图4 冬半年平均、 秋季、 冬季、 春季的IFQXP 偏强年和偏弱年与中国气温的差值(阴影, 单位: K)t检验分布等值线表示超过0.1的显著性水平, 实线和虚线分别表示正值与负值; 浅色和深色阴影区分别表示超过0.1, 0.05和0.01的显著性水平 Fig.4 The t-test results of the difference between the stronger and weaker IFQXP and temperature (the shaded, unit: K) in winter half-year, autumn, winter, spring over China.Contours indicate significance levels above 0.1.The solid lines and dashed lines represent positive and negative values respectively.Light and dark shaded areas indicate significance levels above 0.1, 0.05 and 0.01, respectively |
4 大气环流演变分析
4.1 地面环流形势分析
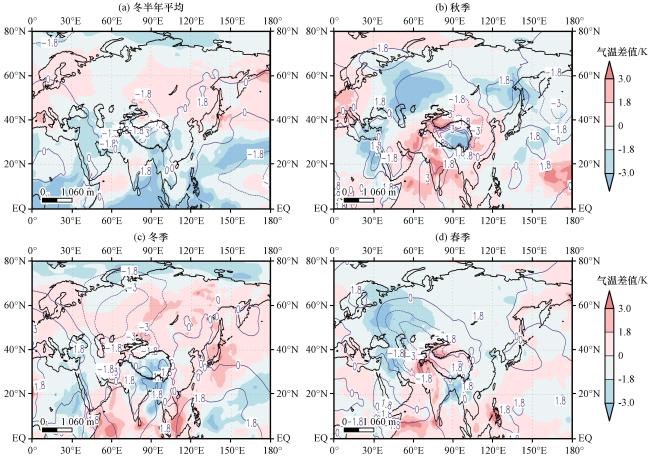
图5 冬半年平均、 秋季、 冬季、 春季IFQXP 偏强年和偏弱年的海平面气压(等值线, 单位: hPa)差值和2 m气温(阴影, 单位: K)差值t检验分布绝对值大于1.8均表示超过0.1的显著性水平 Fig.5 The t-test results of differences of between the stronger and weaker IFQXP and sea level pressure (contour, unit: hPa) and 2 metre temperature (shaded, unit: K) in winter half-year, autumn, winter, spring.Absolute values greater than 1.8 all indicate more than 0.1 level of significance |
4.2 低层环流形势分析
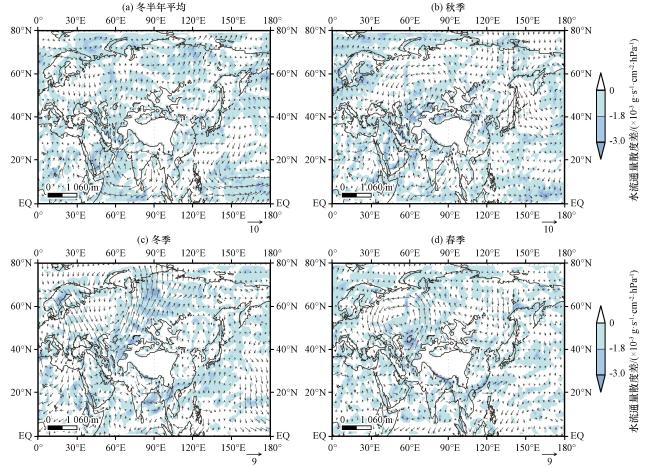
图6 冬半年平均、 秋季、 冬季、 春季IFQXP 偏强年和偏弱年的850 hPa水平风速差值(箭头, 单位: m·s-1)和水汽通量散度差值(阴影, 单位: ×10-6 g·s-1·cm-2·hPa-1)的t检验分布绝对值大于1.8均表示超过0.1的显著性水平 Fig.6 The t-test results of differences of between the stronger and weaker IFQXP and 850 hPa wind (arrow, unit: m·s-1) and vapor flux divergences (shadow, unit: ×10-6 g·s-1·cm-2·hPa-1 ) in winter half-year, autumn, winter, spring.Absolute values greater than 1.8 all indicate more than 0.1 level of significance |
4.3 中层环流形势分析
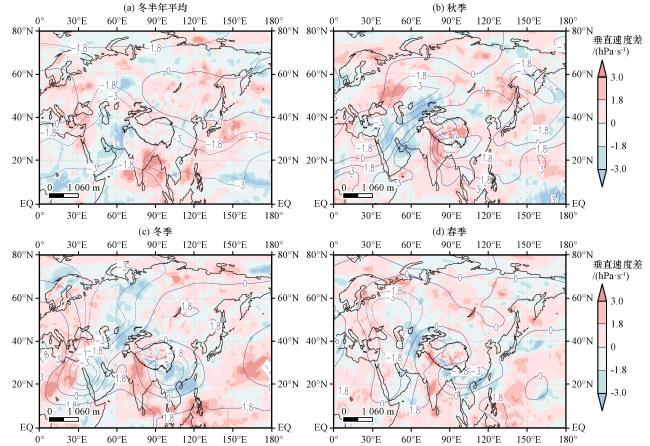
图7 冬半年平均、 秋季、 冬季、 春季IFQXP 偏强年和偏弱年的500 hPa位势高度差(等值线, 单位: gpm)和垂直速度差(阴影, 单位: hPa·s-1)的t检验分布绝对值大于1.8均表示超过0.1的显著性水平 Fig.7 The t-test results of differences of between the stronger and weaker IFQXP and 500 hPa geopotential height (contour, unit: gpm) and vertical velocity (shadow, unit: hPa·s-1) in winter half-year, autumn, winter, spring.Absolute values greater than 1.8 all indicate more than 0.1 level of significance |
4.4 OLR和高层环流形势分析
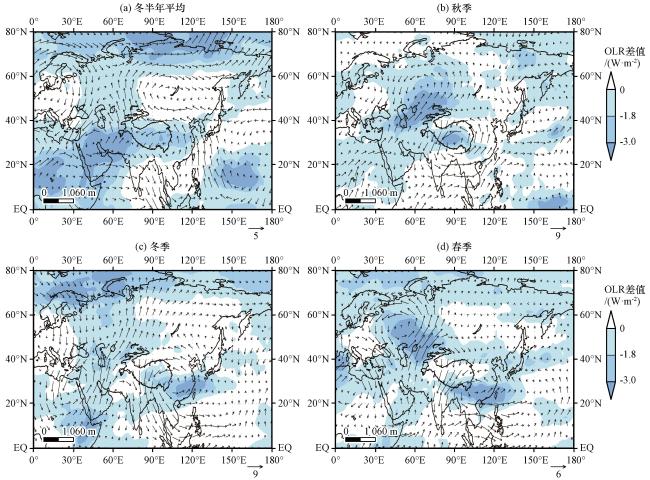
图8 冬半年平均、 秋季、 冬季、 春季IFQXP 偏强年和偏弱年的OLR差(阴影, 单位: W·m-2)和200 hPa水平风(矢量, 单位: m·s-1)的t检验分布绝对值大于1.8均表示超过0.1的显著性水平 Fig.8 The t-test results of differences of between the stronger and weaker IFQXP and OLR (shaded, unit: W·m-2) and 200 hPa wind (arrow, unit: m·s-1) in winter half-year, autumn, winter, spring.Absolute values greater than 1.8 all indicate more than 0.1 level of significance |