
1 引言
2 资料来源和方法介绍
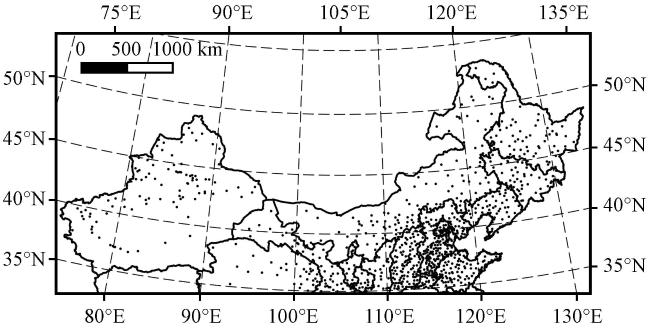
2.1 资料及预处理
2.2 方法介绍
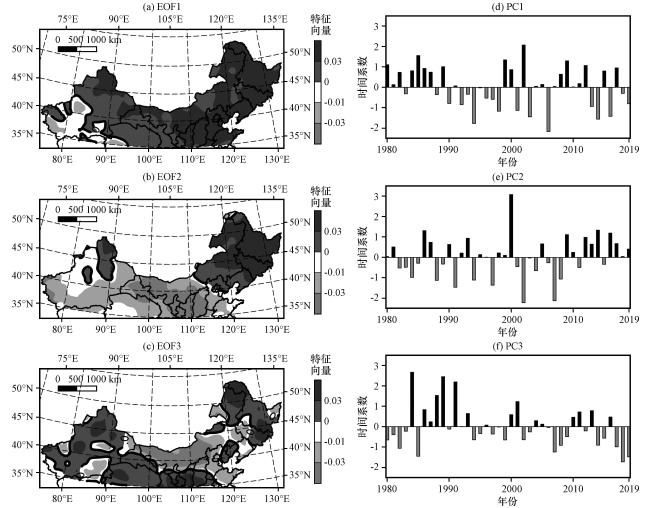
3 北方冬季寒潮强度时空分布特征
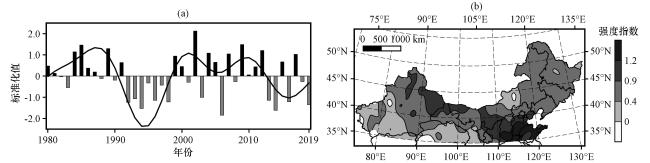
图2 1980 -2019年冬季我国北方区域平均寒潮过程强度指数标准化时间序列(a)和单站寒潮偏强年平均强度指数空间分布(b)Fig.2 The normalized series of regional averaged intensity index of single-station cold wave processes (a) and the spatial distribution of single-station cold wave intensity averaged in the stronger years in northern China (b) in winter from 1980 to 2019 |
4 寒潮强度与中纬度海温异常的关系
4.1 寒潮强度PC1与中纬度海温的时滞相关关系
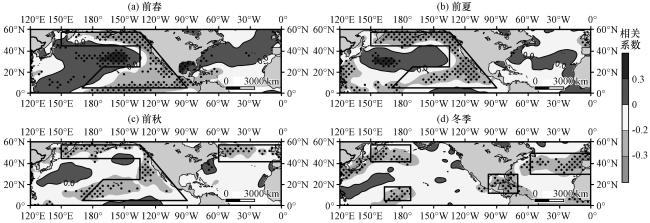
图4 北方冬季单站寒潮强度PC1与前春(a)、 前夏(b)、 前秋(c)、 冬季(d)的中纬度海温异常的时滞相关系数分布打点区域通过90%置信水平; 黑框区域为海温关键区 Fig.4 The lead-lag and contemporaneous correlation coefficients between PC1 of single-station cold wave intensity during the winter in northern China and the mid-latitude SSTA in pre-spring (a), pre-summer (b), pre-autumn (c), winter (d).The dotted areas are significant at the 90% confidence level; the black box areas are the SST key areas |
表1 北方冬季单站寒潮过程强度PC1与各个季节关键区SST指数的时滞相关系数Table 1 The lead-lag and contemporaneous correlation coefficients between PC1 of single-station cold wave intensity during the winter in northern China and SST index over the key areas in all seasons, respectively |
| 海温指数 | 前春 | 前夏 | 前秋 | 冬季 |
|---|---|---|---|---|
| I NP | -0.39** | -0.49** | -0.34** | -0.30* |
| I ATL | - | - | -0.35** | -0.38** |
| I NP+I ATL | - | - | -0.57** | -0.58** |
*或**分别表示通过90%和95%置信水平 |
表2 北方冬季单站寒潮过程强度PC1与前秋和冬季关键区SST指数的偏相关系数Table 2 Partial correlation coefficients among PC1 of single-station cold wave intensity during the winter in northern China and SST index over the key areas in pre-autumn, winter, respectively |
| 海温指数 | 前秋 | 冬季 |
|---|---|---|
| I NP | -0.47** | -0.46** |
| I ATL | -0.48** | -0.51** |
*或**分别表示通过90%和95%置信水平 |
4.2 北太平洋SSTA对冬季大气环流的影响
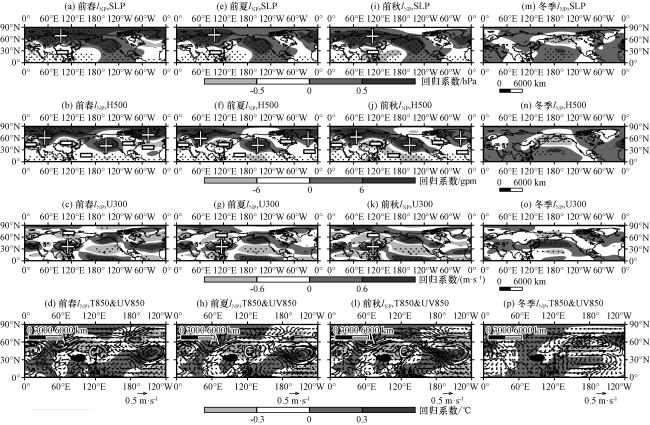
图5 冬季SLP场(单位: hPa)、 H500(单位: gpm)、 U300(单位: m·s-1)、 T850(单位: ℃)和 UV850(单位: m·s-1)分别与前春、 前夏、 前秋、 冬季I NP的线性回归系数(数值乘-1)打点区域通过90%置信水平; “+” 、 “-”号分别代表各个要素场的正负异常中心; “A” 、 “C”分别代表反气旋和气旋性环流异常中心 Fig.5 Linear regression coefficients of SLP (unit: hPa)、 H500 (unit: gpm)、 U300 (unit: m·s-1)、 T850 (unit: °C)、 and UV850 (unit: m·s-1) in winter onto the I NP in pre-spring, pre-summer, pre-autumn and winter, respectively.All values are multiplied by -1.The dotted areas are significant at the 90% confidence level; “+” and “-” indicate the centers of positive and negative anomalies on each element field, respectively; the letters “A” and “C” indicate the centers of anticyclonic and cyclonic anomalies, respectively |
4.3 北大西洋SSTA对冬季大气环流的影响
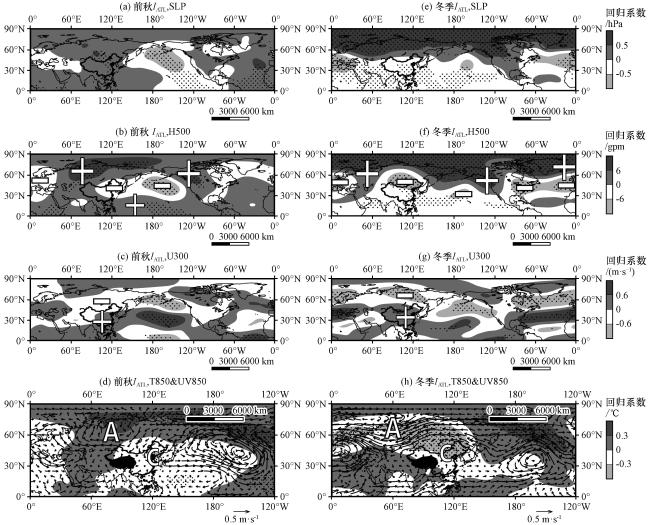
图6 冬季SLP场(单位: hPa)、 H500(单位: gpm)、 U300(单位: m·s-1)、 T850(单位: ℃)和 UV850(单位: m·s-1)分别与前秋、 冬季I ATL的线性回归系数(数值乘-1)打点区域通过90%置信水平; “+” 、 “-”号分别代表各个要素场的正负异常中心; “A” 、 “C”分别代表反气旋和气旋性环流异常中心 Fig.6 Linear regression coefficients of SLP (unit: hPa)、 H500 (unit: gpm)、 U300 (unit: m·s-1)、 T850 (unit: °C)、 and UV850 (unit: m·s-1) in winter onto the I ATL in pre-autumn and winter, respectively.All values are multiplied by -1.The dotted areas are significant at the 90% confidence level; “+” and “-” indicate the centers of positive and negative anomalies on each element field, respectively; the letters “A” and “C” indicate the centers of anticyclonic and cyclonic anomalies, respectively |
4.4 北太平洋与北大西洋SSTA对寒潮强度的协同作用
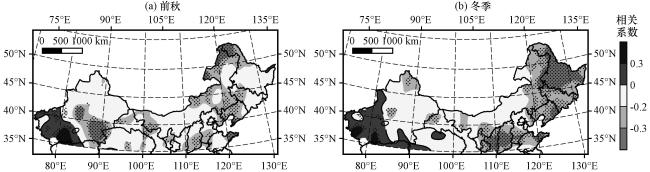
图7 北方冬季单站寒潮强度分别与前秋(a)、 冬季(b)I NP+I ATL相关系数分布打点区域通过90%置信水平 Fig.7 The correlation coefficients between the single-station cold wave intensity during the winter in northern China and I NP+I ATL in pre-autumn (a), winter (b), respectively.The dotted areas are significant at the 90% confidence level |
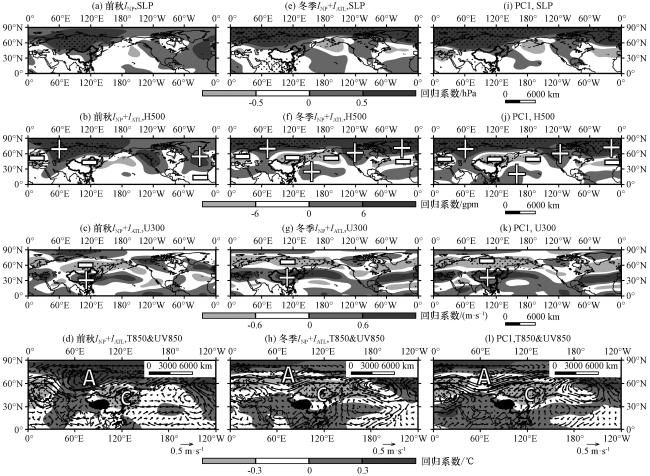
图8 冬季SLP场(单位: hPa)、 H500(单位: gpm)、 U300(单位: m·s-1)、 T850(单位: ℃)和 UV850(单位: m·s-1)分别与前秋、 冬季的I NP+I ATL和PC1的线性回归系数(数值乘-1)打点区域通过90%置信水平; “+” 、 “-”号分别代表各个要素场的正负异常中心; “A” 、 “C”分别代表反气旋和气旋性环流异常中心 Fig.8 Linear regression coefficients of SLP (unit: hPa)、 H500 (unit: gpm)、 U300 (unit: m·s-1 )、 T850 (unit: °C)、 and UV850 (unit: m·s-1) in winter onto the I NP+I ATL in pre-autumn、 winter and PC1, respectively.All values are multiplied by -1.The dotted areas are significant at the 90% confidence level; “+” and “-” indicate the centers of positive and negative anomalies on each element field, respectively; the letters “A” and “C” indicate the centers of anticyclonic and cyclonic anomalies, respectively |
4.5 中纬度SSTA影响寒潮强度的可能机制
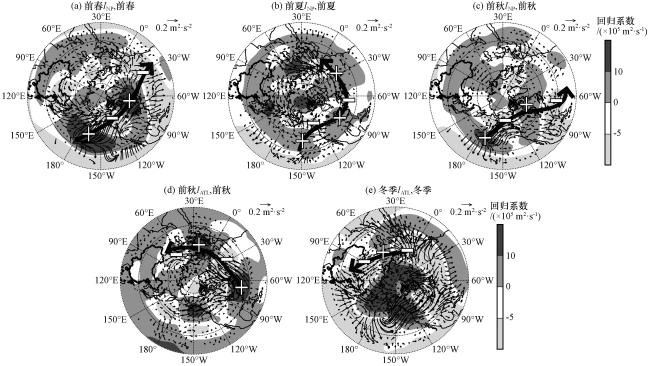
图9 前春(a)、 前夏(b)、 前秋(c)I NP和前秋(d)、 冬季(e)I ATL分别与对应季节300 hPa T-N波通量(单位: m2·s-2)、 流函数(单位: ×105 m2·s-1)异常场的线性回归系数(数值乘-1)“+” 、 “-”号分别代表流函数的正负异常中心; 粗黑色矢量箭头代表波通量传播方向 Fig.9 Linear regression coefficients of 300 hPa T-N wave flux (unit: m2·s-2) and flow function (unit: ×105 m2·s-1) anomalies field in the corresponding season onto the INP in pre-spring (a), presummer (b), pre-autumn (c) and IATL in pre-autumn (d), winter (e). All values are multiplied by -1. “+” and “-” indicate the centers of positive and negative anomalies on flow function field, respectively; thick black vector arrows indicate the direction of wave flux propagation |