

1 引言
2 资料来源与方法介绍
3 青藏高原季风期降水的气候特征
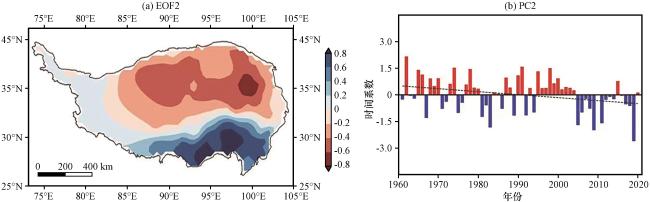
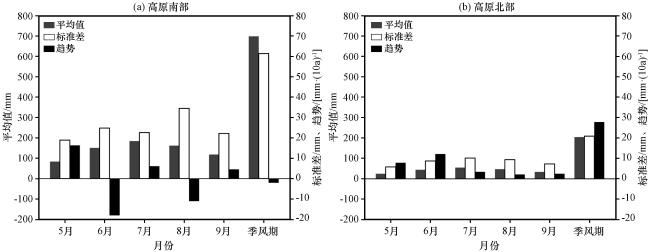
4 过去60年青藏高原南北区域季风期降水的时空变化特征
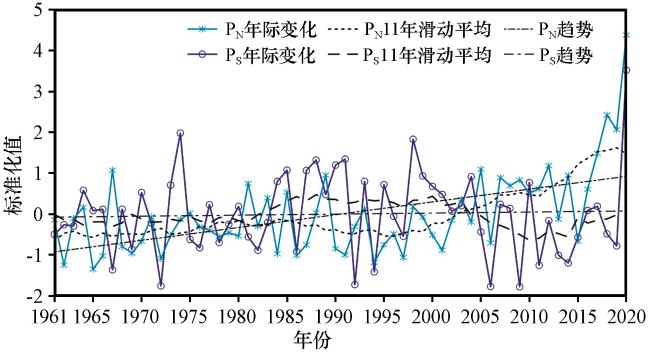
图3 1961 -2020年季风期用GPCC数据集标准化的高原南(PS)、 北(PN)降水的年际变化、 11年滑动平均变化及线性趋势Fig.3 The interannual variation, 11-year moving average variation, and linear trend of precipitation in the southern (PS) and northern (PN) regions of the QXP during the 1961 -2020 monsoon period using the standardized GPCC precipitation dataset |
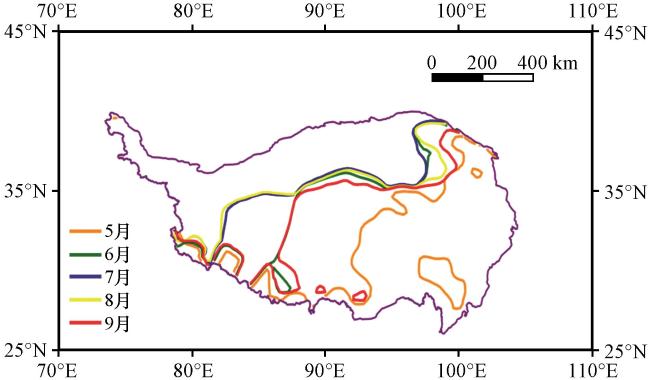
5 青藏高原南北季风期降水的大气环流异常特征
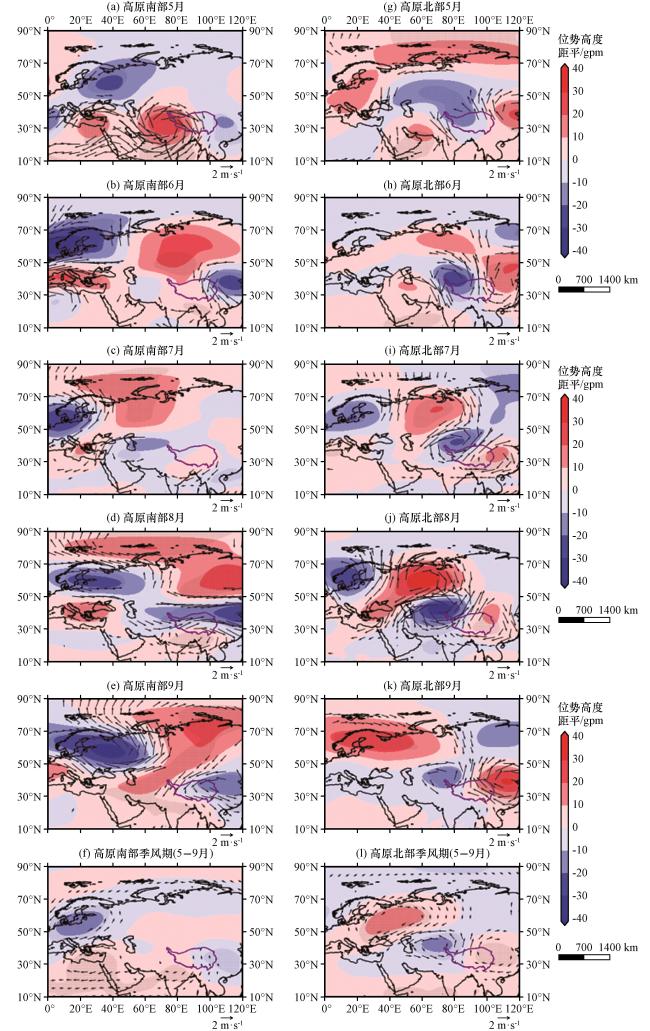
图5 用GPCC降水数据集回归的高原1979 -2020年5 -9月及季风期500 hPa位势高度距平场(EAR5)(彩色区, 单位: gpm)、 经纬向风合成环流(矢量, 单位: m·s-1)Fig.5 Regression of 500 hPa height anomaly field (EAR5) (color area, unit: gpm) and the wind circulation (vector, unit: m·s-1) on the QXP from May to September and the monsoon period of 1979 -2020 using the GPCC precipitation dataset |
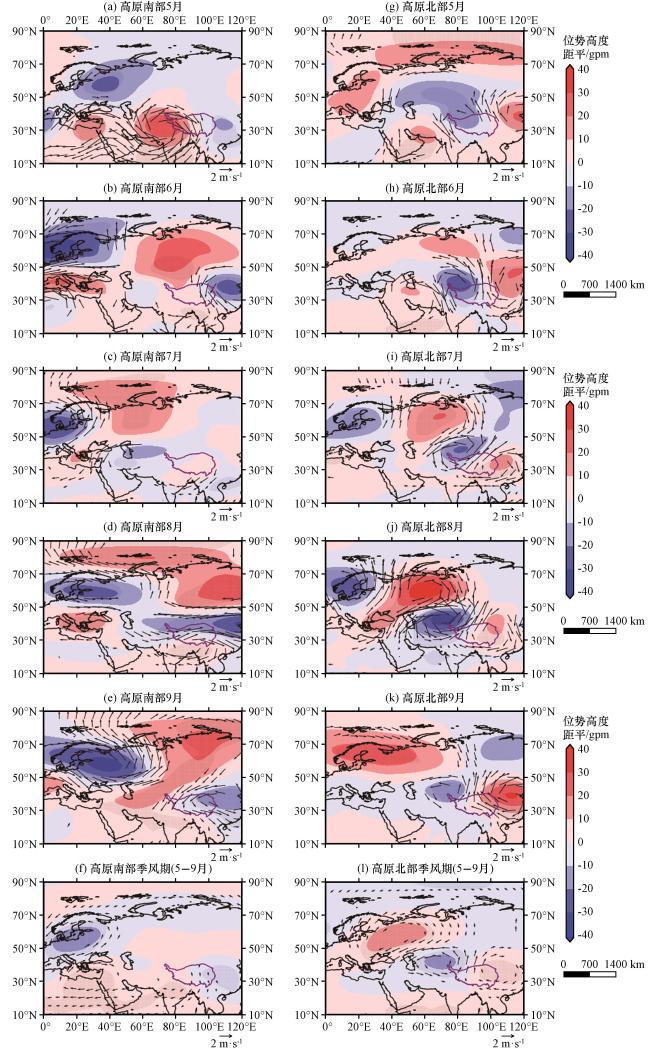
图6 用GPCC降水数据集回归的高原1979 -2020年5 -9月及季风期200 hPa位势高度距平场(EAR5)(彩色区, 单位: gpm)与合成风场(矢量, 单位: m·s-1)Fig.6 Regression of 200 hPa height anomaly field (EAR5) (color area, unit: gpm) and the wind field (vector, unit: m·s-1) on the QXP from May to September and the monsoon period of 1979 -2020 using the GPCC precipitation dataset |
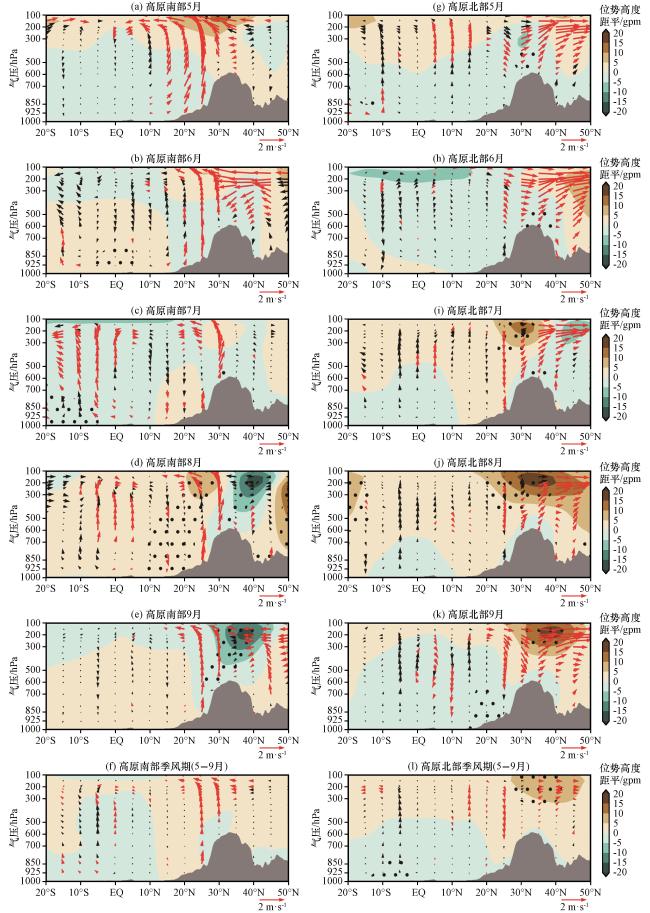


图7 高原南部、 北部降水回归的沿70°E -90°E的位势高度距平场(彩色区: 单位: gpm)与v, w合成风垂直剖面(矢量, v和w×100合成风, 单位: m·s-1)灰色为青藏高原轮廓, 打点区为通过95% 的t检验显著区域 Fig.7 Cross section of geopotential height anomalies (color area, unit: gpm) and combined wind (vector, combined wind of v and w×100, unit: m·s-1) along 70°E -90°E regressed by precipitation over Northern and Southern QXP.The gray represents the contour of the QXP, and the dotted area is the significant area that has passed the 95% t-test |