
1 引言
2 研究区域和数据
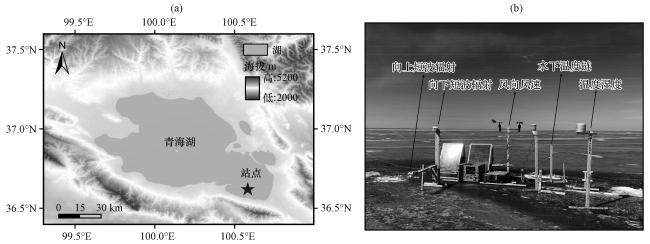
2.1 研究区域
2.2 研究数据
2.2.1 冰封期原位观测数据
表1 观测仪器介绍Table 1 Introduction of observation instrument |
| 观测项目 | 设备型号(制造商) | 测量精度 | 测量范围 | 监测高度(深度) |
|---|---|---|---|---|
| 气温 | PTWD (JST, China) | 0.2 ℃ | -40~80 ℃ | 150 cm |
| 风向风速 | MaxiMet GMX 501 (Gill, England) | 1° | 0°~359° | 150 cm |
| 0.1 m·s-1 | 0.1~60 m·s-1 | |||
| 相对湿度 | MaxiMet GMX 501 (Gill, England) | 2 % | 0~100 % | 150 cm |
| 短波辐射 | TBQ-2 (JST, China) | 1 W·m-2 | 0~1600 W·m-2 | 150 cm |
| 湖表上界面位置 | SR50A (Campbell Scientific, USA) | 0.01 cm | 0.5~10 m | 60 cm |
| 湖表下界面位置 | Tritech PA500/6 (Tritech, England) | 0.1 cm | 0.1~10 m | -40 cm |
| 冰水温度链 | PTWD (JST, China) | 0.01 ℃ | -40~150 ℃ | -5、 -10、 -15、 -20、 -40、 -50、 -60、 -1270 cm |
2.2.2 气象观测站数据
3 结果
3.1 青海湖冰封期气象要素特征
3.1.1 气温
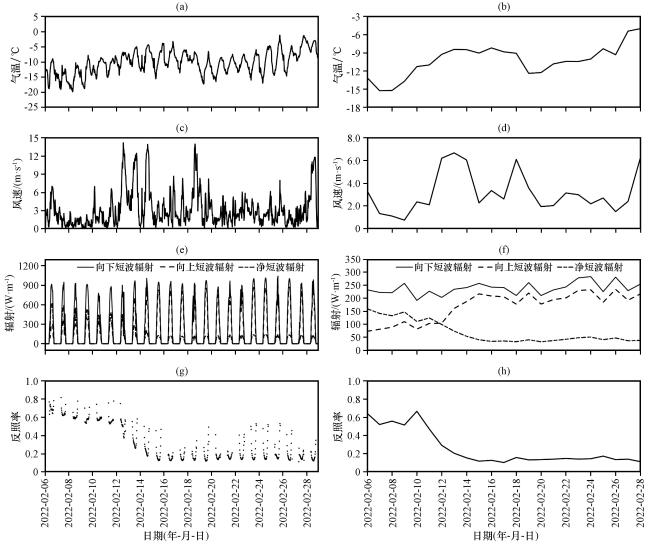
3.1.2 风速
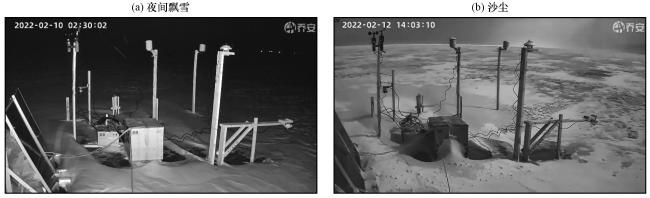
表2 主要天气现象及湖面特征Table 2 Major weather phenomena and lake surface features |
| 日期 | 天气现象 | 地面特征 |
|---|---|---|
| 2月5日 | 降雪 | 薄雪覆盖 |
| 2月6日 | 降雪 | 积雪覆盖(监控录像) |
| 2月10日 | 夜间飘雪 | 积雪覆盖(监控录像) |
| 2月11日 | 夜间飘雪 | 积雪覆盖(监控录像) |
| 2月12日 | 大风、 沙尘(第一次) | 积雪、 沙尘覆盖(监控录像) |
| 2月18日 | 大风(第二次) | 裸露冰面 |
| 2月28日 | 大风(第三次) | 裸露冰面 |
3.1.3 降水
3.1.4 向下短波辐射
3.1.5 湖表反照率和向上短波辐射
3.1.6 净短波辐射
3.2 湖表上、 下界面位置及湖表厚度

图4 青海湖2022年2月6 -28日10 min平均的超声测距及湖表上下界面厚度×表示冰下超声仪器与湖冰下界面之间的距离, 简称“冰下距离”; ·表示冰上超声仪器与湖表上界面之间的距离(如有覆盖物则为覆盖物上界面, 无覆盖物则为湖冰上界面), 简称“冰上距离”; △表示湖表上界面与湖冰下界面之间的距离(覆盖物与湖冰), 简称“湖表厚度” Fig.4 10-minute average high precision ultrasonic distance measurement and thickness of upper and lower surface of lake surface in Qinghai Lake from 6 to 28 February 2022.× indicates distance between the ultrasonic instrument under the ice and the lower surface of the lake ice, referred to as the distance below the ice; · indicates distance between the ultrasonic instrument on the ice and the surface of the lake (if there is a covering, it is the surface of the covering, and if there is no covering, it is the surface of the lake ice), referred to as the ice distance on the ice; △ indicates distance between the top surface and the bottom surface of the lake (covering and lake ice), referred to as lake surface thickness |
3.3 湖水温度
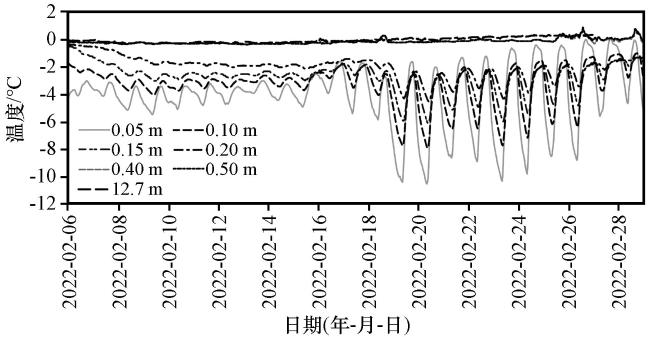
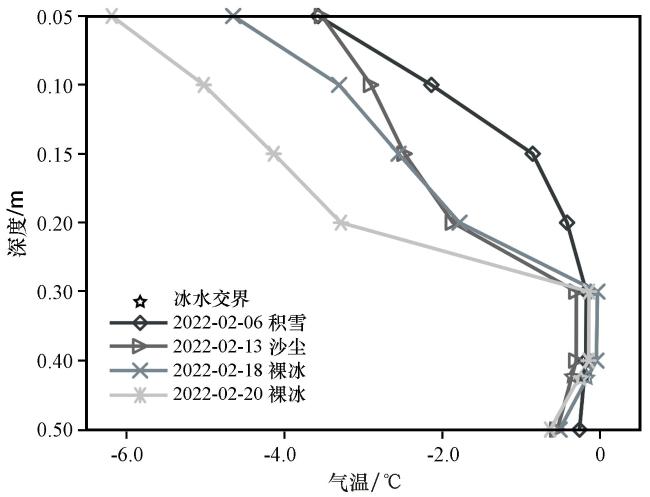
3.4 湖冰温度
3.5 不同阶段湖冰温度差异机制
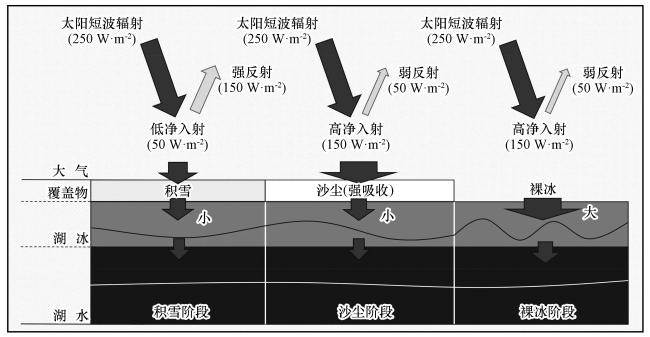
图7 青海湖湖水-湖冰-大气系统辐射和温度变化示意图深色线条指代湖冰层温度变化幅度, 白色线条指代湖水层温度变化幅度, 图中数值来自图2估算 Fig.7 Schematic diagram of radiation and temperature variation of the water-ice-air system in Qinghai Lake. The dark lines refer to the temperature range of the lake ice layer, and the white lines refer to the temperature range of the lake layer. The values in Fig.7 are estimated from Fig.2 |