
1 引言
2 资料来源与方法介绍
2.1 资料来源
2.2 方法介绍
2.2.1 湿位涡
2.2.2 视水汽汇
3 降水概况和天气背景
3.1 降水实况
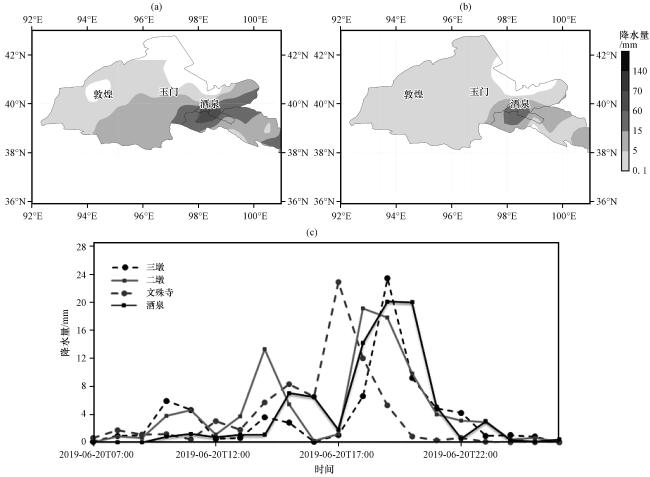
图1 2019年6月20日08:00至21日08:00(a)和20日14:00 -20:00(b)河西走廊西部降水量空间分布以及6月20日07:00至21日02:00二墩、 三墩、 文殊寺、 酒泉4个站小时降水量分布(c)(单位: mm)Fig.1 The distribution of observed precipitation in the western Gansu Corridor from 08:00 on 20 to 08:00 on 21 (a) and from 14:00 to 20:00 on 20 (b) June 2019 and the change of hourly precipitation at Erdun, Sandun, Wenshusi, Jiuquan station from 07:00 on 20 to 02:00 on 21 June 2019 (c).Unit: mm |
3.2 环流背景
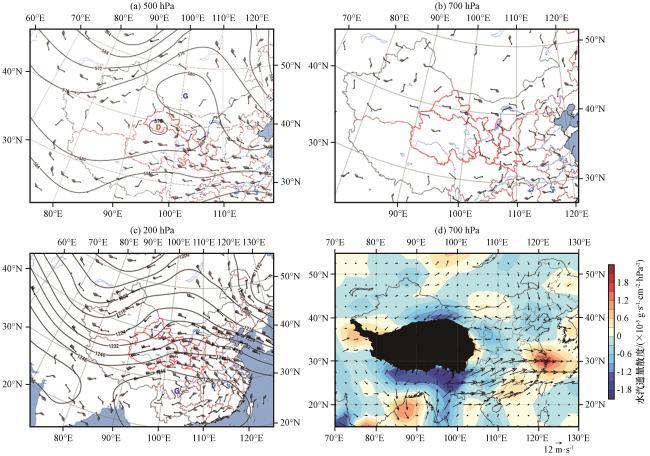
图2 2019年6月20日08:00位势高度(黑色等值线, 单位: dagpm)和风场(风羽, 单位: m·s-1)(a, c), 700 hPa风场(黑色风杆, 单位: m·s-1)(b)以及20日14:00 700 hPa水汽通量(矢量, 单位: g·cm-1·hPa-1·s-1)和水汽通量散度(彩色区, 单位: ×10-5 g·s-1·cm-2·hPa-1)(d)黑色阴影为青藏高原地形 Fig.2 Geopotential height (black contour, unit: dagpm) and winds (barb, unit: m·s-1) at 08: 00 20 June (a, c), winds (barb, unit: m·s-1) at 700 hPa (b), water vapor flux (vector, unit: g·cm-1·hPa-1·s-1) and water vapor flux divergence (color area, unit: ×10-5 g·s-1·cm-2·hPa-1) at 700 hPa at 14:00 (d) on 20 June 2019.The shaded represents Qinghai-Xizang Plateau Terrain |
表1 近10年河西走廊西部暴雨环流特征对比Table 1 The comparison of heavy rain circulation characteristics in the midwestern Gansu Corridor in the past 10 years |
| 气象要素 | 2011年6月16日 | 2012年6月5日 | 2019年6月20日 |
|---|---|---|---|
| 24 h 最大雨量/mm | 77.2(肃北) | 94.9(玉门) | 93.5(二墩) |
| 小时最大雨量/mm | 17.8(南湖) | 38.2(梁子沟) | 23.4(三墩站) |
| 低涡中心位势高度/dagpm | 576 | 572 | 576 |
| 500 hPa最大东风/(m·s-1) | 20 | 12 | 14 |
| 200 hPa高空槽经向度 | 大于10个纬度 | 小于3个纬度 | 小于3个纬度 |
| 12 h移动速度 | 4个经度 | 3个经度 | 4个经度 |
| 700 hPa温度梯度/[℃·(°E)-1] | 1.5 | 1.25 | 0.25 |
| 700 hPa最大东风/(m·s-1) | 12 | 10 | 20 |
700 hPa温度梯度指肃北到酒泉站的温度梯度; 700 hPa最大东风是酒泉东部—甘肃中部最大风 |
3.3 水汽条件
4 高空低涡诊断分析
4.1 高空低涡发展的基本物理场特征
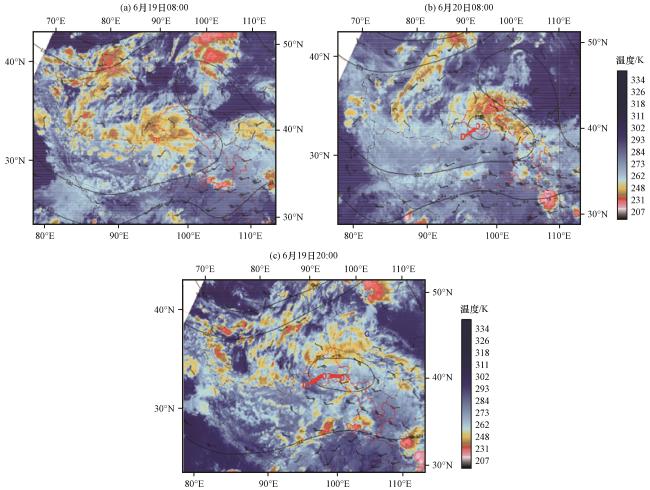
图3 2019年6月19 -20日500 hPa位势高度(黑色等值线, 单位: dagpm)、 风场(风羽, 单位: m·s-1)和FY-4A卫星红外云图(彩色区, 单位: K)D1、 D2、 D3表示19日20:00、 20日08:00、 20日20:00 500 hPa高空低涡中心位置 Fig.3 Geopotential height (black contour, unit: dagpm), winds (barb, unit: m·s-1) at 500 hPa and FY-4A Infrared satellite cloud images (color area, unit: K) from 19 to 20 in June 2019.D1, D2 and D3 are the center locations of the high-altitude vortex at 500 hPa at 20:00 on 19 June, at 08:00 on 20 June, at 20:00 on 20 June 2019 |
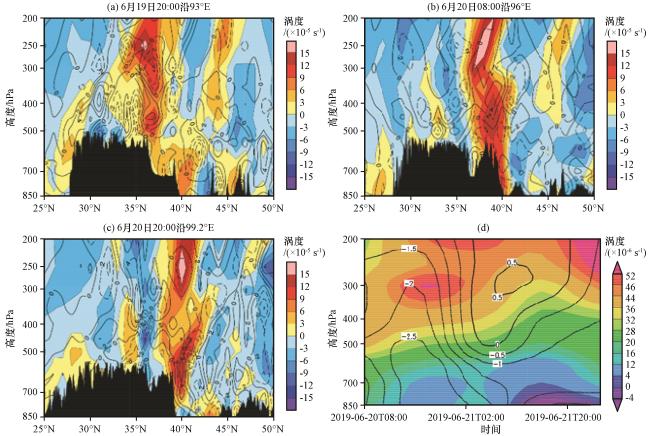
图4 高低空低涡中心的垂直涡度(彩色区, 单位: ×10-5 s-1)和散度(黑色等值线, 单位: ×10-5 s-1)经向剖面(a~c)以及暴雨中心(39.7°N, 98.7°E)的垂直涡度(彩色区, 单位: ×10-6 s-1)、 垂直速度(等值线, 单位: ×10-1 Pa·s-1)随时间的演变(d)黑色阴影为地形剖面 Fig.4 Vertical distribution of the vertical vorticity (color area, unit: ×10-5 s-1) and divergence (black contour, unit: ×10-5 s-1) in the center of high-altitude vortex (a~c), the distribution of vertical vorticity (color area, unit: ×10-6 s-1) and vertical speed (contour, unit: ×10-1 Pa·s-1) across the rainfall site (39.7°N, 98.7°E) (d).Black shadecl area is profile of topography |
4.2 高空低涡发展的热力和动力作用分析
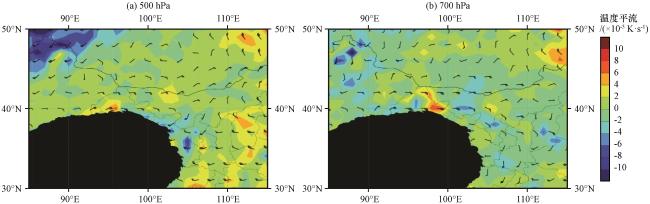
图5 2019年6月20日08:00 500 hPa(a)和700 hPa(b)温度平流(彩色区, 单位: ×10-5 K·s-1)、 风场(风羽, 单位: m·s-1)分布黑色阴影为青藏高原地形 Fig.5 The distribution of temperature advection (color area, unit: ×10-5 K·s-1), winds (barb, unit: m·s-1) at 500 hPa (a) and 700 hPa (b) at 08:00 on 20 June 2019.The shadecl represents Qinghai-Xizang Plateau Terrain |
4.3 湿位涡分析
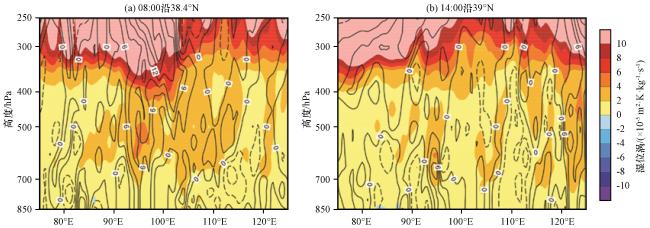
图7 2019年6月20日高空低涡中心湿位涡(彩色区, 单位: ×10-5 m2·K·kg-1·s-1)和垂直涡度(黑色等值线, 单位: ×10-5 s-1)的垂直剖面Fig.7 The cross sections of moist potential vorticity (color area, unit: ×10-5 m2·K·kg-1·s-1) and vertical vorticity (black contour, unit: ×10-5 s-1) in the center of high-altitude vortex on 20 June 2019 |
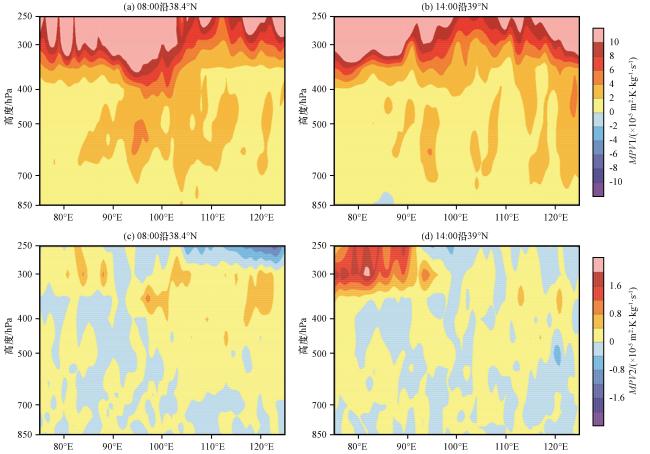
图8 2019年6月20日高空低涡中心的MPV1(a, b, 彩色区, 单位: ×10-5 m2·K·kg-1·s-1)和MPV2(c, d, 彩色区, 单位: ×10-5 m2·K·kg-1·s-1)的垂直分布Fig.8 Vertical distribution of MPV1 (a, b, color area, unit: ×10-5 m2·K·kg-1·s-1) and MPV2 (c, d, color area, unit: ×10-5 m2·K·kg-1·s-1) in the center of high-altitude vortex on 20 June 2019 |
5 局地性强降水成因
5.1 对流潜势和局地强降水演变
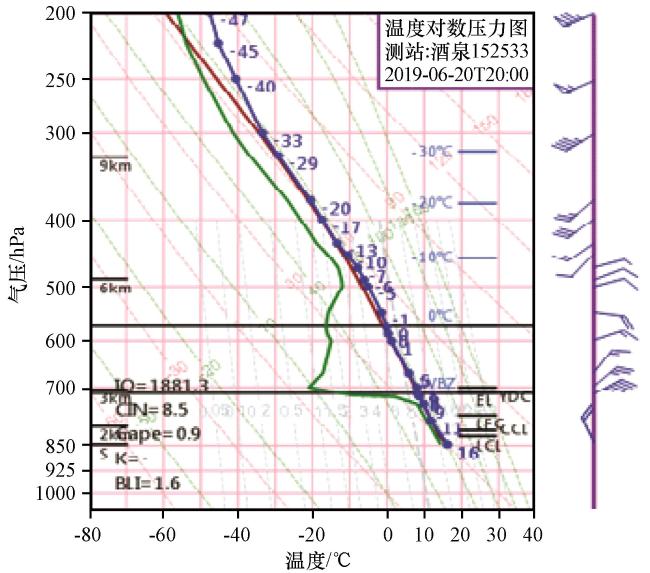
图9 2019年6月20日20:00酒泉站T-lnP图Fig.9 T-lnP at Jiuquan station at 20:00 on 20 June 2019 |
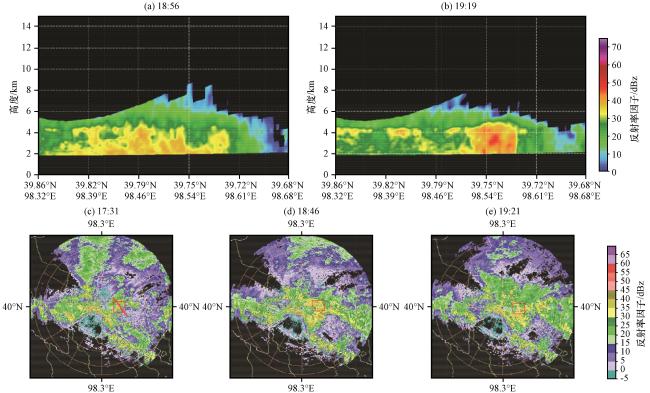
图10 嘉峪关雷达6月20日18:56(a)和19:19(b)反射率因子沿着红色直线的垂直剖面和6月20日(c~e)嘉峪关雷达0.5° 仰角的反照率因子(单位: dBz)红色方框表示暴雨区 Fig.10 Vertical profile of radar echo reflectivity factor along the red line of the Jiayuguan Radar at 18:56 (a), 19:19 (b), and radar echo reflectivity factor at 0.5° elevation of Jiayuguan Radar (c~e) on 20 June 2019.Unit: dBz.The red box denotes the rainstorm area |
5.2 局地水汽
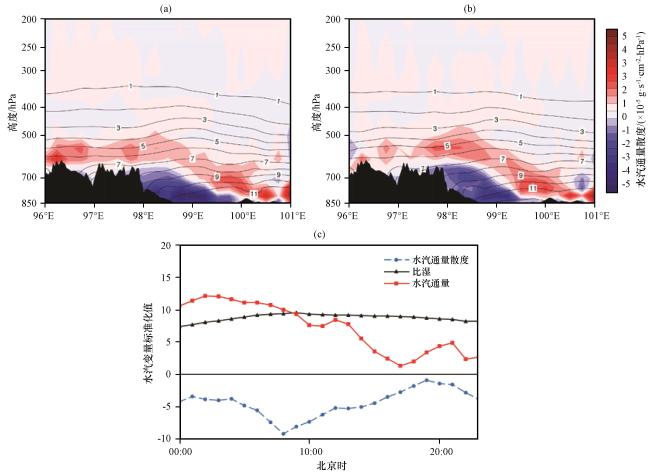
图11 2019年6月20日18:00(a)和20:00(b)沿39.6° N水汽通量散度(彩色区, 单位: ×10-5 g·s-1·cm-2·hPa-1)、 比湿(黑色等值线, 单位: g·kg-1)的垂直剖面以及酒泉站700 hPa比湿、 水汽通量和水汽通量散度随时间变化特征(c)Fig.11 Vertical cross section of the water vapor flux divergence (color area, unit: ×10-5 g·s-1·cm-2·hPa-1) and specific humidity (black contour, unit: g·kg-1) along 39.6°N at 18:00 (a) and 20:00 (b), the hourly characteristics of specific humidity and water vapor flux and water vapor flux divergence of Jiuquan Station at 700 hPa (c) on 20 June 2019 |
5.3 地形强迫
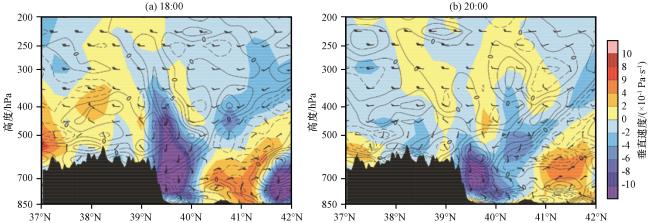
图12 2019年6月20日18:00(a)和20:00(b)沿98.7°E垂直速度(彩色区, 单位: ×10-1 Pa·s-1)、 散度(黑色等值线, 单位: ×10-5 s-1)和风场(风羽, 单位: m·s-1)的垂直剖面Fig.12 The cross section of vertical speed (color area, unit: ×10-1 Pa·s-1), divergence (black contour, unit: ×10-5 s-1) and winds field (barb, unit: m·s-1) along 98.7°E at 18:00 (a) and 20:00 (b) on 20 June 2019 |
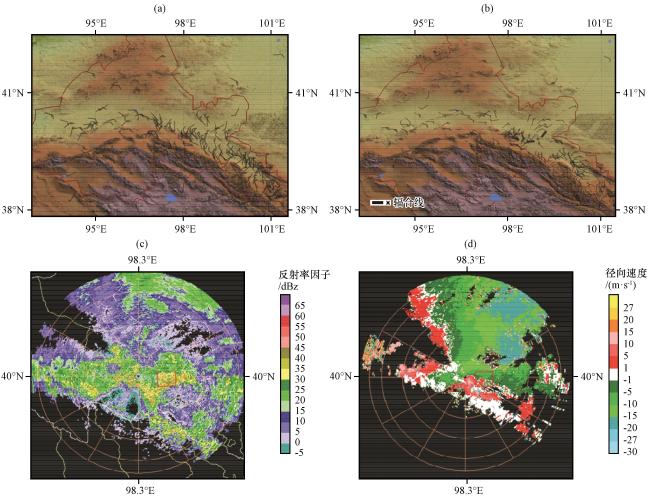
图13 2019年6月20日12:00(a)和18:00(b)地面风场(风羽, 单位: m·s-1), 以及18:23嘉峪关雷达0.5°仰角反照率因子(c, 单位: dBz)和径向速度(d, 单位: m·s-1)红色方框表示暴雨区 Fig.13 Surface winds (barb, unit: m·s-1) at 12:00 (a) and 18:00 (b), radar echo reflectivity factor (c, unit: dBz) and radial velocity (d, unit: m·s-1) of 0.5°elevation from Jiayuguan Radar at 18:23 on 20 June 2019.The red box denotes the rainstorm areas |