

1 引言
臭氧(O3)是大气中最重要的微量成分之一, 虽然臭氧在大气中所占的比例极小, 但它对太阳紫外辐射(0.2~0.29 μm)具有强烈的吸收作用。在平流层中的臭氧层能够阻挡来自太阳的强紫外辐射(Ultraviolet, UV)到达地面, 保证了地球上的动植物正常地生存和繁衍。存在于平流层中的臭氧可以吸收太阳紫外辐射使平流层大气增温, 是平流层主要的热源(陆晏等, 2017; 刘仁强等, 2018; 覃皓等, 2018), 同时平流层的热力和动力结构还可以由于臭氧吸收太阳强紫外辐射加热大气而发生变化(Andrews et al, 1987)。已知对流层上层和平流层下层的臭氧对全球气候变化有重要影响(Randel et al, 2017; Xia et al, 2018; Zhang et al, 2019)。臭氧层因其吸收能量加热的特性决定着平流层的温度场和大气环流, 并对建立大气的垂直温度结构和大气辐射平衡有十分重要的作用, 因此, 大气臭氧总量研究一直是地球科学界和化学界的研究热点。
随着全球科学技术的发展, 1985年英国南极站科学家首次发现南极臭氧洞现象, 而且在随后的1997年首次发现北极也存在着臭氧损耗(Newman et al, 1997)。实际上, 臭氧浓度低值现象不仅发生在地球南北两极, 还出现在地球“第三极”-青藏高原(Qinghai-Xizang Plateau)上空。周秀骥等(1995)利用1979 - 1991年的美国雨云气象卫星TOMS(Total Ozone Mapping Spectrometer)资料计算得到13年平均的臭氧总量月平均值时空分布, 首次发现青藏高原在夏季(6 -9月)出现臭氧亏损形成低值中心的现象, 并称其为青藏高原臭氧谷。邹捍等(2001)利用相同的卫星资料确认了青藏高原臭氧谷的存在。卞建春等(2006)还发现青藏高原冬季上空出现微型臭氧洞或臭氧极低值事件。Guo et al(2012)利用SAGEⅡ卫星资料研究臭氧谷最强中心UTLS与南压高压关系时, 发现平流层上也存在一个低值中心, 随后通过MLS(Microwave Limb Sounder)卫星资料首次确认臭氧谷双心结构。青藏高原是北半球中积雪覆盖面积最大、 纬度海拔最高的区域, 使得其具有十分显著的动力作用和热力作用, 这导致高原地表与大气 之间的相互作用和大气边界层发展过程对高原及周边地区的天气过程和气候变化的影响至关重要(马耀明等, 2021)。杨耀先等(2022)研究发现, 相较于北半球增暖, 高原增暖发生时间早, 增温速率大, 海拔依赖型增暖是导致晴空向下长波辐射的增强的主要原因之一。研究表明, 臭氧含量在青藏高原地区上空变化, 进而影响青藏高原地面所接受到的紫外辐射量。近年来, 西藏地区白内障发病人群数量不断增加, 主要原因是高原积雪和岩石对紫外线反射。因此, 了解青藏高原臭氧谷双心结构机制很有必要。
对于青藏高原夏季上空UTLS臭氧总量低值中心的形成原因, 最早是发现青藏高原臭氧谷的周秀骥通过数值模式模拟和诊断分析推断, 概括原因为局地的垂直运动所引起的物质输送以及化学作用。此前的学者已经做了许多突出的研究(刘煜等, 2001; 苏昱丞等, 2016; 仕仁睿等, 2017; 郭栋等, 2017; 万凌峰等, 2017), 其中多数认为青藏高原臭氧谷的形成主要与大气环流场内的动力输送有关, 而化学过程较弱(苏昱丞等, 2016; Bian et al, 2011; Guo et al, 2012, 郭栋等, 2017)。刘煜等(2010)研究了非均相化学过程在青藏高原夏季上空臭氧总量低值中心形成的作用, 认为青藏高原15~20 km高度内的低温通过非均相化学过程进而导致臭氧损耗加剧。邹捍等(2001)利用大气环流资料得到厄尔尼诺和南方涛动(El Niño-Southern Oscillation, ENSO)的强弱与青藏高原臭氧含量变化有关。Guo et al(2012)研究青藏高原臭氧谷受南亚高压的动力作用, 得到臭氧谷随南亚高压强度减弱、 季节移动变化而减弱、 变化。李小婷等(2019)利用观测和再分析资料, 研究中部型ENSO和平流层准两年振荡(the Quasi-Biennial Oscillation, QBO)对冬季北半球平流层臭氧的影响, 发现准两年振荡东风位相对于中部型厄尔尼诺事件影响北半球平流层臭氧的影响起着促进作用, 抑制中部型拉尼娜事件对北半球平流层臭氧的影响, 而准两年振荡西风位相与此相反, 但并未发现青藏高原冬季出现臭氧谷双心结构。Chang et al(2022)还将ENSO事件和QBO事件结合一起, 探究了二者对青藏高原臭氧谷的共同影响。
综合来看, 上述学者形成机制分析, 大多是围绕影响青藏高原臭氧某一因素来研究臭氧谷形成机制, 如大气环流动力输送、 非均相化学过程、 ENSO。但仅从一方面研究臭氧谷双心结构形成机制是不够全面的, 需要综合几个因素才能更好地探究双心结构形成机制, 特别是ENSO与南亚高压的联合作用, 导致大气环流场发生变化, 进而对UTLS区域臭氧浓度的影响, 目前还没有定论。深入研究ENSO和南亚高压对于青藏高原上空臭氧浓度变化的综合影响, 将有助于进一步理解ENSO背景下臭氧的年际变化, 并揭示相关机制。
本文总结前人提出的方法, 利用所收集到的再分析数据和资料, 对臭氧浓度资料进行平均纬向偏差, 分析UTLS附近臭氧谷双心结构年际变化趋势, 基于臭氧浓度资料, 并参考前人对臭氧谷形成机制研究的方法(刘煜等, 2001; Tian et al, 2010; 苏昱丞等, 2016; 仕仁睿等, 2017; 郭栋等, 2017; 万凌峰等, 2017), 结合厄尔尼诺年、 拉尼娜年同期和次年的海表温度场和风场资料, 叠加南压高压和剖面分析, 探讨海温和环流与青藏高原臭氧谷的关系。青藏高原臭氧谷双心结构是2015年才发现的现象(Guo et al, 2015), 且仅使用了一种卫星资料进行了统计诊断, 有较大的不确定性, 双心结构形成机制尚不明确。因此, 系统地研究夏季青藏高原臭氧谷双心结构很有意义。
2 资料来源和方法介绍
2.1 资料来源
本文研究对象为青藏高原区域, 研究范围囊括欧亚大陆、 印度洋、 部分西太平洋, 研究时段为1979 -2021年(共43年)。前人研究青藏高原UTLS附近臭氧谷所用的有TOMS卫星资料(Tian et al, 2010; 仕仁睿等, 2017)、 MLS卫星资料(郭栋等, 2017)、 臭氧监测仪( Ozone Mointoring Instrument, OMI)观测臭氧资料(仕仁睿等, 2017)、 MSR2(Multi Sensor Reanalysis)臭氧总量再分析资料(熊思章和陈权亮, 2020)。本文研究所使用的是欧洲中长期预报中心(The European Center for Medium-Range Weather Forecasts, ECMWF)提供的ERA5(ECMWF Reanalysis v5)全球再分析月平均资料, 空间分辨率为0.25°×0.25°, 垂直分层为1000~1 hPa, 共37层, 所使用的数据包括臭氧混合比(单位: kg·kg-1)、 大气三维风场、 压力、 地形高度和海洋表面温度(SST), 数据选取时间段为1979 -2021年夏季(6 -8月)。为了便于比较, 本文还使用美国国家航空航天局(National Aeronautics and Space Administration, NASA)提供的MERRA-2(Modern-Era Retrospective analysis for Research and Applications version 2)卫星资料, 空间分辨率为0.625°×0.5°, 包括臭氧质量混合比(单位: kg·kg-1)、 对流层顶动力高度(Tropopause pressure based on EPV estimate, TROPPV)和热力高度(Tropopause pressure based on thermal estimate, TROPPT), 垂直范围为1000 0.1 hPa, 数据选取时间段为1980 - 2021年夏季(6 -8月)。在讨论ENSO事件时, 所选用的中东部热带太平洋海表温度异常(Nino 3.4)资料主要来源于美国国家海洋与大气管理局(National Oceanic and Atmospheric Administration, NOAA)提供的月平均Nino 3.4指数资料(https: //psl.noaa.gov/data/climateindices/list/)。文中所有涉及的地图是基于中华人民共和国自然资源部地图技术审查中心标准地图服务系统下载的审图号为GS(2016)1664号的世界地图制作, 底图无修改。
为了更直观地比较, 本文借鉴Chang et al(2021)的方法得到臭氧柱总量(Total Column Ozone, TCO)的纬向偏差, 定义为TCO*:
式中: 为格点臭氧总量; 为臭氧的格点纬向平均, 纬向偏差=臭氧总量-纬向平均。因为大气密度随高度变化不能直接对高度积分, 所以还需要将所有臭氧浓度资料数据单位kg·kg-1进行统一处理, 处理后的单位为DU(Dobson Unit), 1 DU等于10-3大气厘米的臭氧含量。首先将臭氧质量混合比单位kg·kg-1换成ppmv(1 ppm=10-6), 然后利用下式对高度积分(Bian et al, 2011)。
式中: M为臭氧浓度(单位: ppmv); P是压强, 由于我们研究的是青藏高原UTLS附近的臭氧谷中心变化(Guo et al, 2017), 选取的高度范围是50 300 hPa, 即P 2=300 hPa, P 1=50 hPa。经统计得到, 所选高度范围内臭氧浓度占50~1000 hPa臭氧浓度总量近80%, 占1 1000 hPa臭氧浓度总量近50%, 因此研究此区域臭氧亏损、 探讨臭氧谷双心结构形成机制是有意义的。
2.2 方法介绍
本文将收集到的1979 -2021年空间分辨率0.5°×0.5°的欧洲中期预报中心(ECMWF)提供的ERA5全球月平均再分析资料和1980 -2021年美国国家航空航天局(NASA)提供的空间分辨率0.625°×0.5°MERRA-2再分析资料进行处理, 具体是将再分析资料中的臭氧质量混合比数据合成得到多年的平均气候态, 再用夏季UTLS附近的臭氧柱总量与平均气候态比较得到偏离均值的正负偏差值, 得到夏季青藏高原对流层上层平流层下层臭氧谷双心结构, 对臭氧谷双心结构进行特征分析。本文利用Nino 3.4指数对1979 -2021年共43年间进行筛选得到厄尔尼诺年和拉尼娜年, 进一步得到同期和次年的夏季青藏高原臭氧谷双心结构进行对比分析, 结合海表温度异常场和环流场合成分析青藏高原臭氧谷双心结构与厄尔尼诺和拉尼娜的相关性。
3 典型厄尔尼诺年和拉尼娜年
3.1 厄尔尼诺和拉尼娜定义
厄尔尼诺现象, 是一种在太平洋水温发生异常增暖的现象。正常年份, 西太平洋接受了足够的热量, 造成整个太平洋洋流西高东低、 西热东冷, 西太平洋上空的空气温暖而潮湿, 产生上升气流, 该地区对流活动旺盛、 降水丰富; 而东太平洋水温较低, 上方空气变低, 盛行下沉气流, 天气多为晴朗无云, 这种环流现象又叫沃克环流。当发生厄尔尼诺现象, 即沃克环流减弱时, 西北季风不仅削弱了东南信风, 还使赤道暖流南下, 造成秘鲁寒流水温反常升高即东太平洋水温升高, 这条暖流又称为“厄尔尼诺暖流”。拉尼娜现象, 也叫“反厄尔尼诺现象”, 与厄尔尼诺反相, 它是指东太平洋水温异常降温, 通常与厄尔尼诺现象交替发生, 下面将详细说明典型厄尔尼诺年和拉尼娜年份的划分。
3.2 典型厄尔尼诺年和拉尼娜年的划分
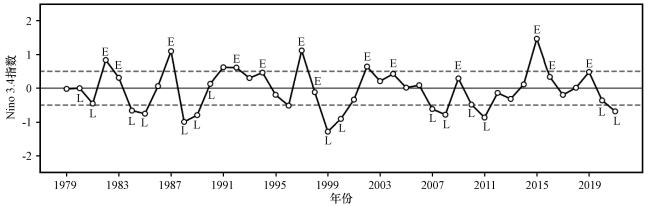
判断某月是否发生厄尔尼诺现象或拉尼娜现象, 需参照Nino 3.4指数的阈值, 该年该月的ANON指数反映的是距平值, 本文收集了时间段为1979 -2021年共43年数据, 每年包括12个月的Nino 3.4指数和ANON指数。首先需要对43年的ANON指数进行滑动平均, 得到43年每年12个月的滑动平均值, 根据官方Nino 3.4指数的判断阈值, 该月滑动平均数值大于或等于0.5则判断为发生一次厄尔尼诺现象, 发生厄尔尼诺现象的月数大于或等于5次则判断该年为厄尔尼诺年; 若该月滑动平均数值小于或等于-0.5则判断为发生一次拉尼娜现象, 发生拉尼娜现象的月数大于或等于5次则判断该年为拉尼娜年。
根据上面的判据, 我们计算了43年(1979 - 2021年)的数据, 筛选得到厄尔尼诺年份和拉尼娜年份如表1 。
表1 1979 -2021年典型厄尔尼诺年份和拉尼娜年份Table 1 Typical El Niño years and La Niña years during 1979 -2021 |
| 事件 | 年份 |
|---|---|
| 厄尔尼诺 | 1982、 1983、 1987、 1992、 1994、 1997、 1998、 2002、 2004、 2009、 2015、 2016、 2019 |
| 拉尼娜 | 1980、 1981、 1984、 1985、 1988、 1989、 1990、 1999、 2000、 2007、 2008、 2010、 2011、 2020、 2021 |
由表1 可知, 1979 -2021年内拉尼娜年份数多于厄尔尼诺年份数, 还会发现有些是厄尔尼诺或拉尼娜年份却被剔除了。本文所做的这份典型厄尔尼诺和拉尼娜年份表, 除了通过Nino 3.4指数筛选得到厄尔尼诺和拉尼娜年外, 还通过查阅文献, 将现象较弱或表现不那么强的年份挑出来, 留下厄尔尼诺和拉尼娜现象较为典型的年份。另外, 使用挑选出来典型的厄尔尼诺和拉尼娜年份, 对于本文后续探究同期和次年大气环流、 SST异常场影响青藏高原UTLS附近臭氧谷双心结构很有意义。
1979 -2021年Nino 3.4指数标准化时间序列如图1 所示。一直以来, Nino 3.4指数作为厄尔尼诺和拉尼诺现象判据得到广泛应用, 本文在此基础上, 挑选使用典型厄尔尼诺和拉尼娜气候的年份, 该做法在分析青藏高原臭氧谷双心结构形成机制是可行的, 在探究典型厄尔尼诺和拉尼娜年与青藏高原臭氧谷双心结构相关程度上具有较大的可信度。
4 青藏高原UTLS臭氧时空分布特征
4.1 青藏高原UTLS区TCO *分布
本文采用所介绍的研究方法, 首先对夏季青藏高原上对流层下平流层臭氧进行高度积分, 然后进行平均纬向偏差, 得到43年的TCO*分布:
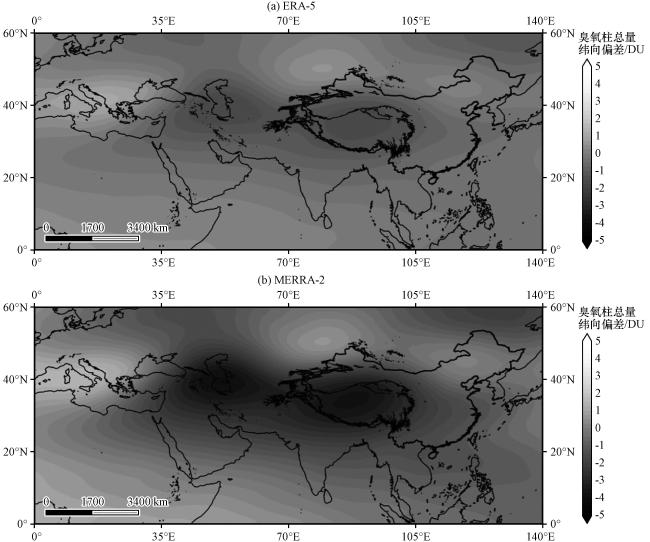
夏季青藏高原上空TCO*的43年平均分布情况如图2 所示。从两种卫星再分析资料数据处理得到TCO*平均分布图中, 可以很明显地看到青藏高原上空臭氧谷双心结构, 臭氧损耗中心分布主要在40°E -100°E、 29°N -45°N。研究发现除了在UTLS区域这一青藏高原臭氧谷最强中心之外, 还发现一个次强中心位于平流层上层(Guo et al, 2012)。图2 (a)和图2 (b)相同的是, 青藏高原上空都是呈负臭氧平均纬向偏差, 共同说明了青藏高原上空发生了臭氧总量损耗, 并形成臭氧低值中心。分布不同的是, 可以发现MERRA-2比ERA5效果更明显, 利用MERRA-2得到的臭氧谷双心结构更明显、 突出, 在使用MERRA-2得到的分布图中看到, 臭氧谷双心结构中TCO*最低可达-4.0 DU, 周边地区也可以达到-3.4 DU到-4.0 DU, 但在使用ERA5数据得到的分布图中, 臭氧谷双心结构中的TCO*最低才只有-1.6 DU左右。关于青藏高原臭氧谷的形成机制, 一直以来国内外的学者都在自己研究范围内不断提出新理论。本文后续将基于厄尔尼诺和拉尼娜这两个热带区域大气海洋异常现象, 分别从同期和次年两个时间段来对青藏高原UTLS附近臭氧分布特征进行分析。
4.2 厄尔尼诺年和拉尼娜年TCO *分布
利用Nino 3.4指数筛选得到典型厄尔尼诺年和拉尼娜年, 是为了能更好地探究厄尔尼诺和拉尼娜与青藏高原上空臭氧损耗之间的联系。
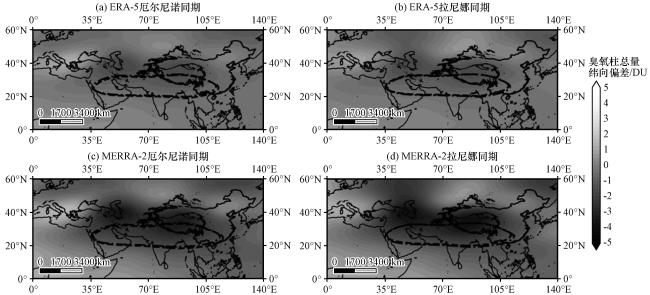
厄尔尼诺年和拉尼娜年同期的TCO*平均分布如图3 所示。首先从横向对比来看, 无论是使用ERA5数据, 还是使用MERRA-2数据得到的TCO*分布图中, 在典型厄尔尼诺年发生时, 可以很清楚地看到青藏高原上空出现臭氧低值中心, 形成臭氧谷双心结构, 图3 (a)可以看到, 臭氧低值中心最低达到-2.0 DU, 而图3 (c)的负臭氧纬向偏差最低可达到-3.6 DU; 在典型拉尼娜年发生时, 能够看见臭氧损耗程度有所加深或影响区域有所扩大, 图3 (b)臭氧低值区域有所西伸, 甚至从里海北抬到连接北极圈, 图3 (d)则更为明显, 臭氧损耗程度最低可到-4.0 DU且低值区域相比图3 (c)扩大, 总体来说, 拉尼娜年的TCO*低值分布比厄尔尼诺年更广, 臭氧损耗程度反映更为明显。最后从纵向对比来看, 在表现青藏高原臭氧谷双心结构特征方面, MERRA-2数据的效果更明显, 这也与前人研究所反映的一致(Chang et al, 2021)。在厄尔尼诺次年臭氧谷双心结构发生明显增强, 针对这种现象后续将继续探究厄尔尼诺年和拉尼娜年分别对青藏高原臭氧谷的影响。
4.3 厄尔尼诺次年和拉尼娜次年TCO *分布
本文根据前面所筛选得到典型厄尔尼诺年和拉尼娜年, 往后推一年得到典型厄尔尼诺次年和典型拉尼娜次年时间序列。使用相同的研究方法处理典型厄尔尼诺和拉尼娜次年数据, 得到次年TCO*平均分布。
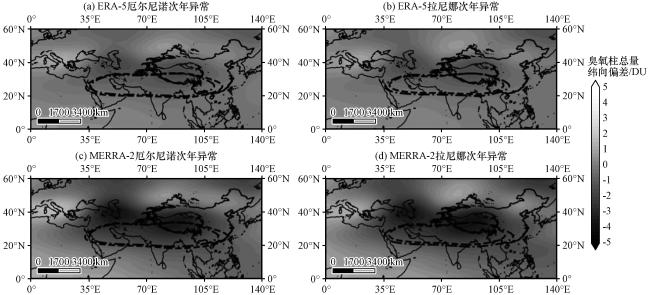
厄尔尼诺次年和拉尼娜次年TCO*平均分布情况如图4 所示。首先, 从图4 (a)表现出来的臭氧损耗低值与图3 (a)一样, 臭氧低值中心TCO*值为-1.6 DU, 但TCO*低值覆盖范围较图3 (a)有所扩大, 延伸连接至北极圈的低值数值降低。图4 (c)对比图3 (c)就能更明显地看出青藏高原上空臭氧谷双心结构加深, 负臭氧纬向偏差区域变大, 臭氧损耗呈加强趋势。与此相反, 进一步对比图4 (b)和(d)与图3 (b)和(d)发现, 青藏高原臭氧谷双心结构中心区域负臭氧纬向偏差数值降低, TCO*低值覆盖范围有所缩小, 臭氧损耗呈减弱趋势。
4.4 厄尔尼诺次年和拉尼娜次年TCO *异常分布
青藏高压又叫南亚高压, 通常见于青藏高原夏季对流层上层和平流层下层的暖性高压, 是夏季青藏高原上空对流层上部最强大、 最稳定且范围最大的暖性高压, 南亚高压加上青藏高原独特的地理优势, 通过热力、 动力作用于当地乃至周边地区上空的大气环流。雷显辉等(2022)在研究南亚高压和西太副高活动与中国东部降水关系时, 发现南亚高压与西太副高变化具有协同性, 强度指数、 面积指数变化均呈较明显的正相关, 特别是夏季南亚高压与西太副高平均位置变化具有“相向而行、 相背而去”的特点, 岑思弦等(2021)在对南亚高压演变过程及其变异机制研究展望中, 意识到现在对于南亚高压演变机制的研究过于影响单一化, 需要更关注多个因素协同作用。之前大多数学者研究认为南压高压对青藏高原臭氧谷有动力作用影响(Guo et al, 2012; 卞建春, 1997; Liu et al, 2003)。
首先从图4 (a)可以看到, 可能与厄尔尼诺次年气候有关, ERA-5数据说明了次年南亚高压相较于43年多年平均态呈加强趋势, 南压高压控制范围扩大为38°E -118°E。而拉尼娜次年南亚高压相较于多年平均态呈减弱趋势, 南压高压控制范围缩小为40°E - 109°E。然后来看图4 (c), MERRA-2数据说明了厄尔尼诺次年的南压高压相对于总的多年平均态呈加强趋势, 控制范围扩大, 但拉尼娜次年南亚高压相对多年却呈收缩减弱现象。通过图3 与图4 的对比, 也可以发现厄尔尼诺次年相比同期, TCO*低值程度有所加深, 范围有所扩大; 而拉尼娜次年相较前年, 臭氧损耗有所减弱。总而言之, 结合同期与次年数据分析可以很明显地看出当南压高压在高原上空稳定且控制加强时, 青藏高原上空臭氧谷双心结构加深; 当南压高压在高原上空减弱时, 青藏高原上空臭氧谷双心结构变浅。下面将会继续探究两者关系和影响机制, 验证前人的理论(郭栋等, 2012)。
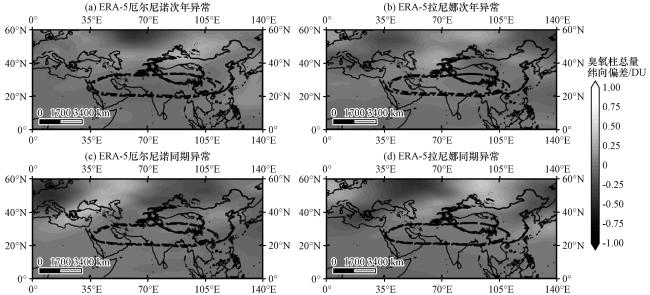
厄尔尼诺和拉尼娜次年TCO*异常分布如图5 所示。图中黑色点划线圈是43年南亚高压多年平均态, 虚线圈分别为厄尔尼诺、 拉尼娜次年南压高压多年平均态。本文通过使用厄尔尼诺次年和拉尼娜次年多年数据得到的TCO*与图2 (a)的43年总的平均纬向偏差做差值处理, 得到TCO*异常值。图5 说明了当厄尔尼诺次年气候变化结合南压高压加强, 高压所控制的范围TCO*值较多年异常偏小, 这些可以从图5 (a)明显看出; 而图5 (b)呈现出相反的结果, 拉尼娜次年气候背景下, 南压高压减弱, TCO*值较多年异常偏大。
4.5 厄尔尼诺次年和拉尼娜次年O3 异常分布
结合上面的图文分析, 已经对厄尔尼诺现象、 拉尼娜现象还有南压高压与青藏高原上空臭氧谷之间的关系有了大致的了解, 下面将从O3总量[注: (1)式中的O]入手, 单独分析厄尔尼诺次年、 拉尼娜次年还有南压高压与其之间的关系。本文臭氧分布特征分析到这里, 发现整体分析效果还不够好, 对于青藏高原臭氧谷双心结构的特征分析还不足够, 便对厄尔尼诺次年和拉尼娜次年的O3进行年际异常分析, 得到图如下:
厄尔尼诺次年和拉尼娜次年O3异常分布情况如图6 所示。O3分布大部分较多年异常偏小, 甚至在利用MERRA-2数据得到的图6 (c)中发现北极圈附近有一处异常极低值中心, 不排除与北极发现的臭氧洞有联系, 在赤道附近异常低值最低可达-0.8 DU, 青藏高原上空原臭氧谷双心结构处也是呈异常偏小情况。然后对比[图6 (b), (d)]来看, 拉尼娜次年的O3分布呈异常偏大情况, 效果也很明显。汪明圣和郭世昌(2017)为了研究ENSO不同位相对东亚地区平流层臭氧的影响, 利用NOAA和ECMWF提供的臭氧浓度资料, 重点分析了ENSO对于东亚地区平流层臭氧影响的滞后性, 研究发现El Niño和La Niña显著影响东亚地区平流层臭氧的分布, 且滞后8个月的影响相关性达到最大; El Niño发生8个月后中低纬地区平流层臭氧显著减少, 而La Niña发生8个月后中低纬度平流层臭氧显著增加。最后基于图6 结合前面图表进行分析:
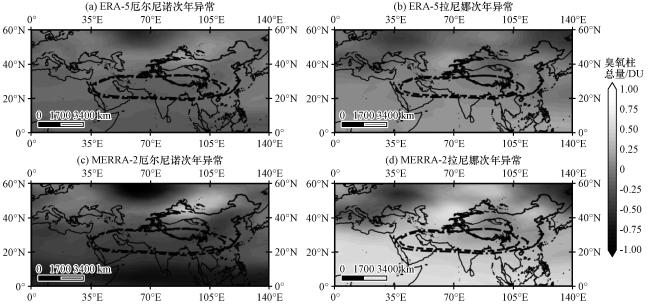
典型厄尔尼诺气候对于研究区域特别是青藏高原地区的臭氧损耗和臭氧低值中心的形成起着不可或缺的作用; 而典型拉尼娜年气候与臭氧异常偏大也有一定的关系, 这些都与图3 和图4 的分析相符。
在典型厄尔尼诺次年, 位于青藏高原上空200 hPa高度的南亚高压较多年平均态呈异常加强趋势, 从而导致下方控制的臭氧较多年异常偏少; 但在典型拉尼娜次年, 南压高压较多年平均态呈减弱趋势, 臭氧较多年异常偏大, 这些分析都与图3 和图4 以及前人研究的结论相符。
综上所述, 厄尔尼诺和拉尼娜气候结合南压高压对青藏高原上空UTLS附近的臭氧低值中心形成的影响基本了解, 但臭氧谷双心结构机制总体认识还不够全面, 还需要进一步探究, 下面将在厄尔尼诺次年和拉尼娜次年气候背景场下, 结合大气环流场、 平均海表温度异常场以及特定经度剖面图进行成因分析。
5 青藏高原UTLS臭氧谷双心结构对比成因分析
5.1 200 hPa与850 hPa环流场叠加SST异常
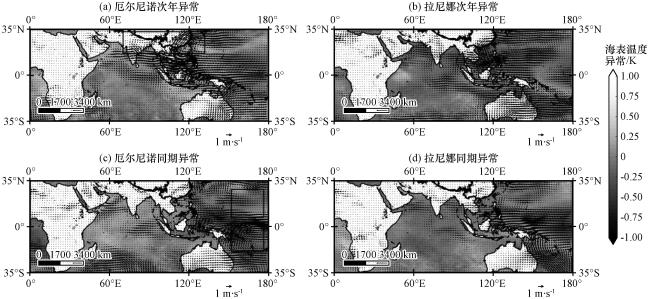
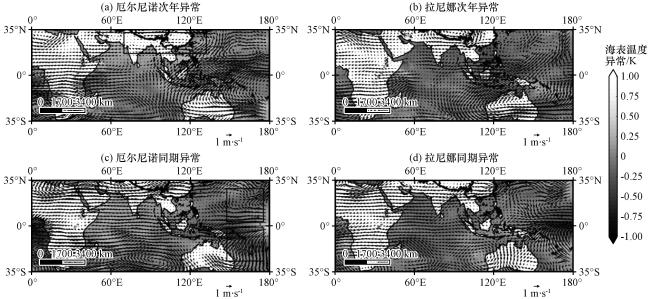
厄尔尼诺现象, 是由于气候异常, 导致东太平洋海水温度异常升高; 而拉尼娜现象则使东太平洋海水温度异常降低。这两种太平洋反常气候现象, 其中的平均海表温度异常(Sea Surface Temperature Anomaly, SSTA)会造成海洋大气之间热力差, 而形成大气环流场垂直输送和水平输送, 进而影响到大气成分乃至全球气候的变化。
厄尔尼诺同期、 次年SSTA合成风场分布情况如图7 所示, 图7 (a)和图7 (b)分别为厄尔尼诺次年和拉尼娜次年分布图, 图7 (c)和图7 (d)分别为厄尔尼诺年和拉尼娜年同期分布图。在图7 (c)和图7 (d)中, Nino 3.4区海温异常分布基本符合厄尔尼诺年和拉尼娜年太平洋海水温度变化情况。在厄尔尼诺年时[图7 (c)], 赤道附近和东太平洋海平面温度较多年异常偏高; 而西太平洋的SSTA值为负值, 根据大气运动对海洋热量的胁迫作用即吉尔机制, 较为暖和的西太平洋SSTA异常负值影响了该区域, 从而形成了沿赤道对称的气旋和反气旋发生在图7 (c)黑色正方框中, 低纬度的气旋顺势加强了高纬度的反气旋, 形成一系列的沿赤道向西传播的罗斯贝波。
5.2 50°E与90°E合成风场
为了验证厄尔尼诺次年、 拉尼娜次年大气环流场的变化, 本文将从50°E和90°E纬度高度剖面图上分析, 进而得到更好的结论。
合成风场和臭氧异常沿50°E的纬度高度剖面分布情况如图9 所示。图中黑色虚线是热力对流层的高度, 实线是动力对流层的高度。在厄尔尼诺次年即图9 (a)所示, 可以看到从20°N -40°N, 在青藏高原上空, 风场将低浓度臭氧从上对流层输送到下平流层, 导致UTLS区域中的TCO*异常降低。与此对比, 在拉尼娜次年时期[图9 (b)], 风场将高浓度的臭氧从下平流层输送到上对流层, 导致UTLS区域臭氧普遍异常偏高, 青藏高原上空TCO*异常升高。
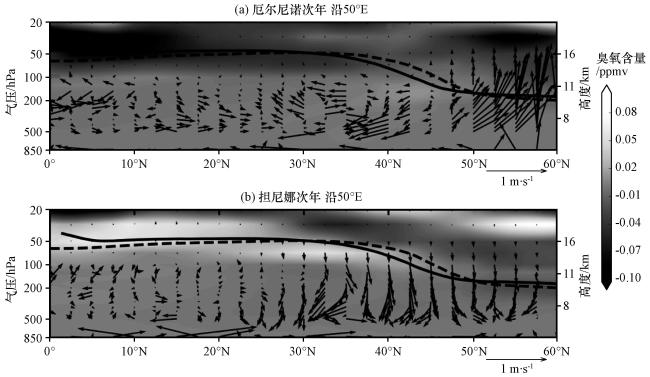
图9 沿50°E合成风场(矢量, 单位: m·s-1)的纬度-高度剖面阴影表示臭氧含量(单位: ppmv), 实线为动力对流层顶, 虚线为热力对流层顶 Fig.9 The latitude-height cross-sections of the synthetic wind field along 50°E (vectors, unit: m·s-1). Shadow representsozone content (unit: ppmv), solid lines represents dynamical tropopause, dashed lines represents thermal tropopause |
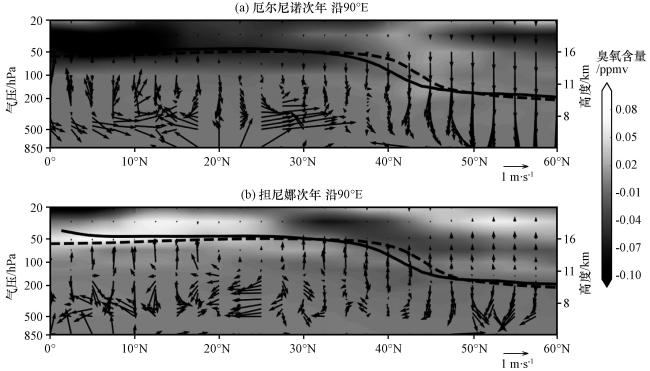


图10 沿90°E合成风场(矢量, 单位: m·s-1)的纬度-高度剖面图阴影表示臭氧含量(单位: ppmv), 实线为动力对流层顶, 虚线为热力对流层顶 Fig.10 The latitude-height cross-sections of the synthetic wind field along 90°E (vectors, unit: m·s-1). Shadow representsozone content (unit: ppmv), solid lines represents dynamical tropopause, dashed lines represents thermal tropopause |
6 结论
ENSO是全球气候年际、 年代际异常变化的显著信号, 能够造成全球气候发生变化, 而这种影响是一种持续时间较长的现象, 因此对大气环流的影响也是持续性的。在将ENSO同期和次年的臭氧时空分布和强度变化进行对比分析的基础上, 分析了南压高压、 平均海表温度异常和大气环流对青藏高原上空臭氧的影响程度, 探讨了ENSO与青藏高原上空UTLS地区臭氧亏损的关系, 对青藏高原臭氧谷双心结构形成机制有了更进一步的认识。综合上述所有分析, 得出以下主要结论:
(1) 夏季青藏高原UTLS区域臭氧损耗中心主要分布在40°E -100°E、 29°N -45°N, 典型厄尔尼诺气候会加强对青藏高原UTLS区域臭氧损耗的影响, 而典型拉尼娜气候影响则会减弱对青藏高原UTLS区域臭氧损耗的影响。
(2) 在典型厄尔尼诺次年, 南亚高压较多年平均态呈加强趋势, 控制范围变大, 青藏高原UTLS区域臭氧谷双心结构加深, 即臭氧损耗加剧; 典型拉尼娜次年情况则相反, 南亚高压较多年平均态呈减弱趋势, 臭氧损耗程度减弱。典型厄尔尼诺气候对于青藏高原UTLS区域臭氧谷双心结构形成起着积极的作用, 典型拉尼娜气候的影响则是消极的。
(3) 在典型厄尔尼诺年, 西太平洋中的SSTA负值影响低纬度气旋生成然后加强高纬度反气旋, 从而形成罗斯贝波沿赤道向西输送至印度洋, 在次年加强青藏高原背后的孟加拉湾槽, 使得低层气流辐合上升, 风场将低浓度臭氧从上对流层输送到下平流层, 导致青藏高原UTLS区域臭氧减少; 而典型拉尼娜次年情况与此相反, 减弱了对青藏高原上空臭氧的影响。
(4) 在厄尔尼诺次年, 在50°E和90°E风场纬度高度剖面图上, 风场输送臭氧从上对流层到下平流层, 促进了青藏高原UTLS区域臭氧损耗, 导致臭氧异常偏低; 而在拉尼娜次年, 风场从平流层输送臭氧到上对流层, 导致青藏高原UTLS区域臭氧异常偏高。