

1 引言
2 数据来源与方法介绍
2.1 数据来源
2.2 研究方法
3 结果与讨论
3.1 暴雨变化特征
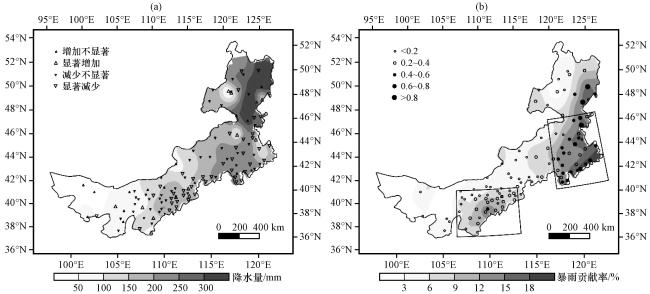
图1 内蒙古夏季降水量分布(阴影, 单位: mm)及变化趋势(三角, 单位: mm·a-1)(a)和暴雨贡献率(阴影, 单位: %)及暴雨年平均次数(圆点, 单位: 次·a-1)(b)(b)中西部和东部方框范围分别为(37.5°N -41.4°N, 106.5°E -113.5°E)和(41.0°N -47.0°N, 118.0°E -124.0°E) Fig.1 Spatial distribution (the shaded, unit: mm) and linear trend (triangle, unit: mm·a-1) of summer precipitation (a), and contribution rate of rainstorm (the shaded, unit: %) and annual mean number of rainstorm (circle dot, unit: times·a-1) (b) in Inner Mongolia.In Fig.1(b), the box ranges are as follows respectively (37.5°N -41.4°N, 106.5°E -113.5°E) and (41.0°N -47.0°N, 118.0°E -124.0°E) |
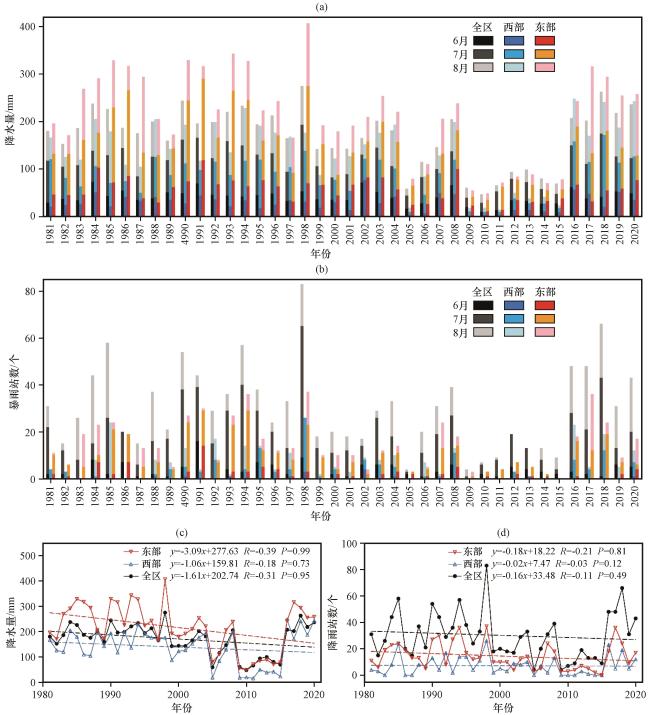
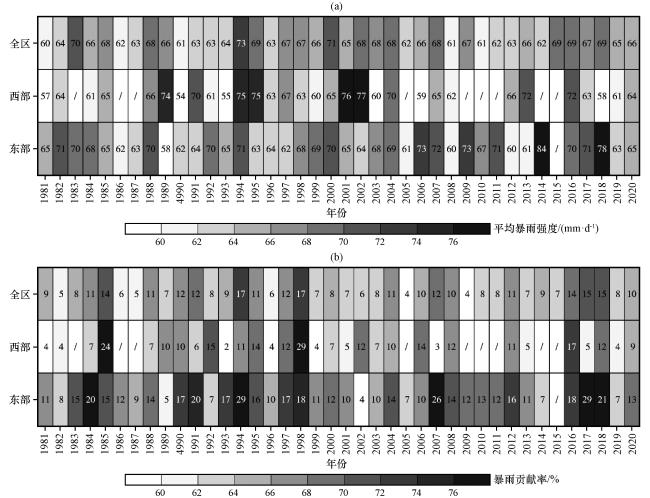
表1 极端暴雨事件统计表Table 1 Statistics of extreme rainstorm events |
| 年份 | 发生极端暴雨事件日期/[月-日(站数/个)] | 极端暴雨降水量/mm |
|---|---|---|
| 1981 | 07-02; 07-31; 08-14(2) | 113.6; 50.3; (77.5; 77.4) |
| 1982 | 06-27; 07-26; 07-27 | 77.2; 78.1; 82.5 |
| 1983 | 07-14; 08-05(2), 08-14, 08-23; 08-28 | 133.1; (98.8; 73.2); 100.5; 63.7; 119.4 |
| 1984 | 06-17(2个); 07-04; 08-02(3); 08-09; 08-11(9); 08-13; 08-26 | (74.7; 96.4); 87.4; (64.1; 62.1; 76.3); 65.1; (72.1; 92.9; 126.3; 89.5; 119; 119.5; 120.9; 98.3; 139.6); 80.5; 98.7 |
| 1985 | 07-17; 07-29; 07-31; 08-20; 08-25(6) | 66.9; 80.4; 83; 128.1; (68.3; 61.9; 83.1; 64.1; 99.7; 74.7) |
| 1986 | 06-27; 07-06 | 79.7; 73.3 |
| 1987 | 08-15; 08-20 | 78.3; 150.4 |
| 1988 | 06-27; 07-23; 08-05; 08-06; 08-07(3); 08-17; 08-30; 08-31 | 58.5; 107.9; 94.2; 80.7; (118.9; 90.2; 78.5); 113.1; 62.3; 74.3 |
| 1989 | 07-21; 07-23; 08-23 | 129.3; 62.9; 100.6 |
| 1990 | 07-14; 07-15(2); 07-26; 08-28(2); 08-29(2) | 98.1; (125.7; 108.9); 70.8; (88; 71.7); (79.1; 63.6) |
| 1991 | 06-11; 06-12; 07-19; 07-23; 08-15 | 111.9; 84.1; 81.8; 109.9; 92.8 |
| 1992 | 07-26; 08-08(2); 08-12 | 110.2; (108.2; 90.6); 55.5 |
| 1993 | 06-29(2); 07-09; 07-18(2); 07-19; 07-31 | (114.9; 94.6); 91.1; (71.1; 67.1); 93.3; 111.6 |
| 1994 | 06-26; 07-06; 07-13(6); 07-14(2); 07-22; 07-28(2); 08-13 | 85.5; 113.1; (183.4; 100.5; 151.4; 126; 131.6; 123); (125.5; 182.3); 142.9; (86.9; 110); 74.5 |
| 1995 | 06-21; 06-29; 07-14; 07-18; 07-29(2); 08-31 | 97.5; 99.1; 58.9; 117.1; (114.2; 75.7); 91.7 |
| 1996 | 06-20; 07-28 | 91; 76.4 |
| 1997 | 07-31; 08-09; 08-10; 08-14(2); 08-15(2); 08-28(3) | 78; 104.2; 115.5; (100.1; 55); (92.6; 82.3); (94.1; 84.6; 92) |
| 1998 | 06-24; 07-05; 07-06; 07-13(5); 07-14; 08-10; 08-11; 08-19 | 72.7; 86.7; 72; (97.1; 114.7; 107.7; 71; 150.7); 95.7; 98.8; 85.4; 116.2 |
| 1999 | 07-08; 07-12; 07-21 | 79.2; 70.1; 89.9 |
| 2000 | 07-08; 08-12; 08-13 | 71.8; 113.3; 142.3 |
| 2001 | 08-19(2) | (85.9; 71.5) |
| 2002 | 07-23; 07-31 | 88.1; 129.8 |
| 2003 | 06-27(2); 07-26; 07-27; 08-06 | (75.2; 70.6); 96.8; 91.8; 133.6 |
| 2004 | 06-30; 07-05; 07-16; 08-03; 08-12; 08-21(2) | 81.3; 123.5; 128; 85.2; 110.6; (85.3; 85.3) |
| 2006 | 07-05; 07-18; 08-07; 08-12 | 96.4; 86.2; 67; 89.6 |
| 2007 | 07-01; 08-09 | 128.6; 112.1 |
| 2008 | 07-31(4); 08-10 | (86.5; 86.5; 72.9; 51.2); 73.4 |
| 2012 | 07-21; 07-28(2); 07-29 | 89; (81; 108.7); 76.4 |
| 2013 | 07-23; 07-28(2) | 80.5; (114.9; 82.5) |
| 2014 | 06-18 | 81.4 |
| 2015 | 07-19; 08-15 | 102.8; 80.3 |
| 2016 | 07-08; 07-12; 07-21(3); 07-25; 08-07; 08-15(2); 08-18(2) | 109.1; 102.4; (89.7; 142.3; 111.7); 70.3; 97.7; (87; 57.2); (68.9; 89.6) |
| 2017 | 07-07; 07-08(2); 07-26; 08-03(3); 08-04(2); 08-12; 08-15 | 92.6; (101.3; 82.9); 70.1; (276.6; 120.8; 154.8); (126.3; 123.8); 106.6; 102.7 |
| 2018 | 06-16; 07-04(2); 07-17; 07-20(2); 07-23; 07-24(2); 07-25(5); 08-28(3); 08-29 | 86.3; (76.4; 79.9); 109.7; (95.7; 62); 60.2; (74.5; 66.9); (103.3; 101.5; 120.3; 89.5; 104.1); (70.3; 95.7; 80.7); 143.1 |
| 2019 | 06-22; 06-26; 08-07; 08-21 | 68.9; 62.9; 130.9; 96.2 |
| 2020 | 07-03; 07-17(2); 07-31; 08-04; 08-12; 08-14; 08-30 | 105.6; (98.9; 77.6); 79.4; 83.8; 66.1; 68.3; 66.8 |
阴影表示极端暴雨事件发生在3个站点以上 |
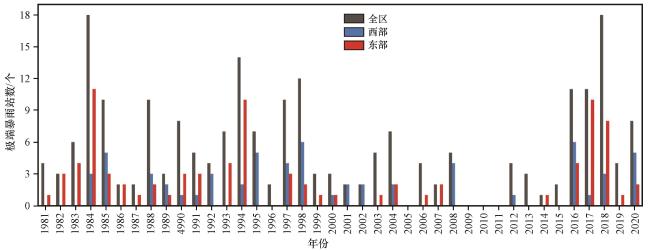
表2 极端暴雨过程统计表Table 2 Statistical table of extreme rainstorm process |
| 日期(年-月-日) | 暴雨站点区域 | 暴雨站数 /个 | 极端暴雨 站数/个 | 最大日降水量/mm(08:00 -20:00/20:00 -08:00/08:00 -08:00) |
|---|---|---|---|---|
| 1984-08-01至1984-08-02 | 阿拉善盟、 鄂尔多斯市、 巴彦淖尔市、 包头市 | 6 | 3 | 磴口(76.3/0.0/76.3) |
| 1984-08-10至1984-08-11 | 赤峰市、 通辽市、 呼伦贝尔市 | 14 | 9 | 宝国图(0.3/139.3/139.6) |
| 1985-08-24至1985-08-25 | 呼和浩特市、 鄂尔多斯市、 包头市、 乌兰察布市、 锡林郭勒盟 | 16 | 6 | 呼和浩特(59.4/40.3/99.7) |
| 1988-08-06至1988-08-07 | 呼伦贝尔市 | 7 | 3 | 鄂伦春旗(57.1/61.8/118.9) |
| 1994-07-12至1994-07-13 | 赤峰市, 通辽市 | 12 | 6 | 青龙山(105.4/78.0/183.4) |
| 1997-08-27至1997-08-28 | 兴安盟 | 3 | 3 | 胡尔勒(0.3/93.8/94.1) |
| 1998-07-12至1998-07-13 | 鄂尔多斯、 包头市、 呼和浩特市、 乌兰察布市、 赤峰市 | 20 | 5 | 土默特左旗(2.1/148.6/150.7) |
| 2008-07-30至2008-07-31 | 巴彦淖尔市, 鄂尔多斯, 包头市, 呼和浩特市 | 10 | 4 | 达拉特旗(21.8/64.7/86.5) |
| 2016-07-20至2016-07-21 | 赤峰市, 通辽市 | 7 | 3 | 八里罕(92.5/49.8/142.3) |
| 2017-08-02至2017-08-03 | 赤峰市, 通辽市 | 6 | 3 | 青龙山(253.0/23.6/276.6) |
| 2018-07-24至2018-07-25 | 锡林郭勒盟、 赤峰市、 通辽市、 兴安盟 | 13 | 5 | 阿鲁科尔沁旗(83.6/36.7/120.3) |
| 2018-08-27至2018-08-28 | 包头市、 锡林郭勒盟、 赤峰市 | 5 | 3 | 多伦(66.5/29.2/95.7) |
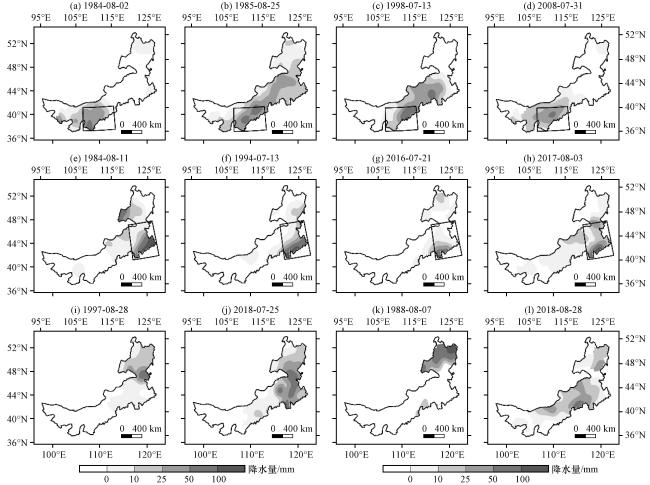
3.2 典型暴雨过程中动力因子特征分析
表3 动力因子与24 h观测降水空间相关系数Table 3 Spatial correlation coefficients between dynamical parameters and 24 hour precipitation |
| 动力因子 | 西部地区 | 东南部地区 | 东部其他地区 | |||||||||
|---|---|---|---|---|---|---|---|---|---|---|---|---|
| 1984-08-02T02:00 | 1985-08-24T20:00 | 1998-07-12T20:00 | 2008-07-31T02:00 | 1984-08-10T20:00 | 1994-07-13T08:00 | 2016-07-21T02:00 | 2017-08-03T08:00 | 1988-08-07T02:00 | 1997-08-27T20:00 | 2018-07-24T14:00 | 2018-08-28T02:00 | |
| 湿热力平流参数(mtp) | 0.75 | 0.63 | 0.57 | 0.82 | 0.73 | 0.67 | 0.85 | 0.67 | 0.57 | 0.31 | 0.33 | 0.76 |
| 热力垂直螺旋度(helth) | 0.50 | 0.44 | 0.52 | 0.61 | 0.64 | 0.78 | 0.74 | 0.61 | 0.43 | 0.38 | 0.44 | 0.46 |
| 热力散度垂直通量(wptediv) | 0.53 | 0.38 | 0.57 | 0.55 | 0.64 | 0.75 | 0.74 | 0.73 | 0.48 | 0.40 | 0.40 | 0.61 |
| 热力波作用密度(wavepte) | 0.68 | 0.67 | 0.61 | 0.78 | 0.74 | 0.82 | 0.85 | 0.73 | 0.55 | 0.42 | 0.49 | 0.77 |
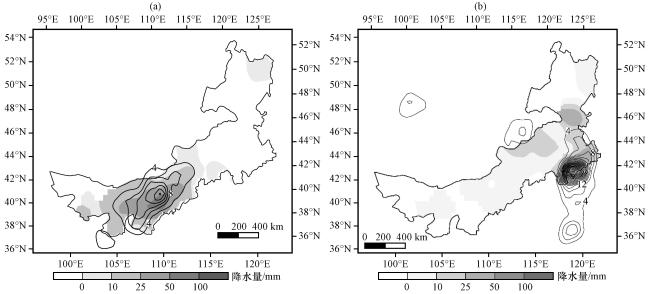
图6 内蒙古西部(a)和东南部(b)极端暴雨过程中热力波作用密度(等值线, 单位: ×10-10 K·Pa·m-2·s-1)与24 h降水量(阴影, 单位: mm)的空间分布Fig.6 Spatial distribution of thermodynamic wave activity density (contour, unit: ×10-10 K·Pa·m-2·s-1) and 24-hour precipitation (the shaded, unit: mm) of typical rainstorm processes in the western (a) and southeastern (b) Inner Mongolia |
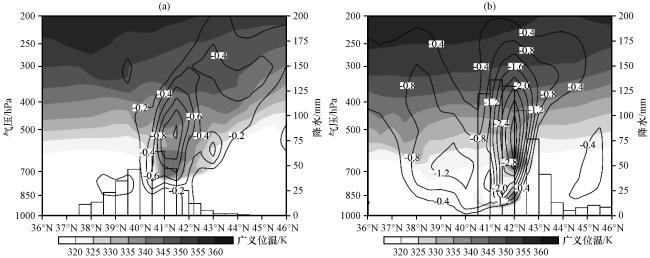
图7 西部(a)和东南部(b)广义位温(阴影, 单位: K)、 垂直速度(等值线, 单位: Pa·s-1)与24 h降水量(柱状图, 单位: mm)沿110°E和120°E的径向垂直剖面图Fig.7 The cross sections of generalized potential temperature (the shaded, unit: K), vertical velocity (contour, unit: Pa·s-1), and 24-hour precipitation (column, unit: mm) along 110°E and 120°E of typical rainstorm processes in the western (a) and southeastern (b) Inner Mongolia |
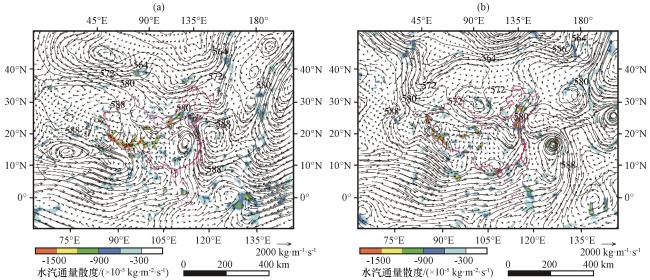


图8 西部(a)和东南部(b)典型暴雨过程的500 hPa位势高度(等值线, 单位: dagpm)、 整层水汽通量(矢量, 单位: kg·m-1·s-1)及水汽通量散度(彩色区, 单位: ×10-5 kg·m-2·s-1)Fig.8 Spatial distribution of 500 hPa geopotential height (contour, unit: dagpm), vertically integrated water vapor flux (vector, unit: kg·m-1·s-1) and divergence (color area, unit: ×10-5 kg·m-2·s-1) of typical rainstorm processes in the western (a) and southeastern (b) Inner Mongolia |