

1 引言
2 降水特征分析
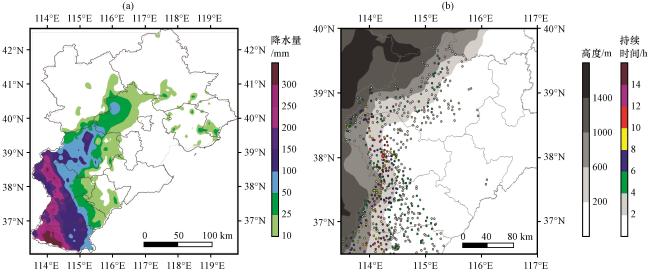
图1 2021年7月20日08:00至22日20:00河北省中南部过程降水量(a, 阴影区, 单位: mm)和小时雨强≥10 mm·h-1持续时间(b, 彩色点, 单位: h)的空间分布(b)中阴影表示地形高度(单位: m) Fig.1 The spatial distribution of rainfall in middle-south of Hebei province between 08:00 on 20 and 20:00 on 22 July 2021 (a, the shaded, unit: mm) and precipitation duration of hourly rainfall intensity greater than 20 mm·h-1 (b, color dots, unit: h).The shaded in (b) indicates terrain height (unit: m) |
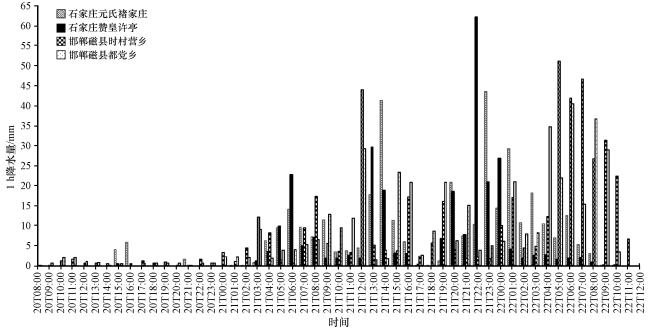
3 环流背景与大气层结
3.1 环流背景
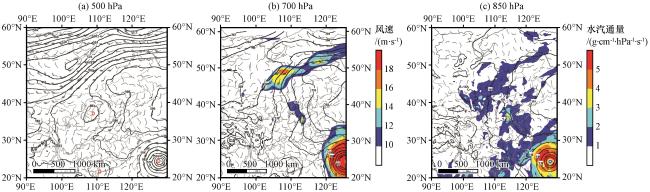
图3 2021年7月21日08:00位势高度(黑色等值线, 单位: dagpm)和风场(风羽, 单位: m·s-1)(a)中字母D表示低值中心; (b)中彩色区表示700 hPa≥10 m·s-1大风速区(单位: m·s-1); (c)中彩色区表示850 hPa水汽通量(单位: g·cm-1·hPa-1·s-1) Fig.3 Geopotential height (black contour, unit: dagpm) and horizontal wind vectors(barb, unit: m·s-1) at 08:00 on 21 July 2021 (a)500 hPa (b)700 hPa (c)850 hPa.The letter “D” in (a) indicates low value center; the colored area in (b) indicates wind speed larger than 10 mm·s-1 at 700 hPa (unit: m·s-1); the colored area in (c) indicates water vapor flux field at 850 hPa (unit: g·cm-1·hPa-1·s-1) |
3.2 大气层结和对流参数
表1 2021年7月19日20:00至22日20:00邢台探空对流参数Table 1 Convection parameters at Xingtai radiosonde station from 20:00 on19 to 20:00 on 22 July 2021 |
| 时间 | CAPE /(J·Kg-1) | CIN /(J·Kg-1) | K指数 /℃ | LI /℃ | LCL /hPa |
|---|---|---|---|---|---|
| 19日20:00 | 2523.7 | 0 | 25.8 | -5.58 | 959.6 |
| 20日08:00 | 691.3 | 30.9 | 34.4 | -2.58 | 969.7 |
| 20日20:00 | 1925.5 | 0 | 34.6 | -4.18 | 986.5 |
| 21日08:00 | 12.1 | 0 | 34.8 | 1.29 | 989.5 |
| 21日20:00 | 54.1 | 46.3 | 37.7 | 0.21 | 988.2 |
| 22日08:00 | 237.8 | 3.6 | 35.9 | -0.31 | 988.8 |
| 22日20:00 | 39.2 | 14.3 | 28.4 | 0.7 | 950.4 |
4 风场特征分析
4.1 地面辐合线和露点温度锋区
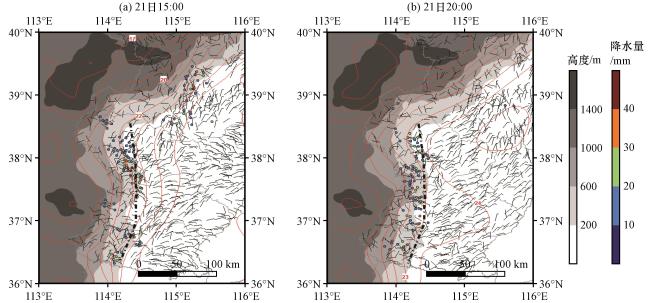
图4 2021年7月21日15:00和20:00 ≥10 mm·h-1小时降水量(彩色点, 单位: mm)和地面10 m风场(风羽, 单位: m·s-1)的站点分布红色等值线表示地面露点温度等值线(单位: ℃), 点断线表示地面辐合线, 阴影区表示地形高度(单位: m) Fig.4 The station distribution of hourly rainfall intensity greater than 10 mm·h-1 (color dots, unit: mm) and surface 10 m wind field(barb, unit: m·s-1) at 15:00 and 20:00 on 21 July 2021.The red dashed line indicates surface dew point temperature(unit: ℃), dash-dotted line indicates surface convergence line, the shaded indicates terrain height (unit: m) |
4.2 水平风的垂直分布及低空急流
4.2.1 风廓线雷达水平风垂直分布
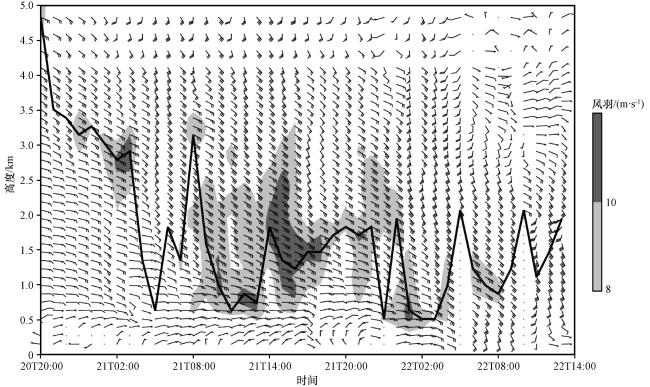
图5 2021年7月20日20:00至22日14:00石家庄风廓线雷达逐小时水平风(风羽, 单位: m·s-1)的垂直分布阴影区表示≥8 m·s-1东风风量(单位: m·s-1), 黑实线表示最大东风风量高度(单位: km) Fig.5 The vertical distribution of hourly horizontal wind (bard, unit: m·s-1) of Shijiazhuang wind profile radar from 20:00 on 20 to 14:00 on 22 July 2021.The shaded indicates east wind area of larger than 8 m·s-1 (unit: m·s-1), black solid line indicates height of maximum east wind (unit: km) |
4.2.2 低空垂直风切变
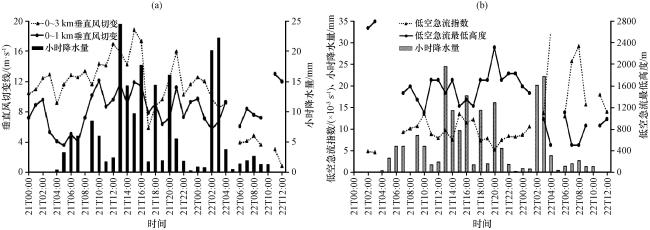
图6 2021年7月21日00:00至22日12:00石家庄小时降水量与0~1 km和0~3 km垂直风切变(a)及低空急流指数和低空急流最低高度(b)逐小时演变曲线Fig.6 The time evolution of hourly rainfall and wind vertical shear of 0~1 km and 0~3 km (a) and low-level jet index and minimum height of low-level jet (b) in Shijiazhuang from 00:00 on 21 to 12:00 on 22 July 2021 |
4.2.3 低空急流
5 水汽条件分析
5.1 水汽空间分布
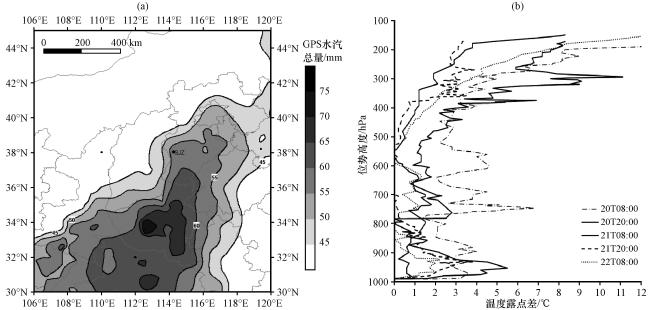
图7 2021年7月21日20:00 GPS水汽总量(单位: mm)的空间分布(a)与7月20日08:00至22日08:00邢台L波段探空站温度露点差(单位: ℃)层结曲线(b)Fig.7 The distribution of GPS water vapor(unit: mm) at 20:00 on 21 July 2021 (a) and difference curve of temperature and dew point (unit: ℃) at Xingtai radiosonde station from 08:00 on 20 to 08:00 on 22 July 2021(b) |
5.2 探空水汽垂直层结
5.3 地基GPS/MET反演水汽总量
6 雷达回波特征分析
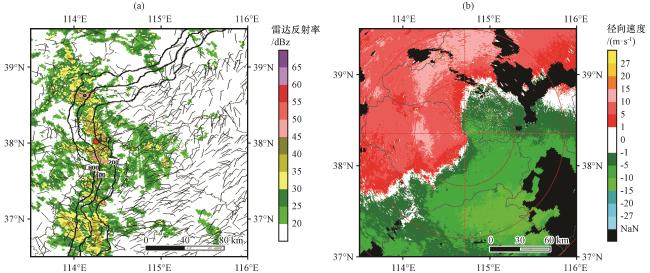


图9 2021年7月21日20:30石家庄天气雷达1.5°仰角≥20 dBz反射率(阴影区 单位: dBz)、 地面10 m风场(风羽 单位: m·s-1)和地形高度(等值线 单位: m)(a)以及1.5°仰角径向速度(b, 彩色区, 单位: m·s-1)(a)中红点表示石家庄站 Fig.9 The radar echo in Shijiazhuang at 20:30 on 21 July 2021 reflectivity larger than 20 dBz at 1.5° elevation(the shaded, unit: dBz), wind field at 10 m height(barb, unit: m·s-1) and line of terrain height(contour, unit: m) (a), radial wind velocity at 1.5° elevation(b, colored area, unit: m·s-1).The red dot in (a) indicates station of Shijiazhuang |