

1 引言
2 资料选取和方法介绍
2.1 资料选取
2.2 WRF模式
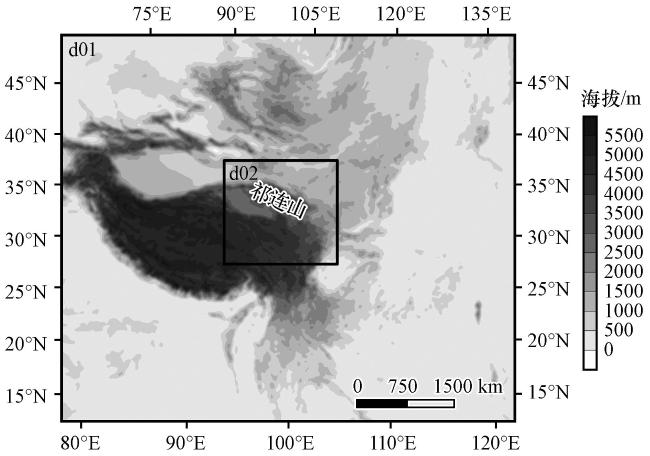
图1 WRF模式嵌套网格和地形高度(阴影, 单位: m)Fig.1 WRF mode nested grid and terrain height (shaded, unit: m) |
表1 数值模拟的详细参数设置Table 1 Detailed parameter setting of numerical simulation |
| 参数 | 设置(d01、 d02) | 解释 |
|---|---|---|
| 启动时间 | 27_12(UTC)、 28_00 | |
| 网格分辨率 | 18、 6 km | |
| 时间积分步长 | 54 s | |
| 微物理过程 | mp_physics=4 | WSM 5-class 方案 |
| 积云过程 | cu_physics=0 | 未使用 |
| 陆面过程 | sf_surface_physics=2 | 统一Noah陆面模型 |
| 边界层 | bl_pbl_physics=1 | YSU 方案 |
| 近地面层 | sf_sfclay_physics=1 | MM5 Monin-Obukhov 方案 |
| 长波 | ra_lw_physics=1 | RRTM 方案 |
| 短波 | ra_sw_physics=1 | Dudhia |
2.3 地形降水机制诊断
3 降水实况及WRF模式模拟检验
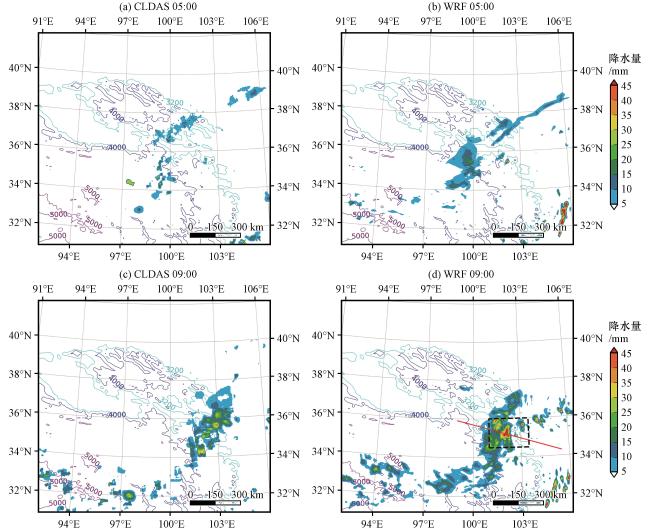
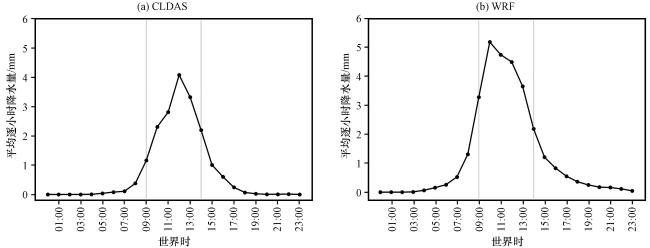
图4 CLDAS 和WRF模拟的2019年7月28日不同时刻的3 h累积降水(阴影, 单位: mm)和地形高度(等值线, 单位: m)图中青色、 蓝色、 紫色线分别为3200、 4000、 5000 m等值线, 红色线为剖面基线, 虚线框为强降水区 Fig.4 3 h cumulative precipitation (shaded, unit: mm) and terrain height (contour, unit: m) simulated by CLDAS and WRF at different times on 28 July 2019.The contour lines of cyan, blue and purple are 3200, 4000 and 5000 m respectively, the red line is the profile baseline, the dotted box shows the heavy precipitation area |
4 高低空系统的诊断
4.1 中尺度高空影响系统
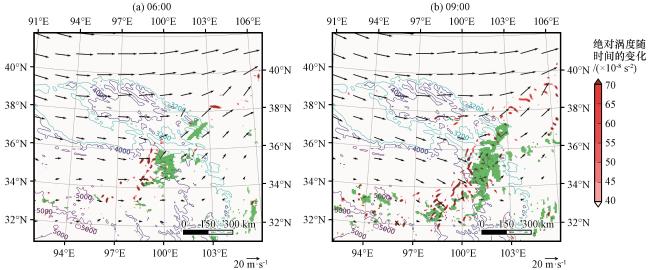
图6 2019年7月28日不同时刻的400 hPa风场(矢量, 单位: m·s-1)、 绝对涡度随时间的变化(红色阴影, 单位: ×10-8 s-2)、 3 h累积降水(绿色打点区域, 降水量大于10 mm)以及地形高度(等值线, 单位: m)的叠加图青色、 蓝色、 紫色分别为3200 m、 4000 m、 5000 m等值线 Fig.6 Superposition of 400 hPa wind (vector, unit: m·s-1), absolute vorticity varies with time (red colored, unit: ×10-8 s-2), 3 h cumulative precipitation (green dotted area, precipitation greater than 10 mm) and terrain height (contour, unit: m) at different times on 28 July 2019.The contour lines of cyan, blue and purple are 3200 m, 4000 m and 5000 m respectively |
4.2 低层局地尺度动力条件
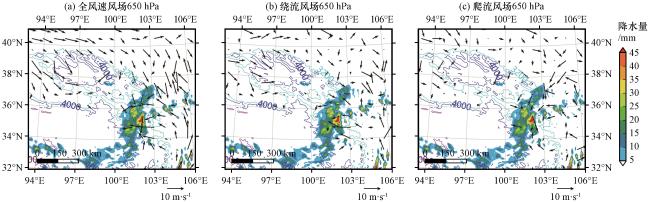
图7 2019年7月28日09:00的3 h累积降水(彩色区, 单位: mm)、 风场(矢量, 单位: m·s-1)以及地形高度(等值线, 单位: m)青色、 蓝色、 紫色分别为3200 m、 4000 m、 5000 m等值线 Fig.7 3 h cumulative precipitation (colored area, unit: mm), wind field (vector, unit: m·s-1) and terrain height (contour, unit: m) at 09:00 on 28 July 2019.The contour lines of cyan, blue and purple are 3200 m, 4000 m and 5000 m respectively |
5 水汽输送和收支
5.1 水汽输送
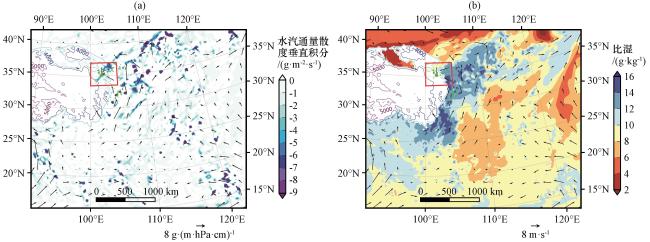
图8 2019年7月28日10:00的地面到600 hPa的水汽通量散度的垂直积分(彩色区, 单位: g·m-2·s-1)和700 hPa水汽通量(矢量, 单位: g·s-1·hPa-1·cm-1)(a), 700 hPa的比湿(彩色区, 单位: g·kg-1)和风场(矢量, 单位: m·s-1)(b)绿色打点区域为降水量大于30 mm 的3 h累积降水, 青色、 蓝色、 紫色线分别为3200 m、 4000 m、 5000 m等值线, 红色框包括了强降水区 Fig.8 The vertical integral of the divergence of water vapor flux from the ground to 600 hPa (colored area, unit: g·m-2·s-1) and 700 hPa water vapor flux (vector, unit: g·s-1·hPa-1·cm-1) (a), the specific humidity of 700 hPa (colored area, unit: g·kg-1) and wind field (vector, unit: m·s-1) (b) at 10:00 on 28 July 2019.The green dotted area represents 3 hours of accumulated precipitation that is greater than 30 mm.The contour lines of cyan, blue and purple are 3200 m, 4000 m and 5000 m respectively.The red box includes heavy precipitation areas |
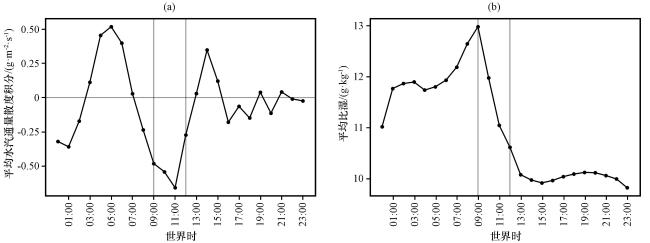
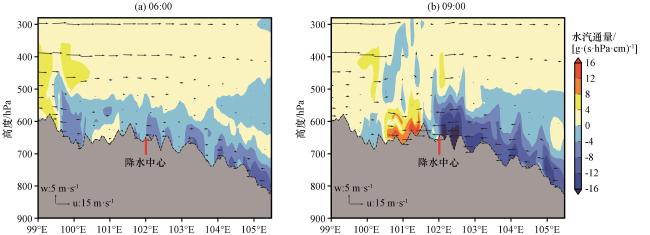
图10 2019年7月28日不同时刻过降水中心的剖面上垂直风速(矢量, 单位: m·s-1)、 纬向风风速(矢量, 单位: m·s-1)、 水汽通量(彩色区, 单位: g·s-1·hPa-1·cm-1)以及地形特征(灰色)的叠加红色箭头所指位置为降水中心 Fig.10 Superposition of vertical wind speed (vector, unit: m·s-1), zonal wind (vector, unit: m·s-1), water vapor flux (colored area, unit: g·s-1·hPa-1·cm-1) and topographic features (gray) over the precipitation center profile at different times on 28 July 2019.The position indicated by the red arrow is the precipitation center |
5.2 水汽收支
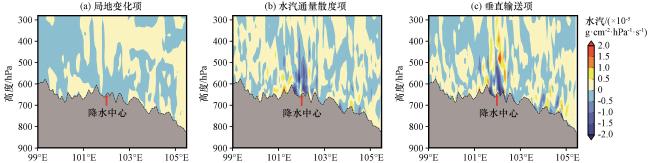
图11 2019年7月28日09:00过降水中心水汽局地变化项(a)水汽通量散度项(b)、 水汽垂直输送项(c)的剖面图(单位: ×10-5 g·cm-2·hPa-1·s-1)灰色阴影为地形, 红色箭头所指位置为降水中心 Fig.11 Local variation term of water vapor (a), water vapor flux divergence term (b) and vertical transport term of water vapor (c) over the precipitation center profile(×10-5 g·cm-2·hPa-1·s-1) at 09:00 on 28 July 2019.The superposition of topographic characteristics (gray), the position indicated by the red arrow is the precipitation center |
6 大气层结稳定度
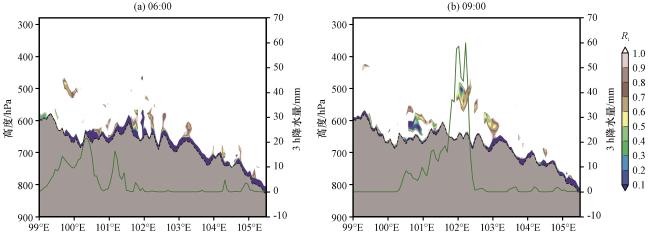


图12 2019年7月28日不同时刻过降水中心剖面上理查森数Ri (彩色区)、 地形特征(灰色)和3 h累积降水量(绿色线)的叠加图Fig.12 The superposition of Richardson number Ri (colored area), topographic characteristics (gray) and 3 h cumulative precipitation (green line) over the precipitation center profile at different times on 28 July 2019 |