1 引言
2 识别算法
3 观测数据及质量控制
表 1 激光雷达主要性能参数Table 1 Lidar main parameters |
| 主要性能 | 参数 |
|---|---|
| 波长 | 1.54 μm |
| 扫描方式 | PPI、 RHI、 DBS、 FixedLOS、 Composite |
| 方位角范围 | 0°~360° |
| 俯仰角范围 | -10°~190° |
| 角度分辨率 | 0.1° |
| 最大探测距离 | 14000 m |
| 最小探测距离 | 400 m |
| 距离库长 | 200 m |
| 径向风速范围 | -30~30 m∙s-1 |
| 径向风速精度 | <0.5 m∙s-1 |
4 低空风切变事件统计分析
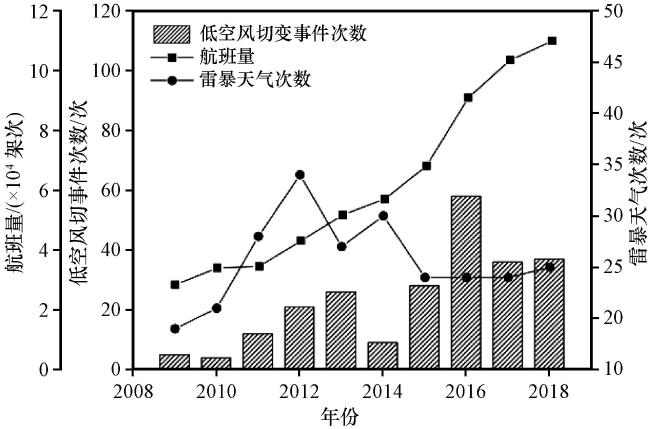
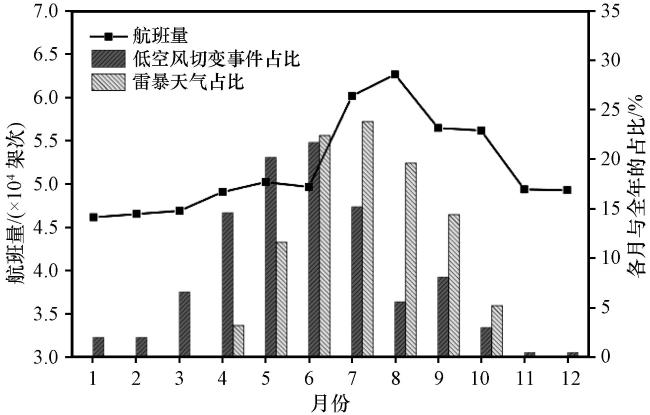
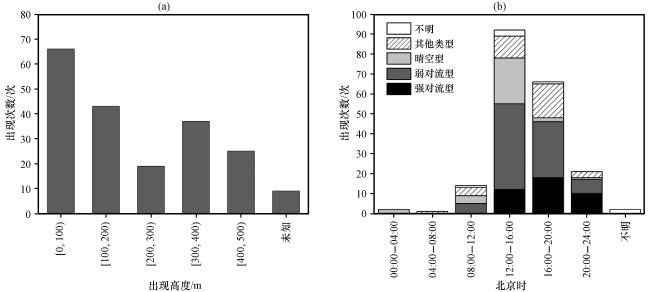
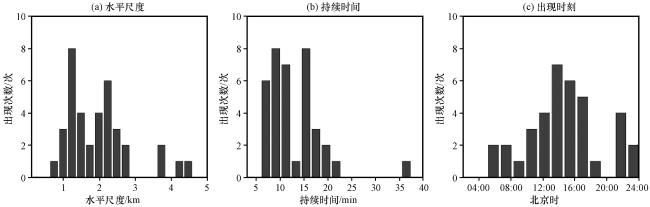
5 低空风切变识别与讨论
5.1 二维合成风切变算法识别
表2 观测期间二维合成风切变算法识别情况Table 2 Recognition of 2D synthetic wind shear algorithm during the trial operation |
| 序号 | 时间 | 出现位置 | 类型 | 固定窗口方法 | 自适应窗口方法 | 未识别原因 |
|---|---|---|---|---|---|---|
| 1 | 2016-05-28T15:11 | 36 | 弱对流型 | Y | Y | |
| 2 | 2016-06-02T15:18 | 36 | 强对流型 | Y | Y | |
| 3 | 2016-06-08T14:15 | 36 | 强对流型 | Y | Y | |
| 4 | 14:27 | 36 | 强对流型 | Y | Y | |
| 5 | 2016-06-10T17:58 | 36 | 强对流型 | N | N | 太远, 激光雷达信息不全 |
| 6 | 2016-06-12T14:41 | 18 | 强对流型 | Y | Y | |
| 7 | 14:46 | 36 | 强对流型 | Y | Y | |
| 8 | 2016-06-14T14:28 | 36 | 弱对流型 | Y | Y | |
| 9 | 2016-06-16T23:29 | 36 | 晴天型 | N | N | 晴天湍流, 激光雷达信号弱 |
| 10 | 2016-07-01T11:17 | 36 | 弱对流型 | Y | Y | |
| 11 | 2016-07-15T16:00 | 36 | 强对流型 | Y | Y | |
| 12 | 2016-09-03T13:10 | - | 弱对流型 | N | N | 起飞阶段, 激光雷达信息不全 |
| 13 | 2016-09-10T12:51 | 36 | 强对流型 | Y | Y | |
| 14 | 12:56 | 36 | 强对流型 | Y | Y | |
| 15 | 2016-09-20T16:17 | 36 | 弱对流型 | Y | Y | |
| 16 | 2016-10-15T19:28 | 36 | 弱对流型 | Y | Y | |
| 17 | 19:31 | 36 | 弱对流型 | Y | Y | |
| 18 | 20:50 | 36 | 弱对流型 | Y | Y |
N表示未能识别, Y表示成功识别 |
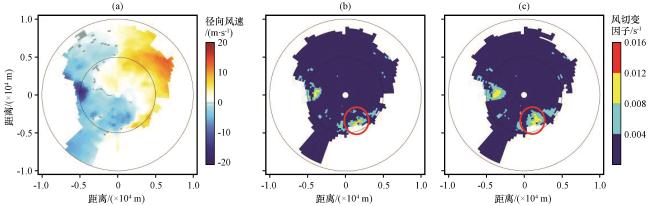
图4 2016年7月1日11:17平扫模式下(PPI)径向风速(a, 单位: m∙s-1), 基于固定窗口方法(b)和自适应窗口方法(c)的二维合成风切变(单位: s-1)识别图红色圈表示航空器遭遇低空风切变的位置 Fig.4 PPI radial wind speed map (a, unit: m∙s-1) and the 2D synthetic wind shear (unit: s-1) identification map (b~c) based on fixed window method (b) and adaptive window method (c) at 11:17 on July 1, 2016.Red circle indicates the location where aircraft encounters low-level wind shear |
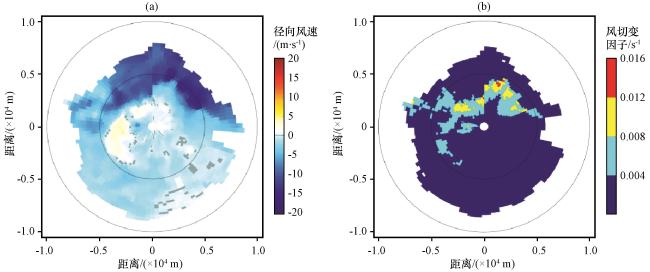
图5 2016年6月27日15:40 平扫模式下(PPI)径向风速图(a, 单位: m∙s-1)和基于自适应窗口方法的二维合成风切变识别图(b, 单位: s-1)Fig.5 PPI radial wind speed map (a, unit: m∙s-1) and the 2D synthetic wind shear identification map (b, unit: s-1) based on adaptive window method at 15:40 on June 27, 2016 |
5.2 典型风切变个例分析
5.2.1 天气过程背景分析
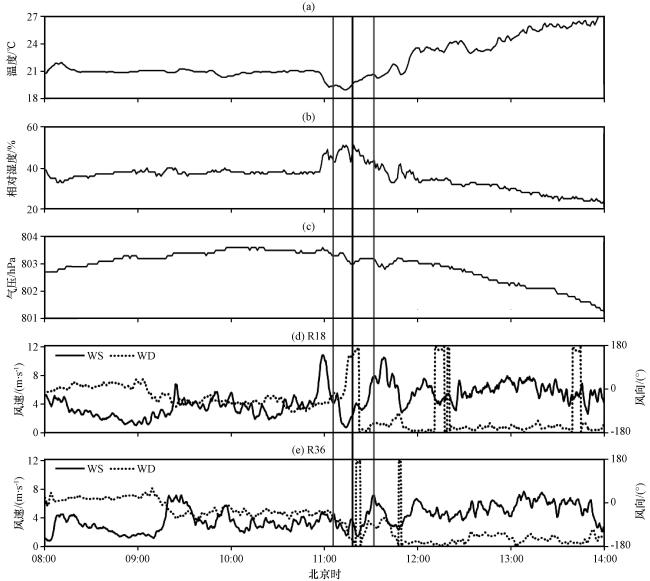
图7 2016年7月1日08:00 -14:00气象要素温度(a, 单位: ℃)、 相对湿度(b, 单位: %)、 气压(c, 单位: hPa), 以及R18(d)、 R36(e)跑道两分钟平均风速(单位: m∙s-1)和风向[单位: (°)] 随时间的演变灰色区间(11:05 -11:32)表示低空风切变演变区间; 黑色竖线为发生低空风切变的时刻 Fig.7 Evolution of meteorological elements temperature (a, unit: ℃), relative humidity (b, unit: %), air pressure (c, unit: hPa), and two-minute average wind speed (unit: m∙s-1) and wind direction [unit: (°) ]at runways R18 (d) and R36 (e) over time from 08:00 to 14:00 on July 1, 2016.The gray range (11:05 -11:32) represents the interval of low-level wind shear evolution.The black vertical line indicates the moment when low-level wind shear occurs |
5.2.2 采用二维合成风切变算法的识别分析
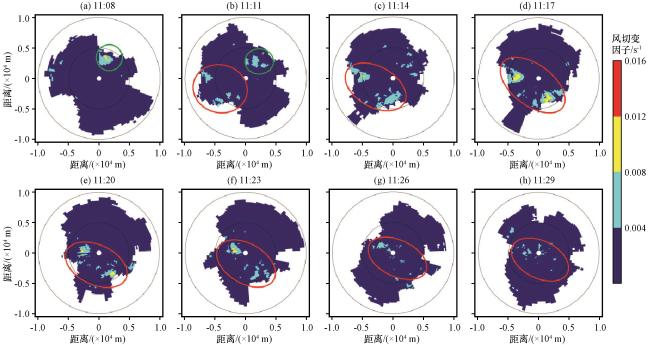
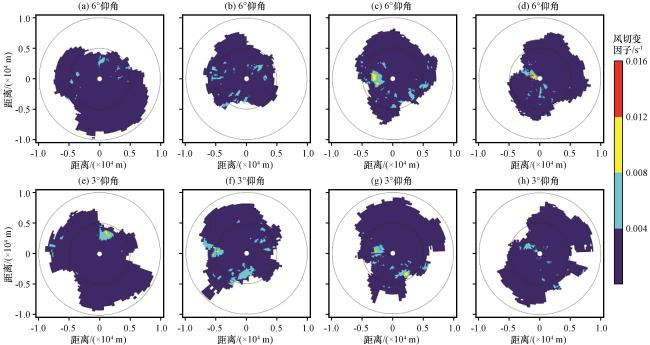
图9 2016年7月1日11:08 -11:25期间二维合成风切变识别结果空间分布(单位: s-1)Fig.9 Spatial distribution of 2D synthetic wind shear identification maps (unit: s-1) during 11:08 -11:25 on 1 July 2016 |
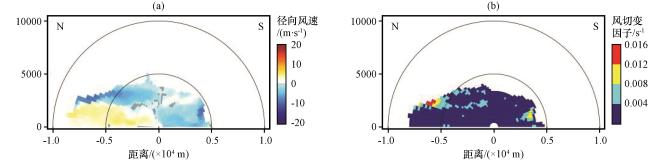
图10 2016年7月1日11:16方位角为360°~180°的距离高度显示产品(RHI)的径向风速图(a, 单位: m∙s-1)和二维合成风切变识别图(b, 单位: s-1)Fig.10 Radial wind speed map (a, unit: m∙s-1) and 2D synthetic wind shear identification map (b, unit: s-1) in Range Height Indicator (RHI) with azimuth angle of 360°~180° at 11:16 on 1 July 2016 |