1 引言
2 资料来源和方法介绍
2.1 数据来源
2.2 方法介绍
3 结果分析
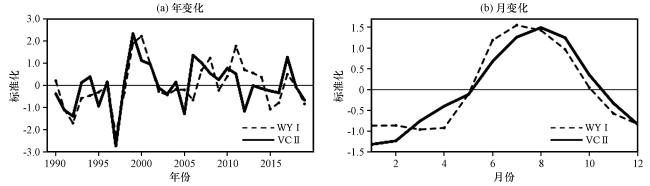
3.1 南亚季风强弱年的选取
3.2 不同时期高原垂直环流的差异
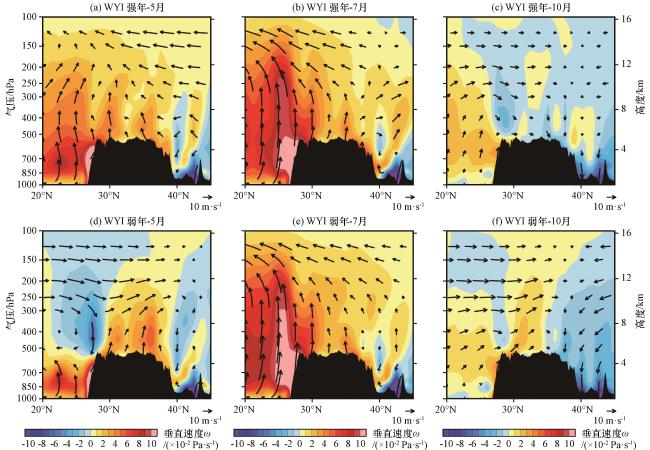
图2 WYI强弱年不同发展期沿80°E -100°E平均的经向垂直环流彩色区为垂直速度ω(单位: ×10-2 Pa∙s-1), 矢量为v、 ω合成风速(单位: m·s-1)Fig.2 Average latitudinal vertical circulation at 80°E -100°E for different periods of WYI strength years.The color areas are vertical velocities ω (unit: ×10-2 Pa∙s-1), and the vectors are v, ω synthetic wind speed (unit: m·s-1) |
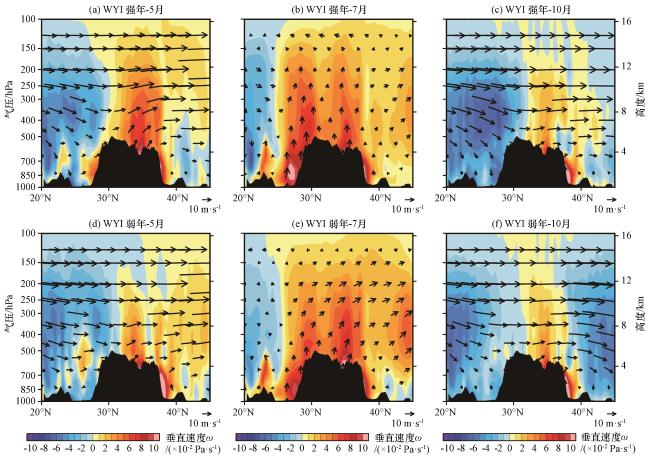
图3 WYI强弱年不同时期25°N -35°N平均纬向垂直环流彩色区为垂直速度ω(单位: ×10-2 Pa∙s-1), 矢量为u、 ω合成风速(单位: m·s-1)Fig.3 Mean longitudinal vertical circulation at 25°N -35°N during different years of WYI strength and weakness.The color areas are vertical velocities ω (unit: ×10-2 Pa∙s-1), and the vectors are u, ω synthetic wind speed (unit: m·s-1) |
3.3 不同时期高原能量输送状况
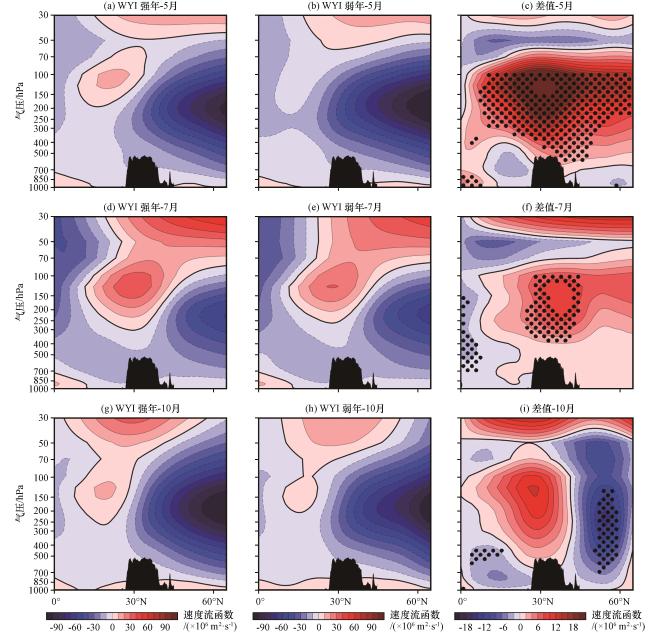
图4 WYI强弱年不同发展期高原范围速度流函数及其差值的平均纬向剖面(单位: ×106 m2∙s-1)打点处为通过90%显著性检验区域Fig.4 Highland-wide mean latitudinal profiles of the flow functions and their differences for different development periods in WYI strong and weak years.Unit: ×106 m2∙s-1.The point is the area that passes the 90% significance test |
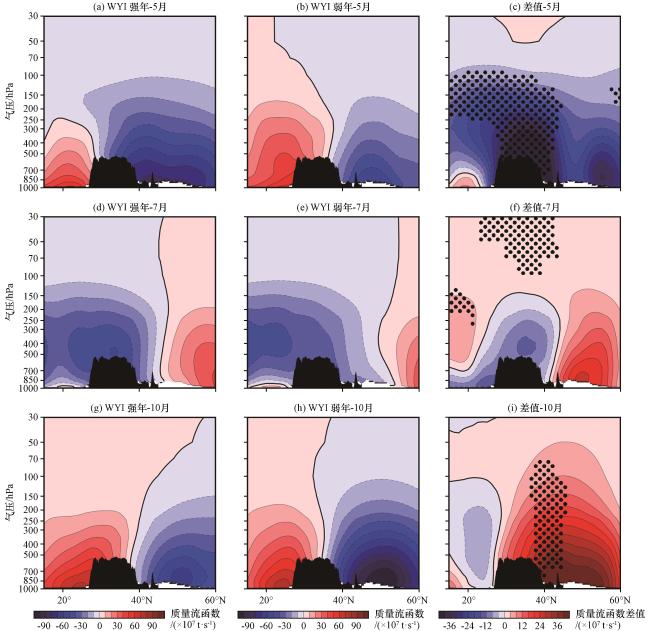
图5 WYI强弱年不同发展期高原范围质量流函数及其差值的平均纬向剖面(单位: ×107 t∙s-1)打点处为通过90%显著性检验区域Fig.5 Plateau-wide mean latitudinal profiles of mass flow functions and their differences for different development periods in WYI strong and weak years.Unit: ×107 t∙s-1.The point is the area that passes the 90% significance test |
3.4 南亚季风影响高原垂直环流的环流背景分析
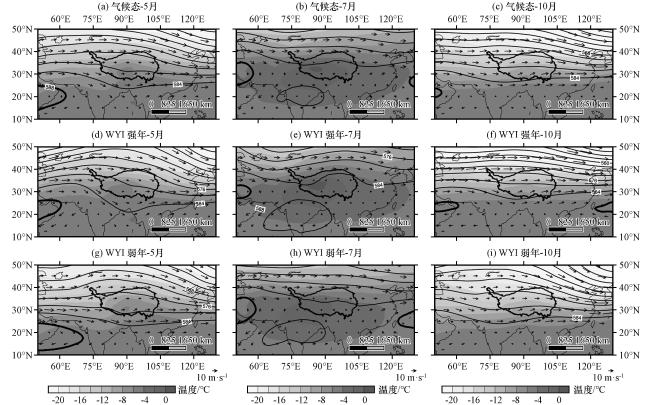
图6 30年气候态(上)、 WYI强年(中)和弱年(下)不同发展期东亚地区500 hPa高度场(等值线, 单位: dagpm)、 温度场(填色区, 单位: ℃)和风场(矢量, 单位: m·s-1)分布加粗线表示588 dagpm线Fig.6 Distribution of geopotential height (contour, unit: dagpm), temperature (the shaded, unit: ℃) and wind (vector, unit: m·s-1) fields on 500 hPa over East Asia in different development periods for the 30-year climatological state (top) and WYI strong (middle) and weak (bottom) years.Black bolded line is line 588 dagpm |
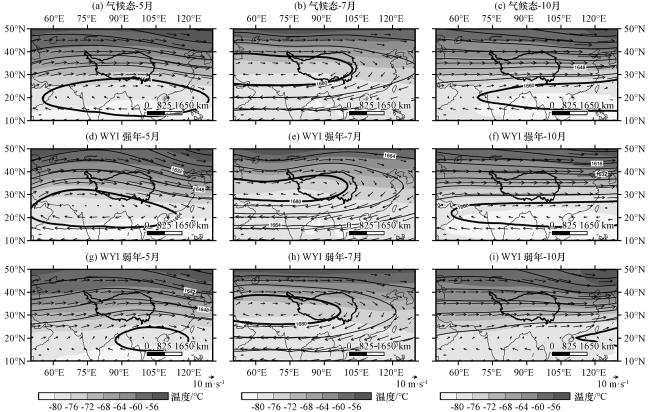
图7 30年气候态(上)、 WYI强年(中)和弱年(下)不同发展期东亚地区100 hPa高度场(等值线, 单位: dagpm)、 温度场(填色区, 单位: ℃)和风场(矢量, 单位: m·s-1)分布加粗线表示高压中心Fig.7 Distribution of geopotential height (contour, unit: dagpm), temperature (the shaded, unit: ℃) and wind (vector, unit: m·s-1) fields on 100 hPa over East Asia in different development periods for the 30-year climatological state (top) and WYI strong (middle) and weak (bottom) years.Black bolded line is the center of high pressure |