
1 前言
2 数据来源与方法介绍
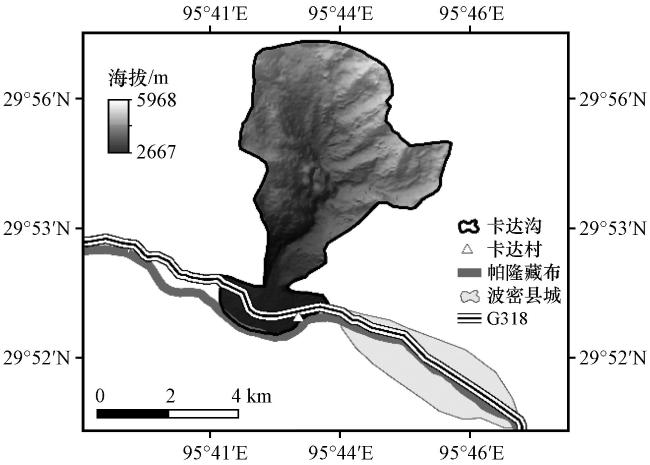
2.1 冰川泥石流流域概况
2.2 气象数据及预处理
2.3 分析手段
3 结果与分析
3.1 气温与极端气温变化
3.1.1 年以上尺度变化特征
3.1.1.1 变化趋势
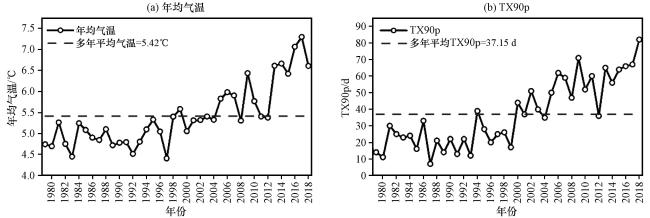
图2 西藏波密卡达沟流域年均气温和TX90p时间序列Fig.2 Time series of annual mean air temperature and TX90p in Kada valley, Bomi County, Tibet |
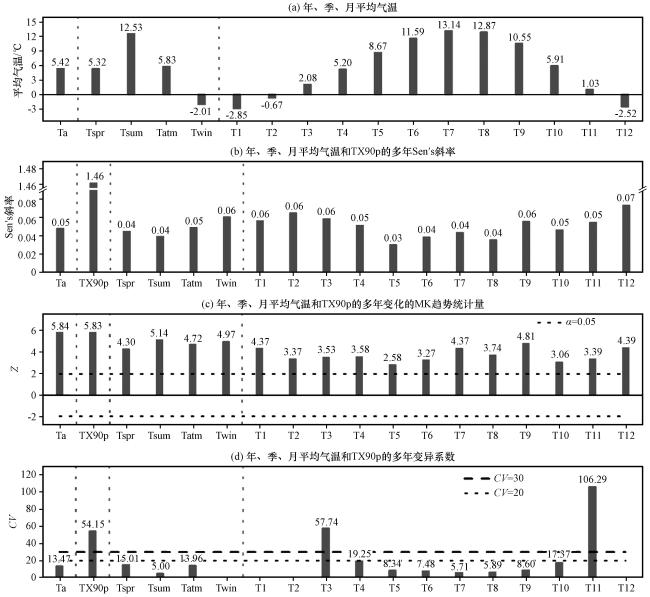
图3 西藏波密卡达沟流域年、 季、 月平均气温和TX90p变化的基本统计量 Ta代表年均气温; Tspr-win分别代表春夏秋冬四季平均气温; T1-12依次代表1 -12月的平均气温; 图中垂直虚线表示年、 季、 月平均气温和TX90p变量之间的分隔线Fig.3 Basic statistics of annual, seasonal and monthly mean air temperature and TX90p in Kada valley, Bomi County, Tibet (Ta represents annual mean air temperature; Tspr-win represents the mean air temperature of four seasons; T1-12 represents the mean air temperature from January to December; The vertical dashed lines in the graph demarcate the boundaries between the variables of annual, seasonal, monthly mean air temperature, and TX90p) |
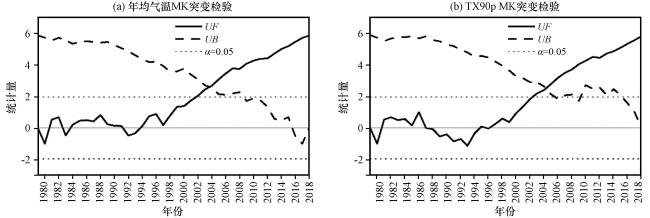
3.1.1.2 突变检验
3.1.1.3 周期分析
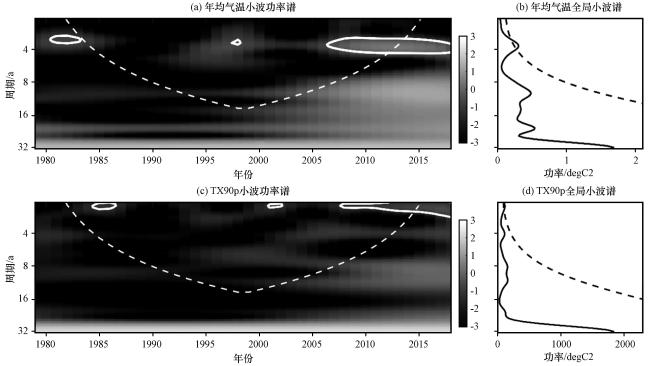
图5 西藏波密卡达沟流域年均气温和TX90p的小波功率谱和全局小波谱 图中色条表示小波功率谱强度, 颜色越浅, 能量越强Fig.5 Wavelet power spectrum and global wavelet spectrum of annual mean air temperature and TX90p in Kada valley, Bomi County, Tibet.The color bars represent the intensity of the wavelet power spectrum, where lighter colors indicate higher energy |
3.1.2 年内变化特征
3.2 降雨与极端降雨变化
3.2.1 年以上尺度变化特征
3.2.1.1 变化趋势
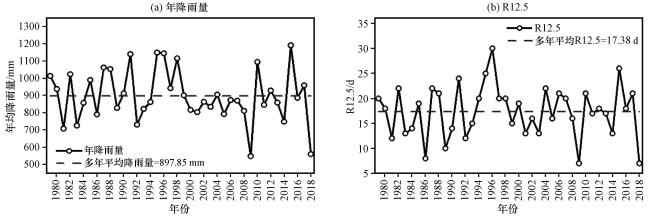
图6 西藏波密卡达沟流域年降雨量和R12.5时间序列Fig.6 Time series of annual rainfall and R12.5 in Kada valley, Bomi County, Tibet |
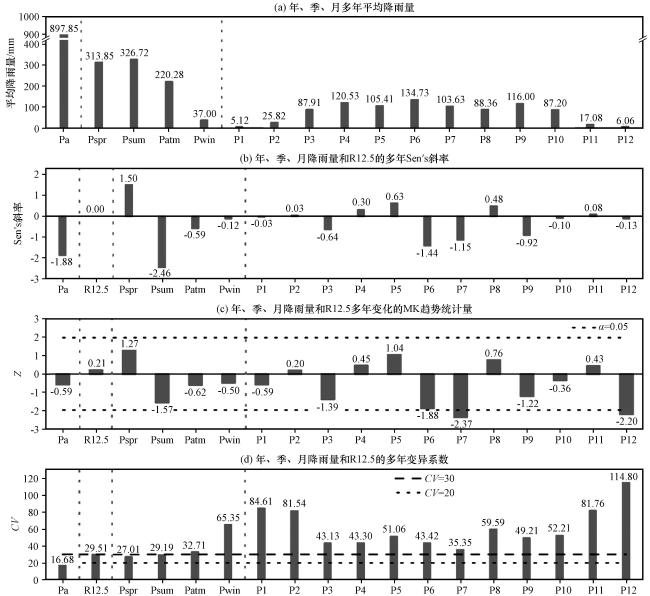
图7 西藏波密卡达沟流域年、 季、 月降雨量和R12.5变化的基本统计量 Pa代表年降雨量; Pspr-win分别代表春夏秋冬四季降雨量; P1-12依次代表1到12月份的降雨量; 图中垂直虚线表示年、 季、 月降雨量和R12.5变量之间的分隔线Fig.7 Basic statistics of annual, seasonal, monthly rainfall and R12.5 in Kada valley, Bomi County, Tibet (Pa represents annual rainfall; Pspr-win represents the rainfall of four seasons; P1-12 represents rainfall from January to December; The vertical dashed lines in the graph demarcate the boundaries between the variables of annual, seasonal, monthly rainfall, and R12.5) |
3.2.1.2 突变检验
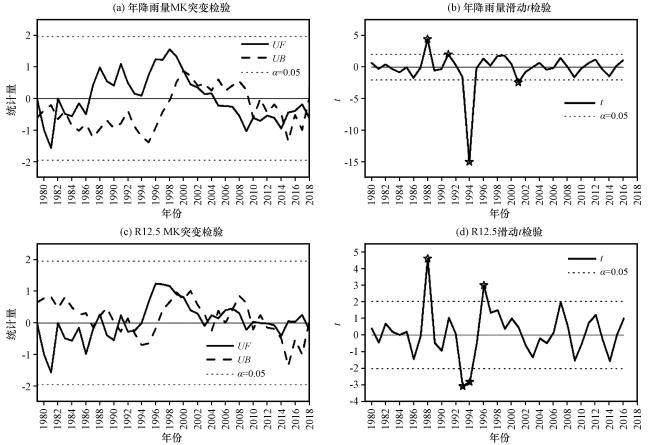
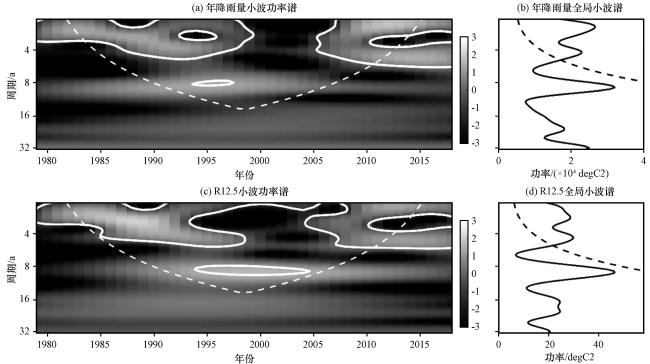
3.2.1.3 周期分析
图9 西藏波密卡达沟流域年降雨量和R12.5的小波功率谱和全局小波谱 色条表示小波功率谱强度, 颜色越浅, 能量越强Fig.9 Wavelet power spectrum and global wavelet spectrum of annual rainfall and R12.5 in Kada valley, Bomi County, Tibet.The color bars represent the intensity of the wavelet power spectrum, where lighter colors indicate higher energy |
3.2.2 年内变化特征
表1 西藏波密卡达沟流域1979 -2018年降雨集中指数( PCI )Table1 Rainfall Concentration Index ( PCI ) from 1979 to 2018 in Kada valley, Bomi County, Tibet |
| PCI分级 | 描述 | 统计(1979 -2018年) | 占比 |
|---|---|---|---|
| <10 | 低(几乎为平均分布) | 0 | 0 |
| 11~15 | 中 | 36 | 90 |
| 16~20 | 高 | 4 | 10 |
| ≥20 | 极高 | 0 | 0 |