The Best Reference Latitude for the Eddy Heat Flux Approximation in the Lower Stratosphere

  • Fenghua YANG ,
  • Renqiang LIU
Expand
  • Key Laboratory of Meteorological Disaster,Ministry of Education (KLME) /Collaborative Innovation Center on Forecast and Evaluation of Meteorological Disasters (CIC-FEMD),Nanjing University of Information Science & Technology,Nanjing 210044,Jiangsu,China

Received date: 2022-07-23

  Revised date: 2022-12-27

  Online published: 2023-11-14

Abstract

Stratospheric atmosphere is jointly affected by dynamical, radiative and chemical processes.Since the 1970s, the greenhouse gas emission and ozone depletion caused by anthropogenic activities have driven significant stratospheric cooling, so the tropospheric warming and the stratospheric cooling are both important criteria for global climate change.Observational and modeling studies disclosed that the formation of polar stratospheric clouds at very low stratospheric temperatures is an important condition for rapid ozone depletion.The weak polar vortex event related to the stratospheric sudden warming can even propagate downward to the troposphere and induce the tropospheric circulation anomaly, further leading to the extreme cold event in the middle and high latitude continents.Therefore, it is necessary to clearly understand the causes of stratospheric temperature changes at the background of global warming.Under quasigeostrophic scaling, the eddy heat flux approximation theory within the transformed Eulerian-mean framework is usually used to calculate the dynamical and radiative heating contributions of the Arctic stratospheric temperature changes, but this may bring certain errors.In this paper, according to a new area-weighted averaged thermodynamic equation by Liu and Fu (2019) within the Eulerian-mean framework, a monthly temperature change equation is constructed by time-sliding accumulation.Then using the European Centre for Medium-range Weather Forecasts fifth reanalysis data (ERA5) during 1980-2019, we calculate the climatological monthly temperature increment, dynamical heating, diabatic heating and convective heating term (W term) in the Arctic lower stratosphere, respectively, during the whole period 1980-2019 and two sub periods (1980-1999 and 2000-2019), and discuss the best reference latitude for the eddy heat flux approximation theory.The results show that the newly derived W term reduces the imbalance between the Arctic temperature increment term and the sum of cumulative dynamical and diabatic heating by half in winter and spring.At 100 hPa, W term changes with month and latitude, nontrivial especially in winter and spring.Therefore, the best reference latitude for the eddy heat flux approximation should be near the zero contour line of the W term.Further verification shows that the reference latitude can be taken at 50°N.

Cite this article

Fenghua YANG , Renqiang LIU . The Best Reference Latitude for the Eddy Heat Flux Approximation in the Lower Stratosphere[J]. Plateau Meteorology, 2023 , 42(6) : 1529 -1535 . DOI: 10.7522/j.issn.1000-0534.2022.00113

1 引言

平流层大气受动力、 辐射和化学过程的联合作用(Andrews et al, 1987)。自20世纪70年代以来, 人类活动所导致的温室气体排放和臭氧损耗已经驱动了显著的平流层冷却, 因此, 平流层变冷同对流层增暖一样都是全球气候变化的重要判据(Thompson et al, 2012)。平流层低温通过形成极地平流层冰晶云是导致臭氧快速损耗的重要条件(胡永云, 2020)。与平流层爆发性增温相关的弱极涡事件甚至可以下传到对流层引起对流层环流异常, 进而导致中高纬度大陆的极端冷事件(Baldwin and Dunkerton, 2001; Wang and Chen, 2010)。因此, 在全球变暖背景下, 需要进一步清楚地理解平流层温度变化的原因。
准地转近似的变换的欧拉平均(transformed Eulerian-mean, TEM)方程组为研究辐射和动力作用对平流层温度的影响提供了理论框架(Edmon et al, 1980; Andrews et al, 1987)。Newman et al(2001)基于TEM方程组, 通过对从某个参考纬度(或称为“起始纬度”)到极点的区域取面积加权的平均, 推导了一个利用涡动热通量(eddy heat flux, EHF)来近似表征动力作用的极区温度变化方程; Hu and Tung(2002)通过引入剩余环流质量流函数推导了更为简洁的温度变化方程。这两个方程形式类似但它们的推导分别利用了向下控制原理(Haynes et al, 1991)或纬向平均动量方程的定态假设。Liu and Fu(2019)直接从准地转欧拉平均(Eulerian-mean, EM)的热力学方程出发推导了一个更为精确的新形式温度变化方程, 与Newman et al(2001)和Hu and Tung(2002)推导的EHF近似方程相比, 新形式的方程增加了对流加热项, 如果忽略对流加热项, 则与EHF近似理论一致, 但目前尚未对该方程进行定量验证。
已有诸多研究尝试利用EHF近似理论计算引起平流层温度变化的动力和非绝热作用贡献大小(Bohlinger et al, 2014; Ivy et al, 2016; 刘仁强等, 2019)。本文将根据Liu and Fu(2019)提出的新形式的温度变化方程, 提出一个利用日资料计算逐月温度变化的方案。然后采用欧洲中期天气预报中心(ECMWF)1980 -2019年的ERA5再分析资料分别计算在全时段(1980 -2019年)和两个分时段(1980 -1999年、 2000 -2019年)北极低平流层100 hPa温度增量以及动力、 非绝热和对流加热项, 由此检验新形式的温度变化方程的有效性。进一步分析对流加热项在不同月份和纬度的分布, 讨论EHF近似理论成立的最佳参考纬度。

2 理论基础

Hu and Tung(2002)给出的EHF近似方程是位温形式的, 为了方便计算, Liu and Fu(2019)根据Hu and Tung(2002)的方法重新推导了温度形式的EHF近似方程:
∂ ∂ t T ¯ ≈ F φ , z + Q ¯
式中: T、 Q分别表示温度和非绝热加热; 上标“-”表示纬向平均, “ ”表示从参考纬度 φ到极点的面积加权平均, 为了研究北极平流层温度变化, 参考纬度 φ一般取为60°N。
F φ , z = v ' T ' ¯ c o s φ a ( 1 - s i n φ ) φ , z
表示在参考纬度 φ和垂直对数压力高度z下的涡动热通量项, 其中, a、 v分别表示地球半径和经向风速; 上标“'”表示纬向偏差; 为了减少不确定性, 将45°N -75°N范围内面积加权平均值作为涡动热通量项在60°N的近似, 这与Newman et al(2001)和Bohlinger et al(2014)取法一致。
方程(1)表示温度变化仅取决于涡动热通量和非绝热加热项, 即EHF近似。但由于推导过程中采用了纬向平均动量方程的定态假设, 可能会带来一定的误差, 因此Liu and Fu(2019)进一步基于准地转的欧拉平均(EM)的热力学能量方程, 推导出一个新形式的温度变化方程:
∂ ∂ t T ¯ = F φ , z + Q ¯ - N 2 H R - 1 w ¯
式中: w表示垂直速度; N 2是浮力频率的平方, 在平流层大气中约为5×10⁻⁴ s-2; H是平均大气标高, 常取为7000 m; R=287 J·K-1·kg-1, 为干空气气体常数; 其余各项与方程(1)一致。
为了定量分析各月温度或温度增量受动力、 非绝热和新导出的对流加热项作用的大小, 对方程(3)从t 1到t 2积分:
T ¯ t 2 - T ¯ t 1 = ∫ t 1 t 2 F φ , z d t + ∫ t 1 t 2 Q ¯ d t + ∫ t 1 t 2 ( - N 2 H R - 1 w ¯ ) d t
时间积分长度t 2-t 1可以近似为辐射弛豫时间尺度 τ, 在低平流层常取为30天(Newman et al, 2001)。
对式(4)逐日向前滑动累加并平均, 得到一个逐月温度变化方程:
1 M ∑ i = 1 M T ¯ t 2 + i d - 1 M ∑ i = 1 M T ¯ t 1 + i d = 1 M ∑ i = 1 M ∫ t 1 + i d t 2 + i d F φ , z d t + 1 M ∑ i = 1 M ∫ t 1 + i d t 2 + i d Q ¯ d t + 1 M ∑ i = 1 M ∫ t 1 + i d t 2 + i d ( - N 2 H R - 1 w ¯ ) d t
式中: M可以取作30天, i d = i × 1 day表示 i ( = 1,2 , … , M )天的时间增量。为了方便, 将(5)改写为:
T 2 - T 1 = F + Q + W
T 2、 T 1、 F、 Q和W分别表示方程(5)从左到右的各个项, 即当前月的温度、 前一个月的温度、 累积的动力作用项、 累积的非绝热作用项和累积的对流加热项(简称为“W项”), 因此如果忽略方程(6)中的W项即为涡动热通量近似。

3 资料来源

利用ERA5再分析的温度、 经向风、 垂直速度和非绝热加热日资料对方程(6)进行验证。ERA5作为ERA-Interim数据的升级产品, 其优点体现在时间和空间分辨率都得到提高(Hersbach et al, 2020)。但是为了与以往研究保持一致, 本文使用的水平分辨率仍然为2.5°×2.5°(Newman et al, 2001; Liu and Fu, 2019; 吴国华等, 2021)。为检验方程(6)的有效性, 首先选取了1980 -2019年再分析数据作为总的研究时段, 再根据2000年附近是平流层臭氧含量变化的转折点(郑明华等, 2010; 黎成超等, 2016), 划分出1980 -1999年和2000 -2019年两个时段, 这里不妨将1980-1999年称为臭氧损耗期, 2000 -2019年称为臭氧恢复期。由于1980 - 1999年时段低平流层温度分别受到El Chichón火山和Pinatubo火山爆发带来的强烈影响, 为简化问题并保持本研究与其他相关研究的一致性, 排除1982 -1984年和1991 -1993年两个短时段(Santer et al, 2000; 赵立龙和徐建军, 2015)。另外, 100 hPa的涡动热通量可以很好地表征行星波从对流层向上传播进入平流层的强度, 因此本文选取100 hPa作为低平流层研究高度(Edmon et al, 1980; Hartmann et al, 2000; Chen et al, 2003; 陈权亮等, 2009; Zhang et al, 2022)。

4 新形式温度方程在极区平流层的各项年循环及平衡检验

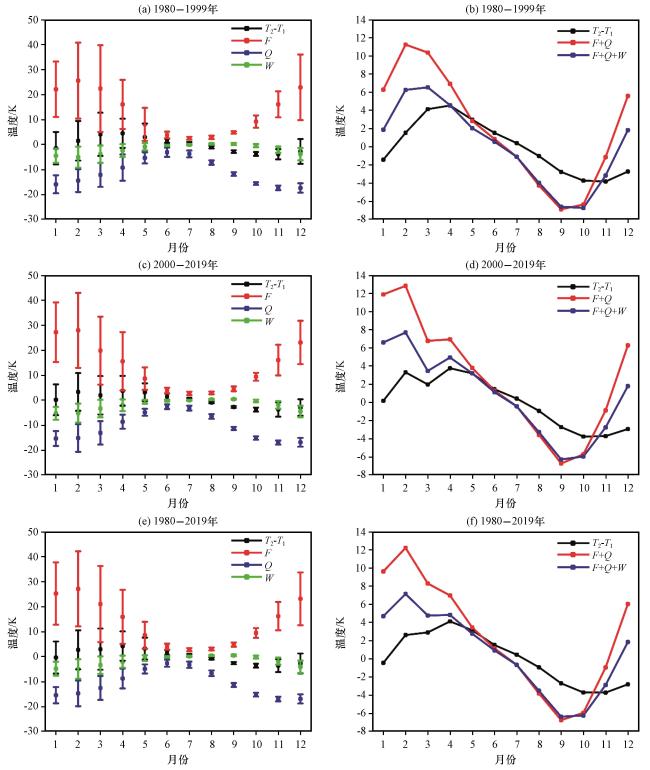
方程(6)表示各月的温度增量(T 2-T 1)不仅取决于非绝热加热作用(Q)和由涡动产生的动力作用(F), 还与W项的作用有关。为了研究方程(6)右侧各解释因子对平流层温度变化的贡献, 首先有必要对该方程进行平衡性检验。分别从温度方程各项在臭氧损耗期、 臭氧恢复期以及全时段(1980 - 2019年)北极100 hPa的气候平均值[图1(a)、 (c)、 (e)]。可以看到, F、 Q和W项具有显著的年循环特征, 它们在冬季量值最大, 而夏季最小。但是相较于F和Q项, 各月温度增量和W项是两个小项, 并且两者的量级接近。这是因为冬季从对流层向上传播进入平流层的行星波活动最强(Newman and Nash, 2000; 杨蕾等, 2006; 田文寿等, 2020), 波破碎和耗散导致了强的动力加热, 同时热带外主要表现为辐射冷却, F和Q是两个相消的大项, 它们在冬季均强于夏季。此外, 由波强迫驱动的平均经圈环流在冬季较强, 从而W项在冬季也较强。值得注意的是, 这四项在冬春季都存在较大的不确定性; 其中动力加热项的不确定性最大, 这主要是因为涡动热通量是扰动量的二次乘积。
图1 北极(60°N -90°N)100 hPa各月温度增量(黑色)、 累积的动力加热(红色)、 非绝热加热(蓝色)和对流加热项(绿色)的气候平均值(左列); 以及各月温度增量(黑色), 累积的动力和非绝热加热之和(红色), 及累积的动力、 非绝热加热和对流加热项之和(蓝色)(右列)随月份的变化 (a, c, e)中误差条表示各项2倍标准偏差

Fig.1 Climatological monthly Arctic (60°N -90°N) temperature increment (black), cumulative dynamical heating (red), diabatic heating (blue) and convective heating term (green) (left column), and temperature increment (black), cumulative dynamical plus diabatic heating (red), and the sum of cumulative dynamical heating, diabatic heating and convective heating term (blue) (right column) at 100 hPa, respectively.In Fig.1 (a), (c) and (e), vertical bars show the 2σ deviations

图1(b)、 (d)、 (f)分别给出了在三个时段的温度增量项、 累积的动力和非绝热加热之和(F+Q)以及累积的动力、 非绝热加热和对流加热之和(F+Q+W)。计算得到在臭氧损耗期[图1(b)]F+Q项与温度增量的相关系数为0.63, 而F+Q+W项与温度增量的相关系数为0.77, 这说明考虑了新导出的W项可以更好地解释北极平流层各月的温度变化。同时, 仅考虑动力和非绝热加热贡献之和与温度增量在冬春季节有明显的差异, 尤其在12月至次年3月相差分别达到8.31 K、 7.70 K、 9.70 K、 6.22 K; 而动力、 非绝热加热和W项之和在12月至次年3月与温度增量仅相差4.54 K、 3.29 K、 4.72 K、 2.40 K, 即采用新形式的温度方程使得在极区低平流层冬春季解释项与温度增量项之间的误差大约减少了一半, 这个结果在臭氧恢复期[图1(d)]和全时段[图1(f)]同样成立。注意, 相对于损耗期, 臭氧恢复期1 -3月温度增量、 F+Q、 F+Q+W项均有较大变化, 结合图1(a)和(c)可以看到, 这主要是由于恢复期1 -2月动力加热项明显增加而3月明显减小, 即恢复期1 -2月行星波活动上传明显增强而3月明显削弱的原因。

5 涡动热通量近似理论成立的最佳参考纬度

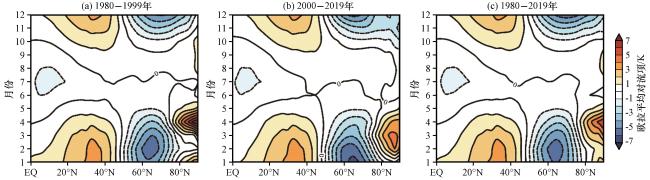
由前述分析已知, 当参考纬度取在60°N时, W项具有一定的贡献, 那么当参考纬度取在不同位置时, W项的贡献又会如何?图2给出了100 hPa上W项在不同时段随月份和纬度的分布。从图2中可以看到, W项在冬季较大, 而夏季几乎为0, 这与图1左列结果一致。同理, 这可能是因为冬季大气斜压性更强, 从而波活动增强, 波驱动的经圈环流也较强, 因此冬季热带外的W项可能也比夏季强。此外, 在冬春季W项随纬度增加大致呈正-负型分布, 但中高纬度的冷中心强度大于中低纬度的暖中心。特别地, 当参考纬度选在60°N -70°N时, W项对温度的贡献较大, 以图2(a)为例, 在12月至次年3月冷却为3.53~5.68 K; 在65°N最大达到5.68 K; 在60°N仍然可以达到5.14 K。可见, 如果参考纬度取在W项的贡献较大处, 特别是65°N时, 采用EHF近似理论(即不考虑W项贡献)会引起较大的误差。值得注意的是, 当参考纬度取在50°N时, 计算表明W项在全年各月的贡献介于0.08~0.92 K。不同时段W项的分布基本一致, 也说明W项的确不可忽略, 并且不依赖于具体时段的选择。
图2 北半球100 hPa欧拉平均对流项随月份和纬度的分布(单位: K)

Fig.2 The distribution of Eulerian-mean convection term with month and latitude in the Northern Hemisphere at 100 hPa.Unit: K

虽然EHF近似理论忽略了W项的贡献, 但它能够简洁地将温度变化的成因分解为动力和非绝热加热作用。Newman et al(2001)最初提出EHF近似理论时选取60°N -90°N作为研究范围, 即把参考纬度取在60°N; 但是根据W项的分布(图2), 倘若使用EHF近似理论来研究平流层温度变化的机理, 那么参考纬度应取在W项的零等值线附近。
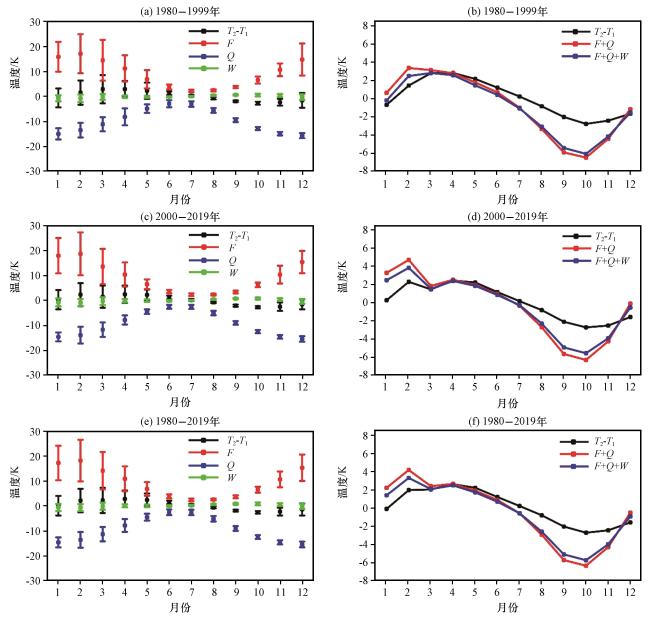
综上, 不妨以50°N作为参考纬度, 同样计算与图1中对应的各项在北半球100 hPa上的气候平均值, 结果如图3所示。从图3左列可以看到, W项几乎为零; 从图3右列也可看到F+Q的年循环与F+Q+W的年循环基本重合, 说明它们对温度变化的贡献基本相等。因此, 采用EHF近似的最佳参考纬度应取在50°N附近, 此时平流层温度变化可以仅用动力加热和非绝热加热因子进行较好的解释。
图3 北半球中高纬度(50°N -90°N)100 hPa各月温度增量(黑色)、 累积的动力加热(红色)、 非绝热加热(蓝色)和对流加热项(绿色)的气候平均值(左列); 以及各月温度增量(黑色), 累积的动力和非绝热加热之和(红色), 及累积的动力、 非绝热加热和对流加热项之和(蓝色)(右列)随月份的变化 (a, c, e)中误差条表示各项2倍标准偏差

Fig.3 Climatological monthly mid-to-high latitude (50°N -90°N) temperature increment (black), cumulative dynamical heating (red), diabatic heating (blue) and convective heating term (green) (left column), and temperature increment (black), cumulative dynamical plus diabatic heating (red), and the sum of cumulative dynamical heating, diabatic heating and convective heating term (blue) (right column) at 100 hPa in the Northern Hemisphere, respectively.In Fig.3 (a), (c) and (e), vertical bars show the 2σ deviations

6 结论

本文根据新形式的温度变化方程, 利用1980 - 2019年的ERA5再分析资料, 以2000年作为平流层臭氧含量的转折点, 计算了该方程中各项在臭氧损耗期(1980 -1999年)、 臭氧恢复期(2000 -2019年)以及全时段(1980 -2019年)的年循环特征, 揭示了W项的贡献, 进一步通过W项随月份和纬度的分布, 分析得出了涡动热通量近似理论成立的最佳参考纬度。主要结论如下:
(1) 在准地转近似下, 累积的动力和非绝热加热之和与温度增量在极区平流层冬春季存在较大的差异。W项虽然是个小项, 但考虑该项使得累积的动力和非绝热加热之和与温度增量之间的误差在12月至次年3月减少了一半, 因此提高了温度变化方程平衡的精度。
(2) 在北半球100 hPa上, W项随季节和纬度变化, 尤其在冬春季节量值较大且随纬度增加大致呈正-负型分布。Newman et al(2001)最初提出EHF近似理论时将参考纬度取在60°N附近, 但从W项的分布来看, 这会导致较大误差。为了更好地使用EHF近似研究平流层温度变化的动力和非绝热加热贡献, 应将参考纬度选在50°N附近。
依据欧拉平均环流理论, 波动和非绝热加热强迫驱动了平均经圈环流, w ¯作为经圈环流的垂直分量, 通过下沉绝热压缩导致大气增温或上升绝热膨胀导致大气冷却, 而W项是 w ¯的面积加权的平均, 存在抵消作用, 因此该项虽然不可忽略但它的绝对量值也不会很大。由于W项本身受动力、 非绝热加热和摩擦等因素的共同作用(Holton, 2004), 未来还有必要进一步研究W项的物理意义。此外, 根据新形式的温度变化方程在不同时段计算的结果基本一致, 说明至少在短期气候时间尺度内W项的贡献相对稳定。尽管在本文中利用新形式的温度方程改善了EHF近似在冬春季的误差, 但对夏秋季的改善很小, 这可能是由于积分时间尺度会随季节变化(Haynes, 2005), 而本文统一取为30天, 因此还需要进一步研究在夏秋季适用的积分时间尺度。

References

null
Andrews D G, Holton J R, Leovy C B, 1987.Middle atmospheric dynamics[M].San Diego: Academic Press, 489.
null
Baldwin M P, Dunkerton T J, 2001.Stratospheric harbingers of anomalous weather regimes[J].Science, 294(5542): 581-584.DOI: 10.1126/science.1063315 .
null
Bohlinger P, Sinnhuber B M, Ruhnke R, et al, 2014.Radiative and dynamical contributions to past and future Arctic stratospheric temperature trends[J].Atmospheric Chemistry and Physics, 14(3): 1679-1688.DOI: 10.5194/acp-14-1679-2014 .
null
Chen W, Takahashi M, Graf H F, 2003.Interannual variations of stationary planetary wave activity in the northern winter troposphere and stratosphere and their relations to NAM and SST[J].Journal of Geophysical Research: Atmospheres, 108(D24).DOI: 10. 1029/2003jd003834 .
null
Edmon H J, Hoskins B J, McIntyre M E, 1980.Eliassen-Palm cross sections for the troposphere[J].Journal of the Atmospheric Sciences, 37(12): 2600-2616.DOI: 10.1175/1520-0469(1980)037<2600: EPCSFT>2.0.CO; 2 .
null
Hartmann D L, Wallace J M, Limpasuvan V, et al, 2000.Can ozone depletion and global warming interact to produce rapid climate change?[J].Proceedings of the National Academy of Sciences, 97(4): 1412-1417.DOI: 10.1073/pnas.97.4.1412 .
null
Haynes P, 2005.Stratospheric dynamics[J].Annual review of fluid mechanics, 37(1): 263-293.DOI: 10.1146/annurev.fluid.37. 061903.175710 .
null
Haynes P H, McIntyre M E, Shepherd T G, et al, 1991.On the “downward control” of extratropical diabatic circulations by eddy-induced mean zonal forces[J].Journal of the Atmospheric Sciences, 48(4): 651-678.DOI: 10.1175/1520-0469(1991)048<0651: OTCOED>2.0.CO; 2 .
null
Hersbach H, Bell B, Berrisford P, et al, 2020.The ERA5 global reanalysis[J].Quarterly Journal of the Royal Meteorological Society, 146(730): 1999-2049.DOI: 10.1002/qj.3803 .
null
Holton J R, 2004.An introduction to dynamic meteorology[M].New York: Elsevier Academic Press, 531.
null
Hu Y Y, Tung K K, 2002.Interannual and decadal variations of planetary wave activity, stratospheric cooling, and Northern Hemisphere annular mode[J].Journal of Climate, 15(13): 1659-1673.DOI: 10.1175/1520-0442(2002)015<1659: IADVOP>2.0.CO; 2 .
null
Ivy D J, Solomon S, Rieder H E, 2016.Radiative and dynamical influences on polar stratospheric temperature trends[J].Journal of Climate, 29(13): 4927-4938.DOI: 10.1175/JCLI-D-15-0503.1 .
null
Liu R Q, Fu Y Y, 2019.Verification of an approximate thermodynamic equation with application to study on Arctic stratospheric temperature changes[J].Journal of the Atmospheric Sciences, 76(1): 3-9.DOI: 10.1175/JAS-D-18-0109.1 .
null
Newman P A, Nash E R, 2000.Quantifying the wave driving of the stratosphere[J].Journal of Geophysical Research: Atmospheres, 105(D10): 12485-12497.DOI: 10.1029/1999jd901191 .
null
Newman P A, Nash E R, Rosenfield J E, 2001.What controls the temperature of the Arctic stratosphere during the spring?[J].Journal of Geophysical Research: Atmospheres, 106(D17): 19999-20010.DOI: 10.1029/2000jd000061 .
null
Santer B D, Wigley T M L, Boyle J S, et al, 2000.Statistical significance of trends and trend differences in layer-average atmospheric temperature time series[J].Journal of Geophysical Research: Atmospheres, 105(D6): 7337-7356.DOI: 10.1029/1999jd901105 .
null
Thompson D W, Seidel D J, Randel W J, et al, 2012.The mystery of recent stratospheric temperature trends[J].Nature, 491(7426): 692-697.DOI: 10.1038/nature11579 .
null
Wang L, Chen W, 2010.Downward Arctic Oscillation signal associated with moderate weak stratospheric polar vortex and the cold December 2009[J].Geophysical Research Letters, 37: L09707.DOI: 10.1029/2010gl042659 .
null
Zhang J K, Zheng H Y, Xu M, et al, 2022.Impacts of stratospheric polar vortex changes on wintertime precipitation over the northern hemisphere[J].Climate Dynamics, 58(11-12): 3155-3171.DOI: 10.1007/s00382-021-06088-x .
null
陈权亮, 任景轩, 范广洲, 等, 2009.行星波波动对平流层剩余环流的影响[J].高原气象, 28(2): 402-410.
null
胡永云, 2020.南极臭氧洞的发现[J].科学通报, 65(18): 1797-1803.DOI: 10.1360/tb-2020-0097 .
null
黎成超, 郭世昌, 易琦, 等, 2016.北半球中高纬地区冬季大气臭氧与极涡强度关系[J].高原气象, 35(5): 1290-1297.DOI: 10.7522/j.issn.1000-0534.2015.00026 .
null
刘仁强, 付焱焱, 吴国华, 等, 2019.一个诊断极区平流层温度变化的近似方程的检验及应用[J].大气科学学报, 42(6): 874-879.DOI: 10.13878/j.cnki.dqkxxb.20171127001 .
null
田文寿, 黄金龙, 郄锴, 等, 2020.平流层大气环流的典型系统及变化特征综述[J].气象科学, 40(5): 628-638.DOI: 10.3969/2020jms.0080 .
null
吴国华, 刘仁强, 黎颖, 2021.1980-2000年北极平流层冬季十年际变化形势的逐月演变[J].大气科学学报, 44(4): 585-591.
null
杨蕾, 陈文, 黄荣辉, 2006.北半球准定常行星波气候平均态的资料分析和数值模拟[J].大气科学, 30(3): 361-376.
null
赵立龙, 徐建军, 2015.7个CMIP5模式的平流层、 对流层温度趋势与SSU/MSU观测资料的对比[J].大气科学学报, 38(1): 101-110.DOI: 10.13878/j.cnki.dqkxxb.20130611001 .
null
郑明华, 付遵涛, 陈哲, 2010.北极臭氧损耗对东亚中高纬地区初春地面气温影响的转折点分析[J].高原气象, 29(2): 412-419.
Outlines

/

〈 〉