
1 引言
气象学上将气温随高度增加而升高的现象称为“逆温”。逆温存在时, 大气处于稳定状态, 限制空气的垂直对流(Hudson and Brandt, 2005), 抑制动量、 热量和水汽传输, 导致弱风、 高湿度环境(Serreze et al, 1992), 同时也不利于局地深层环流发展(Ganbat and Baik, 2016), 影响大气垂直混合深度、 地表辐射平衡和边界层内云的形成(Wendisch et al, 1996; Zhang et al, 2020)。逆温还会抑制大气污染物的垂直扩散, 加重空气污染(Kahl et al, 1996; Wu et al, 2014)。逆温所造成的稳定和高湿大气条件也有利于液相和非均相中二次气溶胶的生成(Silva et al, 2007), 且气溶胶与逆温还存在反馈正相关关系, 吸收性气溶胶能吸收太阳辐射使大气升温, 利于逆温形成(Li et al, 2019)。持续的逆温也是造成持续性大气重污染的重要原因(Zhao et al, 2013; Xu et al, 2019; Ning et al, 2018)。因此了解逆温特征, 对大气动力学以及空气污染至关重要, 同时也有利于掌握大气污染规律, 有效合理地治理大气污染。
许多国外研究者利用不同的温度数据分析了不同地区逆温特征。Zhang et al(2011a)发现低层逆温是南极大气边界层的常见特征, 与海冰和行星反照率有关。北极逆温强度与地表温度变化呈现出较强耦合性(Liu et al, 2006)。Zhang et al(2011b)发现美国低层逆温特征具有明显的季节变化。阿拉斯加低对流层逆温的长期变化为秋、 冬季逆温层温差明显增大, 逆温深度、 温差、 频率呈长期递减趋势(Kahl, 1990; Bourne et al, 2010)。欧洲上空逆温的时空变化与逆温类型、 日照条件、 地表类型和空气循环相关(Palarz et al, 2019)。
同时, 国内也有学者对大气逆温特征进行了研究。Guo et al(2020)对中国地区08:00(北京时, 下同)和20:00的低层逆温相关研究表明, 土地覆盖对逆温频率的季节和空间格局没有显著的影响。Huang et al(2021)使用无线电探空数据研究了中国地区逆温特征的空间分布、 季节变化和月变化。Xu et al(2021)利用近40年怀俄明大学探空资料研究了我国接地逆温、 悬浮逆温和多层逆温同时存在的时空变化。Li et al(2012)利用探空数据揭示了华中地区多层逆温的特征。四川盆地91.4%的逆温发生在5500 m以下(Feng et al, 2020)。Zhang and Li(2011)研究发现大气污染物和逆温强度存在反馈正相关关系。
在已有关于逆温的研究中, 多集中于局部地区或城市站点, 针对整个中国区域的逆温特征时空差异的研究较少, 同时探空观测数据时空分辨率较小, 基于探空数据的逆温特征的动态变化难以捕捉。本研究将我国划分为六个地区, 利用逐时温度廓线数据分析探讨逆温特征时空变化, 总结逆温特征时空差异, 分析出现趋势异同的原因, 并尝试给出区域逆温特征的影响因素, 以便更好地了解全国逆温的分布及特征。
2 数据来源和方法介绍
2.1 数据来源
本研究温度数据来自欧洲中期天气预报中心(ECMWF)第5代再分析数据ERA5。与中期再分析数据ERA-I相比, ERA5更新了参数化方案和数据同化系统, 水平分辨率达0.25°×0.25°, 数据从1940年开始提供。本文采用2011 -2020年1000~800 hPa逐时温度廓线数据获取逆温特征。
使用中国气象局(CMA)2011 -2016年L波段探测系统所收集的每天08:00和20:00温度廓线数据获取华北地区北京和乐亭站点逆温特征, 对比验证REA5数据获取逆温结果的可靠性。L波段探测系统开发始于2011年, 从此L波段GTS-1无线电探空仪广泛用于无线电探空站, 提供温度、 压力、 相对湿度等气象要素的精细剖面(Zhang et al, 2018)。
同时采用2011 -2019年美国怀俄明大学共享的南宁、 贵阳和长春等17个站点08:00和20:00无线电探空数据中的温度廓线数据获取逆温特征, 对比验证ERA5数据的逆温结果。Wyoming探空数据已广泛应用于诸多研究(Huang et al, 2020; Zhang et al, 2021), 其时间分辨率为每天两个时次(08:00和20:00), 包括大气压力、 高度、 温度、 湿度、 风速、 风向等数据, 垂直高度从几十米到30 km多不等。
2.2 方法介绍
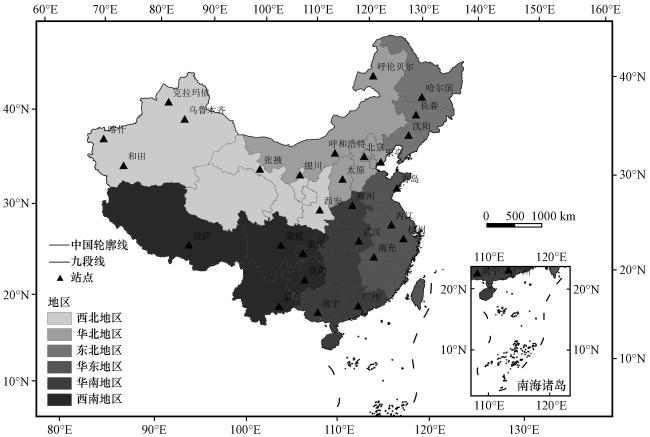
本研究按行政区分布以及地理位置和气候特征差异(吴正华, 1999; 王丽平等, 2021; 王梦泽, 2021; 韩懿颖, 2022), 将我国分为六大地区, 并分别选取各地区代表性城市作为研究站点(图1所示)。文中涉及的地图是基于地图技术审查中心标准地图服务系统下载的审图号为GS(2019)1822的中国地图制作, 底图无修改。
从ERA5数据中获取每个站点逐时温度廓线数据, 对于不同海拔的站点, 根据压高方程将位势高度转换为几何高度后, 初始高度均加上观测站点的高度。按站点所对应的格点提取温度数据后计算逆温特征。本研究均取地表向上第一层逆温用作后续分析。采用CMA探空数据计算逆温特征时, 取和ERA5相对应气压层的温度数据计算, 采用Wyoming探空数据计算逆温特征时, 取邻近ERA5对应气压层的数据计算。最终以站点相对应时刻ERA5数据和探空数据所得的结果做验证分析。文中冬季取12月至次年2月, 春季3 -5月, 夏季6 -8月, 秋季9 -11月。
逆温特征均根据我们已发表的文章定义(Xu et al, 2021), 即当上层温度大于下层温度时判定为逆温。逆温频率、 逆温强度、 逆温厚度公式如下。逆温频率FTI :
式中: FTI 表示逆温频率; NTI 为逆温出现的小时次数总数; NT 为总的小时次数。
逆温强度I:
式中: I表示逆温强度(单位: ℃); T 2和T 1分别为逆温结束层和逆温开始层所对应的温度。
逆温厚度D:
式中: D表示逆温厚度(单位: m); H 2和H 1分别为逆温层顶部和底部高度。
3 结果分析
3.1 ERA5再分析数据的可靠性验证
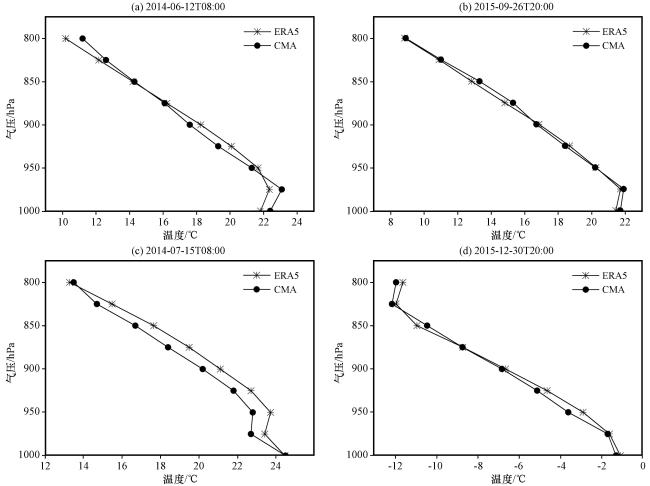
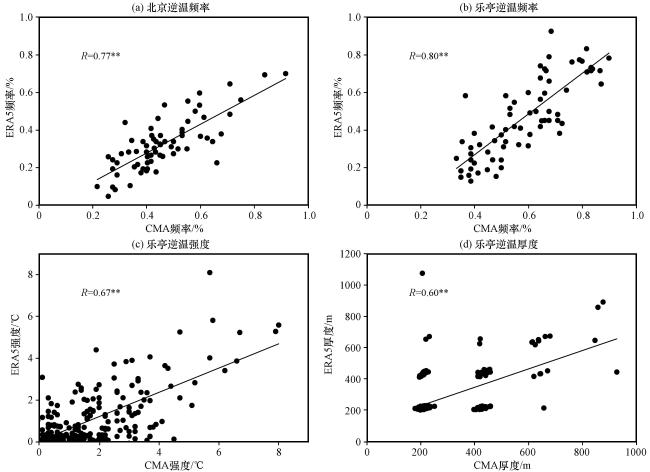
本文还分析了西北、 东北、 西南、 华东以及华南地区ERA5再分析数据与Wyoming探空数据的逐月逆温频率的相关性。多数站点不同数据间逐月逆温频率相关系数均较高, ERA5能较好地捕捉到逆温层。从西北、 东北、 西南、 华东以及华南地区各选出一个站点, 分析站点不同数据的逐时逆温强度、 逐时逆温厚度和温度廓线结果。其中华南地区南宁、 华东地区南昌以及东北地区长春基于不同数据的逐时逆温强度相关系数分别可达0.64、 0.62、 0.66, 西南地区贵阳相关系数次之, 为0.51, 西北地区喀什最小, 均通过显著性检验。各地区关于逐时逆温厚度的相关系数较低, 这可能与Wyoming数据分层不均有关。
此外, Chang et al(2021)采用ERA5、 ERA-I、 日本55年再分析数据JRA55和探空数据对比评估北冰洋逆温, 发现ERA5数据总体上最能反映逆温次数和特征。Palarz et al(2020)表明ECMWF再分析等能够较好地探测出低对流层中的悬浮逆温。在与观测数据的对比研究表明, ERA5能够较理想地表示温度变化(Song and Dae, 2020; Zhu et al, 2021; Huai et al, 2021)。因此, ERA5的温度廓线数据能较好地反映出逆温特征。
3.2 逆温特征季节变化的空间分布
大部分地区逆温频率冬季最高, 春、 秋季次之, 夏季最低[图4(a)~(d)]。西北地区春、 秋、 冬季三季逆温频率沿陕西、 甘肃、 新疆地区逐渐升高, 乌鲁木齐到和田逆温频率呈下降趋势。东北地区和华北部分地区冬季逆温频率较高, 可达50%~90%。西南地区逆温频率多在15%~20%, 贵阳冬季逆温频率处于弱高值, 为50%左右, 蒙自逆温频率全年较低, 西藏部分区域未发现逆温存在。华东、 华南地区为逆温高发地, 冬季沿海地区逆温频率普遍高于华东、 华南内陆地区。华东地区春季逆温频率高于其余地区, 其中青岛春季逆温频率明显高于冬、 秋季。逆温频率总体表现为东部地区较高, 这与Huang et al(2021)的研究结果一致。
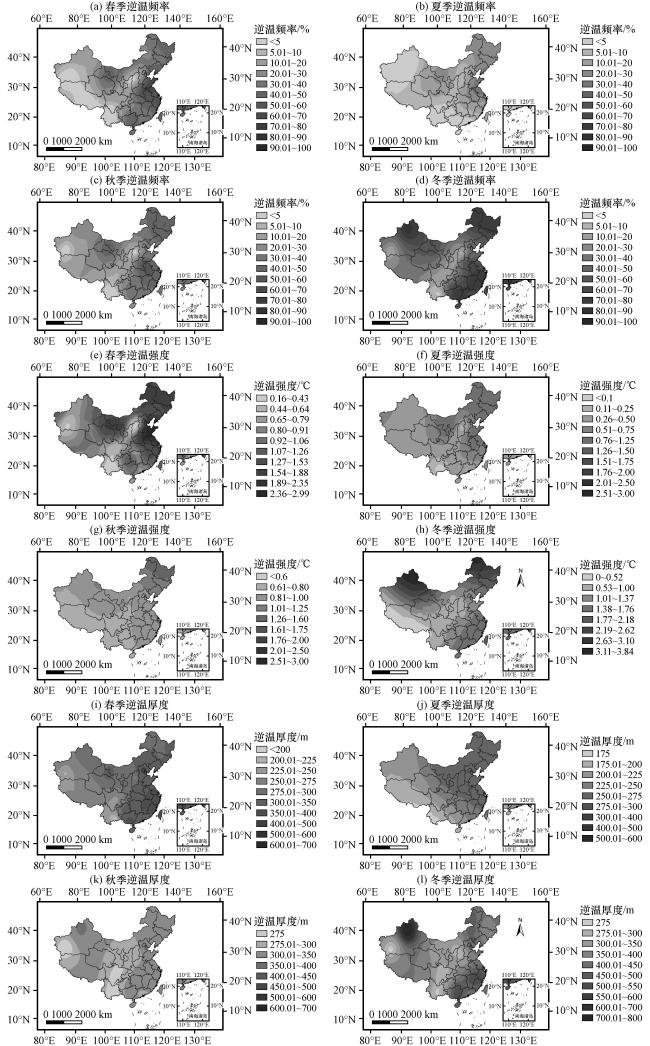
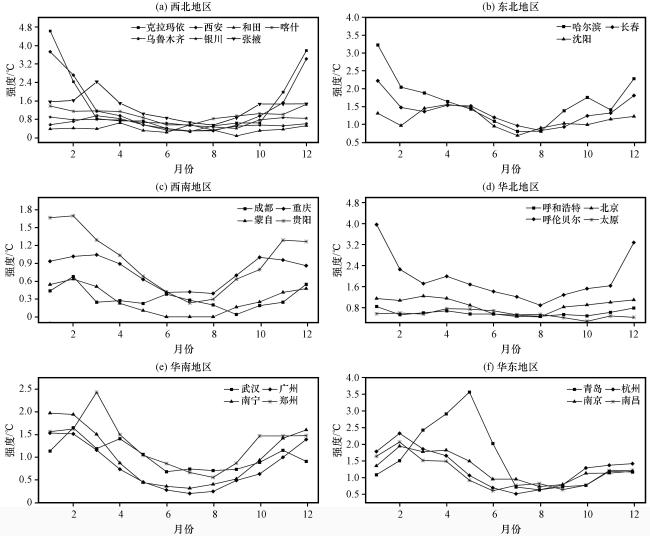
逆温强度总体为冬季最强, 春季次之, 夏季最弱[图4(e), (f)]。西北、 东北和华北部分地区冬季逆温强度显著高于西南、 华东、 华南地区。西北地区逆温强度季节变化最显著, 西南、 华东、 华南地区次之, 华北、 东北地区逆温强度季节变化较小。春季华东地区青岛逆温强度最大, 达3 ℃, 东北地区哈尔滨逆温强度次之, 约1.5 ℃, 其余地区逆温强度差异较小, 多在1 ℃左右。夏季逆温强度整体呈现北部地区向南部地区递减趋势。秋季西北和西南地区逆温强度最小。冬季内陆地区逆温强度较低, 华南南宁、 西北克拉玛依和乌鲁木齐、 华北呼伦贝尔等地逆温强度最强, 最高达3.6 ℃。
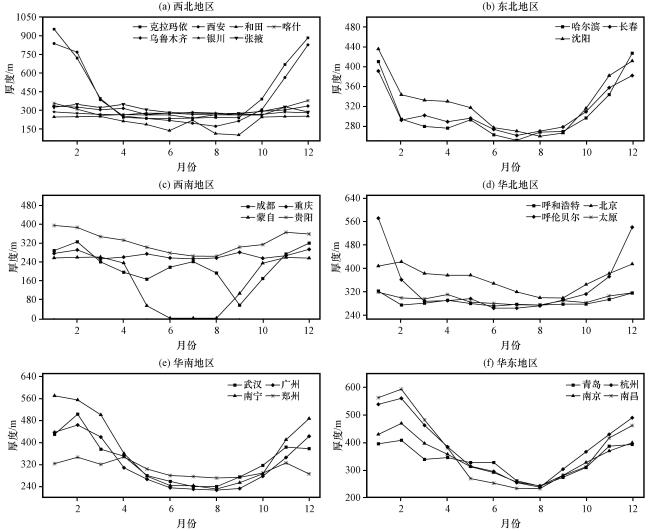
春、 夏、 秋三季华东杭州、 华南南宁逆温厚度略微偏厚, 约350 m, 其余地区逆温厚度变化较小, 西北和西南少数地区夏季逆温厚度较低[图4(i)~(l)]。冬季逆温厚度总体高于其余季节, 西北地区乌鲁木齐和克拉玛依为逆温厚度最厚地区, 可达800 m以上, 华东、 华南地区沿海站点逆温厚度也高于内陆。冬季逆温厚度和冬季逆温强度有较好的对应关系。
3.3 逆温特征的时间变化
3.3.1 逆温特征的日变化
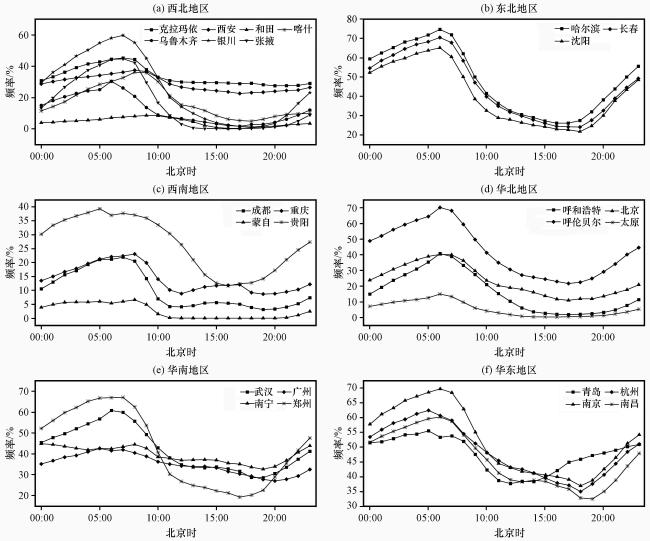
从逆温特征空间分布可知, 不同地区逆温特征差异显著, 下面将分析不同区域逆温特征的时间变化。图5(a)为西北地区逆温频率日变化, 和田除外, 其余站点逆温频率较为统一, 最高达60%。东北地区逆温频率整体较高, 各站点变化趋势一致, 07:00达到最高, 为75%, 18:00左右最低, 为22%。西南地区站点逆温频率差异较大, 贵阳逆温频率05:00左右最大, 达40%, 蒙自14:00 -20:00无逆温形成。拉萨站点未发现逆温, 不用作后续分析讨论。华北地区呼伦贝尔逆温频率均高于其余站点, 06:00最大, 约70%, 呼和浩特和北京逆温频率次之, 多在20%左右。呼伦贝尔逆温频率日变化与东北地区站点逆温频率日变化相似, 可能与所处地理位置有关。华南和华东地区各站点逆温频率差异较小, 两地区各站点逆温频率07:00左右最大, 约70%, 其中华南地区郑州逆温频率逐时变化最显著, 日逆温频率可相差48%。
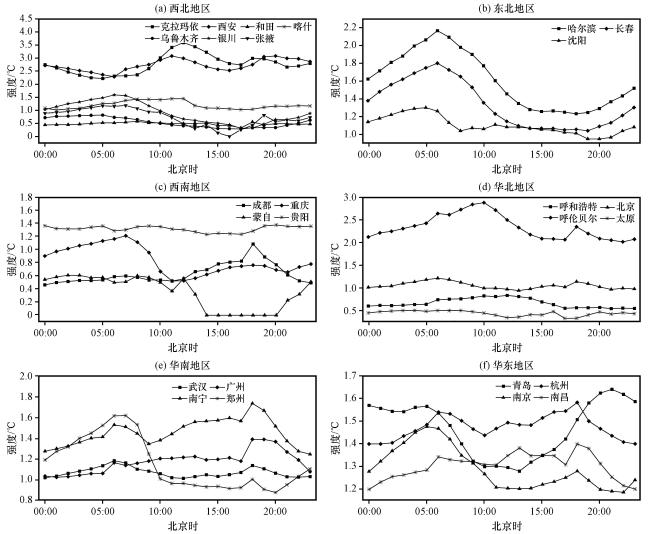
西北地区克拉玛依和乌鲁木齐逆温强度均高于其余站点, 分别在12:00和11:00达到最大, 为3.59 ℃和3.08 ℃(图6)。东北地区站点逆温强度变化一致, 05:00和06:00在1.30~2.17 ℃。西南地区贵阳和成都日变化较小, 分别在1.4 ℃和0.5 ℃左右, 重庆最大为1.21 ℃, 蒙自多为0.5 ℃左右。华北地区呼伦贝尔逆温强度普遍较强, 10:00最大, 达2.88 ℃, 其余站点日变化差异较小, 多在0.5~1.0 ℃。华南地区郑州逆温强度日变化较大, 07:00达1.62 ℃, 其余站点逆温强度均在06:00和18:00达到最大。华东地区青岛逆温强度21:00达到最大, 达1.64 ℃, 南京06:00达1.47 ℃, 杭州和南昌18:00分别达1.58 ℃和1.4 ℃。
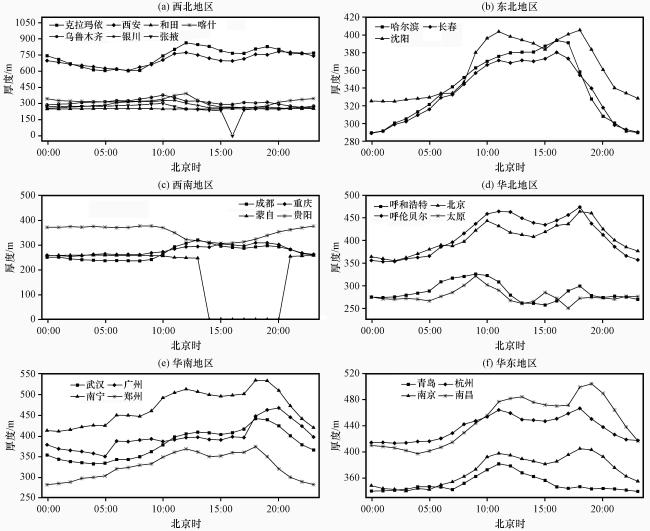
克拉玛依和乌鲁木齐逆温厚度呈现逐渐增加趋势, 整体为600~870 m, 其余站点逆温厚度多在250~300 m(图7)。东北地区各站点逆温厚度10:00 -18:00达到最大, 为380 m左右。西南地区整体逆温厚度在300 m左右。华北地区各站点逆温厚度日变化趋势相同, 分别在10:00和18:00达到最大, 呼伦贝尔和北京逐时逆温厚度高于呼和浩特和太原。华南地区逆温厚度呈逐时增加趋势, 18:00左右达到最大, 在374.16~534.6 m。华东地区各站点逆温厚度日变化一致, 青岛逆温厚度略有不同, 11:00达到最大, 为381.61 m。结合逆温频率和逆温强度日变化可知, 11:00之后强逆温较少, 多存在强度小但较厚的逆温。
3.3.2 逆温特征的月变化和年变化
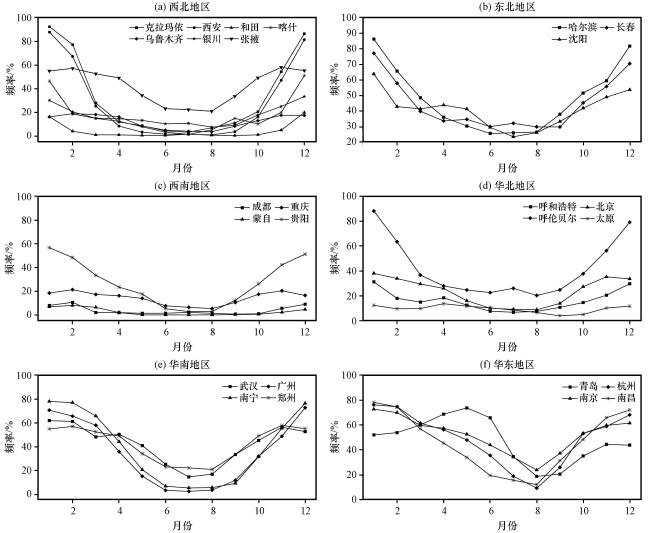
图8为不同站点逆温频率的月变化, 克拉玛依和乌鲁木齐1月逆温频率最大, 分别可达92.38%和87.78%, 张掖逆温频率整体较大, 维持在22%~58%, 和田地区逆温频率多在20%以下。东北各站点逆温频率的月变化趋势一致, 6 -8月最小, 为30%左右, 1月和12月频率最大, 达86%。西南地区逆温频率整体较小, 站点逆温频率月变化差异略小, 多在15%左右, 仅贵阳逆温频率在较冷月份有所增大, 接近60%。华北地区呼伦贝尔逆温频率1月达到最大, 为88%, 其余站点逆温频率在4%~40%。华南地区站点逆温频率月变化趋势一致, 较冷月份均维持在50%以上。华东地区各站点8月逆温频率达到最低值, 为20%左右, 1月达到最大值, 为78%左右, 青岛逆温频率略有不同, 逆温频率5月最大, 为73.67%。
各站点逆温强度表现为1 -2月和12月最强, 6 -8月最弱(图9)。西北地区逆温强度月变化趋势并不显著, 多在0.4~1.6 ℃, 仅克拉玛依和乌鲁木齐在1 -2月和12月强度较大, 达2.4 ℃以上。东北站点逆温强度1月最大, 哈尔滨可达3.22 ℃。西南地区逆温强度月变化差异增大, 贵阳2月逆温强度可达1.69 ℃。华北地区各站点逆温强度逐月变化与频率相似, 多数站点无明显变化趋势, 呼伦贝尔逆温强度月变化较大, 1月逆温强度达3.97 ℃, 8月最小, 为0.91 ℃。华南地区多数站点逆温强度均表现为1月和2月最大, 多为1.5~2 ℃, 广州逆温强度3月最大, 达2.43 ℃。华东各站点逆温强度月变化趋势一致, 整体逆温强度在0.51~2.33 ℃, 青岛逆温强度与逆温频率变化一致, 5月达到最大, 为3.57 ℃。
西北地区多数站点逆温厚度月变化差异较小, 多为300 m, 仅克拉玛依和乌鲁木齐1 -2月和11 - 12月逆温厚度达500 m以上(图10)。东北各站点逆温厚度月变化显著, 1月厚度最大, 达435.78 m, 7月最小为251.92 m。西南各站点逆温厚度月变化较小, 在240~340 m。华北地区呼和浩特和太原逆温厚度多小于320 m, 北京逆温厚度整体较大, 2月最大可达422.16 m, 呼伦贝尔逆温厚度月变化与长春等站点变化趋势一致, 1月最大, 达571.08 m。华东和华南地区站点逆温厚度逐月变化趋势相似, 在1 -2月达到最大值, 8月左右达到最小值, 整体在240~600 m。
根据逆温频率、 逆温强度、 逆温厚度的年变化, 我国逆温的发展趋势是西北、 西南、 华北地区逆温特征年变化较小, 多数站点逆温频率、 逆温强度、 逆温厚度年份波动分别约在10%、 0.4 ℃、 60 m以内, 仅西南贵阳和华北呼伦贝尔逆温特征分别呈上升和下降趋势。东北、 华东、 华南地区逆温特征年变化显著, 呈波浪形变化, 其中东北逆温频率、 逆温强度、 逆温厚度年变化总体呈下降趋势, 华东、 华南各站点逆温特征总体无明显上升或下降趋势。
4 讨论
本文采用ERA5长时间序列逐时温度廓线数据获取逆温特征, 结合逆温特征空间分布更详细地展现出不同地区逆温的动态变化。同时结合地表相对湿度和2 m温度对不同区域逆温季节变化的空间差异作出一定阐释。各区域逆温频率凌晨开始增加, 07:00左右达到最大值, 15:00左右达到最低, 之后随着夜晚来临逆温频率再次增加(图5)。这是因为夜间地表降温较强导致逆温频繁形成, 白天地表感热促进大气对流运动, 利于边界层混合, 不易形成逆温(Zhong et al, 2018; Chen et al, 2022)。所有站点逆温强度均在正午以后达到最小, 这与正午阳光照射充足, 地表及近地表大气不断升温导致温差减小有关。下午地表接收的太阳短波辐射减少, 同时地表持续向外发射长波辐射, 傍晚地表温度逐渐降低(黄庚等, 2002), 低层大气接收来自地表的长波辐射降温缓慢, 逆温强度再次增大。
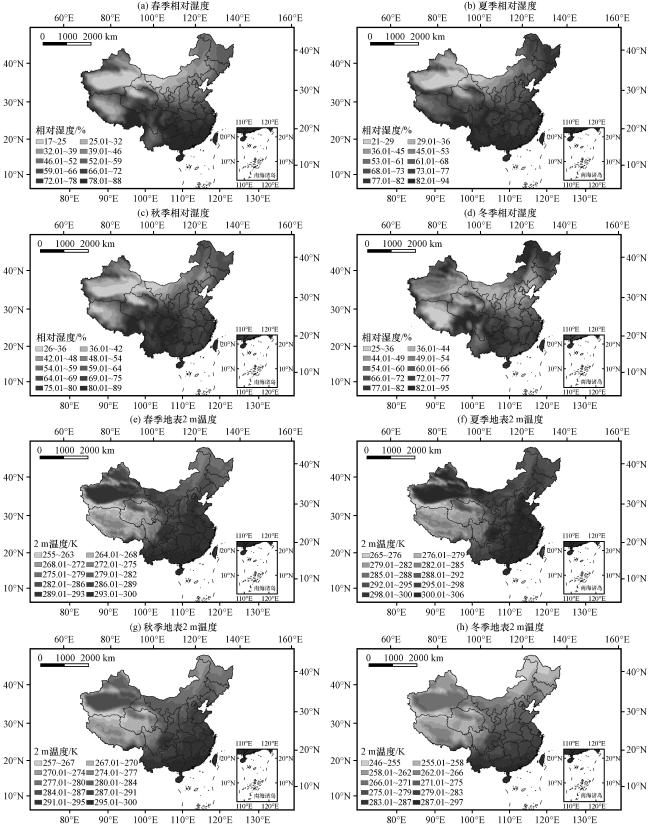
图11(a)~(d)为1000 hPa相对湿度季节变化情况。从图11(a)~(d)中可以看到, 春、 秋、 冬季相对湿度偏低, 气候干燥, 地面辐射冷却加快, 从而有利于逆温生成(Guo et al, 2020)。夏季各地区相对湿度普遍增加, 不利于地表辐射冷却, 加之近地气层不稳定, 湍流扩散条件好, 温度日差较小, 所以逆温发生次数较少(李淑梅和于宝忱, 1996)。西南地区相对湿度常年维持在较高状态, 环境潮湿, 加之该地多云不利于辐射冷却以及当地环流和地形影响, 逆温频率普遍较低(Li et al, 2012; Xu et al, 2021)。但较已有部分研究(Xu et al, 2021)结果偏小, 不排除因本研究采用的数据为逐时温度数据进行逆温特征计算从而造成总体逆温频率偏低的可能。华东、 华南地区以丘陵、 盆地、 平原为主, 属亚热带湿润性季风气候和温带季风气候, 相对湿度普遍较高, 逆温多受天气系统影响而产生(杜荣光等, 2011)。
冬季地表2 m温度普遍较低, 仅有华东、 华南以及西南部分地区温度达0 K以上[图11(e)~(h)]。春季温度周期从较冷的地表温度开始, 相比于从较高的地表温度开始的秋季, 春季更易形成逆温且逆温频率高于秋季(Bourne et al, 2010)。西北地区地表2 m温度常年较低, 与蒙古高压底部灌入的冷空气囤积有关, 这也是克拉玛依和乌鲁木齐逆温频发的原因(刘增强等, 2007; 容娜和徐梓杰, 2019)。
青藏高原逆温稀少, 其高海拔对应更强的太阳辐射、 热对流、 更稀薄的空气以及大气持续暖湿化等, 这都使得地气温差降低, 逆温难形成且易消散(Chen et al, 2014; 黄建平等, 2021; 丁旭等, 2022), 同时青藏高原近年表面风速增强(杨耀先等, 2022; 吴佳等, 2022), 加之西风急流的强风也会破坏逆温形成, 导致逆温频率不高(Schiemann et al, 2009)。沿海站点临近海洋, 属于亚热带气候, 易受大气环流、 西伯利亚高压影响使上层大气增温从而形成逆温, 同时850 hPa华南地区伴有南风的暖平流, 加上近地表的北风, 以及西北太平洋的信风逆温作用, 中国东南部逆温易于形成(Guo et al, 2020; Xu et al, 2021)。青岛逆温频率季节变化与其余站点不同, 为春季逆温频率最高, 这主要是由于春季东部沿海属温带季风气候, 昼夜有海陆风更替, 同时环流形势下形成的西南暖平流, 利于逆温形成, 且春季时青岛同时处于蒙古气旋的南部和海上高压后部, 海上高压维持时间越长, 越有利逆温的形成(邹玉玲等, 2007; 郭丽娜等, 2014)。综上, 天气、 条件和地理位置是逆温形成的重要影响因素。
华北、 东北地区的冷空气下沉和风切变使得逆温强度整体比较均匀, 华东、 华南地区逆温强度较强, 多受海洋环流、 地表温度和季风气候影响(Xu et al, 2021)。与其他地区不同的是, 青岛冬季逆温强度较春季弱, 这与邹玉玲等(2007)对青岛低空逆温层特征分析的结果一致, 主要是因为青岛位于我国东部沿海, 属温带季风气候, 加之市区受来自洋面上的东南季风及海流等影响, 具有海洋性气候特点。
西北地区属干旱和半干旱地区, 青藏高原的存在加强了西北旱区气候背景的形成和维持(罗红羽等, 2023), 这种环境利于热量流失, 地表能迅速降温, 有利于形成深厚的逆温。西南地区逆温厚度弱于华北、 东北地区(图14), 与西南季风区地表温度普遍高于大陆性季风气候的华北和东北地区有关(Xu et al, 2021)。东北地区逆温厚度常年保持在300 m左右, 是辐射强迫、 天气活动等复杂相互作用的结果(Huang et al, 2021)。
5 结论
(1) 冬季逆温最为频繁, 逆温频率差异与地形地貌和天气条件关系较大, 西南地区逆温频率多为20%以下, 东部地区较多大于40%。西北地区克拉玛依、 乌鲁木齐与华东、 华南沿海地区逆温强度最大, 厚度最厚, 整体多在1.5 ℃和300 m以上, 西南地区逆温厚度达到300 m的范围最小。各地区逆温强度和厚度会因气候、 天气条件和地形的影响而不同。
(2) 逆温特征均呈现出明显日变化, 所有站点逆温频率从凌晨开始增加, 07:00左右达到最大, 15:00左右最小, 20:00后逆温频率增加。站点逆温强度日变化差异较逆温频率弱, 07:00最大, 在1.0~2.5 ℃。逆温厚度日变化略有不同, 多在11: 00 -18:00达到最大值。
(3) 站点逆温特征多在1 -2月和12月达到最大值, 6 -8月达到最小值。西北和东北地区部分站点1月左右逆温频率最高, 90%左右。乌鲁木齐、 哈尔滨、 呼伦贝尔等站点逆温强度可达3 ℃以上。站点逆温厚度均表现出明显的月变化, 多数站点厚度集中在200~400 m。
(4) 西北、 西南、 华北地区各站点逆温特征年变化较小, 东北地区各站点逆温特征年变化显著, 总体呈下降趋势, 华东、 华南各站点逆温特征总体无明显上升或下降趋势。
根据逆温特征时空变化, 未来应更关注冬季华北平原和华南地区的珠江三角洲, 这些地区冬季更容易形成持续性强逆温, 进而进一步限制气态污染物和气溶胶的扩散, 造成持续性的大气重污染, 影响人体健康。
本研究相较已有研究的区别在于基于长时间序列逐时的温度廓线数据探讨了我国不同地区逆温特征时空变化, 分析了逆温特征时空差异的原因, 研究结果较好地展现了全国逆温的分布及特征, 可为不同地区逆温特征的变化趋势及大气污染过程的形成提供参考。为后续探究我国不同地区大气污染物在垂直方向上的累积和扩散提供科学参考。各地区逆温特征差异的原因分析有待结合更多地形植被、 气象数据作更深入的探讨。
现今探测技术已能比较精准地获取温度廓线, 目前大多研究集中在逆温与污染物相关性的分析讨论。可以预见未来的发展方向一是侧重长时间的逆温研究, 减少偶然性, 为气候变化研究提供参考; 二是开展逆温对大气污染的定量研究, 为大气污染预报预警提供依据。