
1 引言
2 研究区域与方法介绍
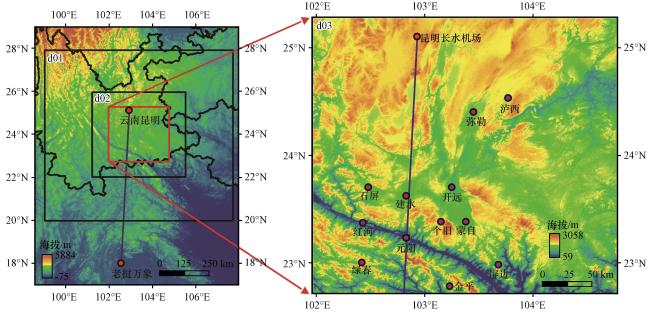
2.1 研究区域
2.2 WRF模式介绍
2.3 实例介绍
3 模拟结果及分析
3.1 模拟结果可靠性分析
3.1.1 风速分析
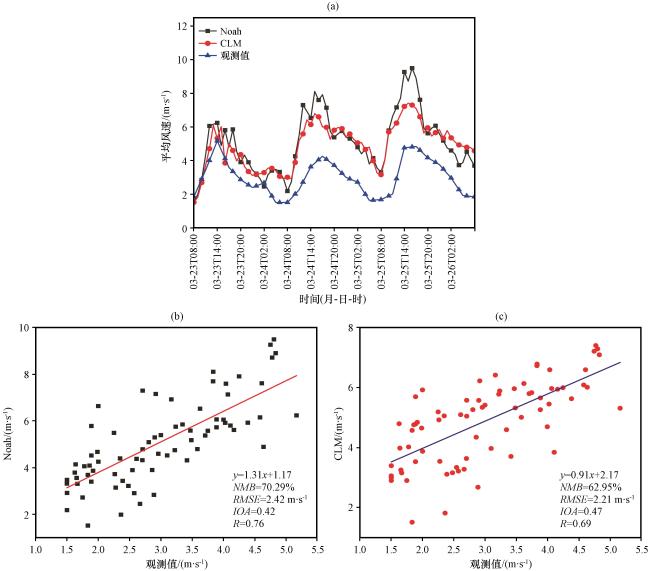
图3 12个站点的10 m平均风速的实际观测值与两种模拟方案得到的模拟结果(a), Noah方案(b)和CLM方案(c)模拟的10 m风速散点分布及线性回归Fig.3 Practical observations of 10-m mean wind speed at 12 stations and simulation results obtained by two simulation schemes (a), scattered and linear regression of 10-meter wind speed simulated by Noah's scheme (b) and CLM's scheme (c) |

图4 2020年3月23日08:00至26日08:00昆明(a)和蒙自(b)平均风速廓线Fig.4 Mean wind speed profile of Kunming (a) and Mengzi (b) from 08:00 on 23 to 08:00 on 26 March 2020 |
表2 昆明和蒙自不同方案、 不同气压层的风速评估指数Table 2 Wind speed assessment indices for Kunming and Mengzi for different schemes and different pressure layers |
| 站点 | 方案 | 气压层/hPa | NMB/% | RMSE/(m·s-1) | IOA | R |
|---|---|---|---|---|---|---|
| 昆明 | Noah | 500 | -10.66 | 2.70 | 0.64 | 0.82 |
| 700 | 40.30 | 5.82 | 0.48 | -0.17 | ||
| CLM | 500 | -8.20 | 2.62 | 0.61 | 0.88 | |
| 700 | 38.81 | 5.66 | 0.46 | -0.13 | ||
| 蒙自 | Noah | 500 | -8.66 | 2.80 | 0.80 | 0.87 |
| 700 | 6.52 | 3.51 | 0.76 | 0.47 | ||
| CLM | 500 | -6.30 | 1.69 | 0.77 | 0.96 | |
| 700 | 16.30 | 3.98 | 0.68 | 0.57 |
3.1.2 温度分析
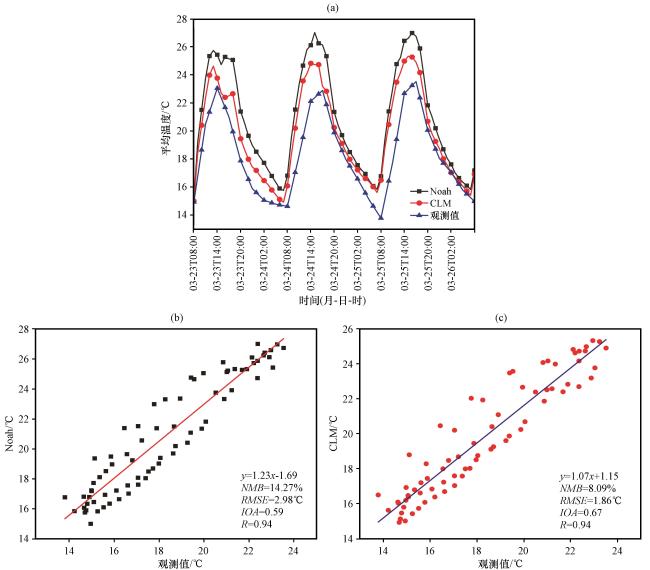
图 5 12个站点的2 m平均温度的实际观测值与两种模拟方案得到的模拟结果(a), Noah方案(b)和CLM方案(c)模拟的2 m温度散点及线性回归Fig.5 Practical observations of 2-m mean temperature at 12 stations and simulation results obtained by the two simulation schemes (a), Scattered and linear regression of 2-meter temperature simulated by Noah's scheme (b) and CLM scheme (c) |
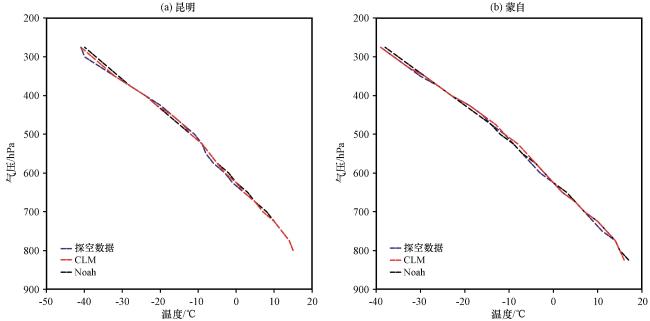
图 6 2020年3月23日08:00至26日08:00昆明(a)和蒙自(b)平均温度廓线Fig.6 Mean temperature profile of Kunming (a) and Mengzi (b) from 08:00 on 23 to 08:00 on 26 March 2020 |
表 3 昆明和蒙自不同方案、 不同气压层的温度评估指数Table 3 Temperature assessment indices for Kunming and Mengzi for different schemes and different pressure layers |
| 站点 | 方案 | 气压层/hPa | NMB/% | RMSE/℃ | IOA | R |
|---|---|---|---|---|---|---|
| 昆明 | Noah | 500 | 8.97 | 1.36 | 0.58 | 0.81 |
| 700 | 0.00 | 1.31 | 0.72 | 0.68 | ||
| CLM | 500 | 5.13 | 1.07 | 0.58 | 0.92 | |
| 700 | -3.70 | 1.20 | 0.76 | 0.70 | ||
| 蒙自 | Noah | 500 | 1.27 | 1.73 | 0.90 | 0.66 |
| 700 | 4.00 | 0.93 | 0.72 | 0.74 | ||
| CLM | 500 | -5.06 | 1.77 | 0.88 | 0.67 | |
| 700 | 0.00 | 0.93 | 0.77 | 0.68 |
3.2 不稳定参数特征分析
3.3 水汽特征分析


图10 WRF模拟的2020年3月24日12:00 -20:00沿102.87°E相对湿度(彩色区, 单位: %)、 温度(黑色等值线, 单位: ℃)和地形(黑色阴影, 单位: km)垂直剖面Fig.10 WRF-simulated vertical profiles of relative humidity (color area, unit: %), temperature (black contour, unit: °C), and topography (black shaded, unit: km) along 102.87°E from 12:00 to 20:00 on 24 March 2020 |
3.4 垂直运动特征分析
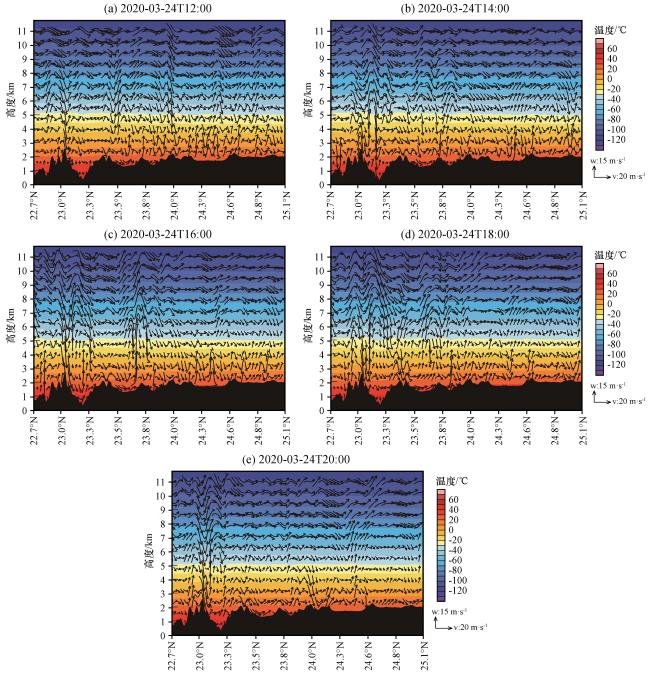
图11 WRF模拟的2020年3月24日12:00 -20:00沿102.87°E风场(矢量, 单位: m·s-1)、 温度(彩色区, 单位: ℃)和地形(黑色阴影, 单位: km)垂直剖面Fig.11 WRF simulated vertical profiles of wind field (vector, unit: m·s-1), temperature (color area, unit: °C), and topography (black shaded, unit: km) along 102.87°E from 12:00 to 20:00 on 24 March 2020 |