
1 引言
2 研究区概况及暴雪过程定义
2.1 研究区概况
图1 新疆北部地形高度(阴影; 单位: m)、 研究区域(虚线框)及其站点(黑点)分布站名后的数值为暴雪中心出现的次数 Fig.1 Terrain of Nouthern Xinjiang (shade, unit: m), the study area (dotted box) and the distribution of the blizzard in warm area center (black dot).The number after the station name is the times the blizzard center appears |
2.2 暖区暴雪标准及过程定义
3 资料来源及方法介绍
3.1 资料来源
3.2 方法
4 暴雪过程概况及环流特征
4.1 暴雪过程概况
表1 1980 -2020年新疆北部暖区暴雪天气过程概况Table 1 Overview of the snowstorm weather process in the warm zone of Northern Xinjiang from 1980 to 2020 |
| 序号 | 暴雪过程 | 持续时间 /天 | 出现暴雪站次/次 | 研究区最大日雪量及站点 | 最大过程雪量及站点 | 影响系统 | |||
|---|---|---|---|---|---|---|---|---|---|
| 研究区域 | 暴雪过程 | 雪量/mm | 观测站 | 雪量/mm | 观测站 | ||||
| 1 | 1980年11月19日 | 1 | 2 | 2 | 16.5 | 阿勒泰 | 16.5 | 阿勒泰 | 短波槽 |
| 2 | 1986年12月28日 | 1 | 2 | 2 | 16.7 | 富蕴 | 16.7 | 富蕴 | 西西伯利亚极涡 |
| 3 | 1990年11月26日 | 1 | 2 | 2 | 16.5 | 青河 | 16.5 | 青河 | 西西伯利亚极涡 |
| 4 | 1991年11月30日 | 1 | 4 | 5 | 14.6 | 富蕴 | 14.6 | 富蕴 | 西西伯利亚极涡 |
| 5 | 1993年3月29 -31日 | 3 | 4 | 8 | 15.2 | 克拉玛依 | 27.4 | 塔城 | 西西伯利亚极涡 |
| 6 | 1993年11月12 -14日 | 3 | 6 | 9 | 19.8 | 额敏 | 32.0 | 裕民 | 西西伯利亚极涡 |
| 7 | 1996年10月27 -28日 | 2 | 3 | 4 | 21.6 | 天池 | 30.5 | 青河 | 西西伯利亚极涡 |
| 8 | 1996年12月28 -30日 | 3 | 6 | 11 | 34.6 | 新源 | 39.7 | 阿勒泰 | 西西伯利亚低涡 |
| 9 | 1997年11月23日 | 1 | 2 | 2 | 17.3 | 青河 | 17.3 | 青河 | 西西伯利亚槽 |
| 10 | 1997年12月17日 | 1 | 3 | 3 | 25.3 | 塔城 | 25.3 | 塔城 | 西西伯利亚低涡 |
| 11 | 2000年11月23日 | 1 | 3 | 3 | 20.1 | 富蕴 | 20.1 | 富蕴 | 西西伯利亚低涡 |
| 12 | 2002年11月20 -21日 | 2 | 4 | 4 | 30.1 | 塔城 | 51.1 | 塔城 | 短波槽 |
| 13 | 2004年3月8 -9日 | 2 | 3 | 4 | 16.9 | 裕民 | 16.9 | 裕民 | 西西伯利亚极涡 |
| 14 | 2005年11月3 -4日 | 2 | 4 | 11 | 20.9 | 富蕴 | 20.9 | 富蕴 | 西西伯利亚极涡 |
| 15 | 2007年11月23日 | 1 | 6 | 7 | 23.3 | 塔城 | 23.3 | 塔城 | 西西伯利亚槽 |
| 16 | 2009年1月16日 | 1 | 4 | 4 | 19.4 | 塔城 | 19.4 | 塔城 | 西西伯利亚低涡 |
| 17 | 2009年12月23日 | 1 | 2 | 4 | 19.1 | 富蕴 | 19.1 | 富蕴 | 西西伯利亚极涡 |
| 18 | 2010年1月2日 | 1 | 2 | 2 | 20.9 | 裕民 | 20.9 | 裕民 | 短波槽 |
| 19 | 2010年1月6 -7日 | 2 | 10 | 10 | 37.3 | 富蕴 | 54.4 | 富蕴 | 中亚低涡 |
| 20 | 2010年3月10日 | 1 | 3 | 3 | 19.6 | 裕民 | 19.6 | 裕民 | 中亚低涡 |
| 21 | 2010年3月17日 | 1 | 3 | 3 | 15.5 | 哈巴河 | 15.5 | 哈巴河 | 短波槽 |
| 22 | 2010年11月17 -20日 | 4 | 10 | 12 | 21.8 | 裕民 | 29.3 | 富蕴 | 西西伯利亚槽 |
| 23 | 2010年12月3 -4日 | 2 | 6 | 7 | 39.8 | 额敏 | 39.8 | 额敏 | 西西伯利亚槽 |
| 24 | 2010年12月21日 | 1 | 3 | 5 | 30.1 | 裕民 | 30.1 | 裕民 | 西西伯利亚槽 |
| 25 | 2016年11月10 -13日 | 4 | 10 | 12 | 41.4 | 裕民 | 41.4 | 裕民 | 西西伯利亚极涡 |
| 26 | 2016年11月16 -17日 | 2 | 3 | 10 | 28.0 | 青河 | 36.6 | 霍尔果斯 | 西西伯利亚极涡 |
| 27 | 2018年3月1日 | 1 | 3 | 3 | 18.5 | 富蕴 | 18.5 | 富蕴 | 西西伯利亚低涡 |
4.2 环流特征
5 基于HYSPLIT的水汽轨迹分析
5.1 500 hPa 水汽特征
图2 新疆北部暖区暴雪过程中心500 hPa上水汽轨迹的空间分布及高度变化分布图中数值代表轨迹数, 括号中的值为该条水汽轨迹对暴雪的贡献 Fig.2 Spatial distribution and height variation of 500 hPa water vapor transport channels during snowstorms in the northern of Xinjiang.The values in the figures represent the number of tracks, and the values in parentheses are the contributions of this vapor track to the snowstroms |
图3 新疆北部暖区暴雪过程中心500 hPa上水汽轨迹逐时比湿变化图中C1、 C2、 C3、 C4、 C5曲线分别对应图2中1、 2、 3、 4、 5轨迹的比湿 Fig.3 The specific humidity of water vapor track at 500 hPa during snowstorms in the northern of Xinjiang.C1, C2, C3, C4 and C5 curves in the figure correspond to the specific humidity of tracks 1, 2, 3, 4 and 5 in Fig.2 respectively |
表2 阿勒泰地区暖区暴雪过程500 hPa高度水汽源地及其对暴雪的贡献Table 2 Water vapor source at 500 hPa height and its contribution to snowstorm process in the warm region of Altay region |
| 水汽 源地 | 轨迹数 | R/% | h/m | q1/(g·kg-1) | q2/(g·kg-1) | 损失率 /% | ||||
|---|---|---|---|---|---|---|---|---|---|---|
| 范围 | 平均 | 范围 | 平均 | 范围 | 平均 | 范围 | 平均 | |||
| 格陵兰 | 4 | 17~36 | 23 | 3180~5475 | 4154 | 0.88~2.52 | 1.83 | 0.16~0.57 | 0.39 | 79 |
| 大西洋 | 4 | 7~80 | 46 | 2164~6842 | 4102 | 0.45~3.86 | 2.10 | 0.36~0.73 | 0.55 | 74 |
| 地黑 | 2 | 14~64 | 39 | 2669~3429 | 3049 | 1.25~3.67 | 2.46 | 0.63~1.18 | 0.91 | 63 |
| 其他 | 3 | 11~18 | 16 | 1592~2038 | 1795 | 3.1~3.5 | 3.35 | 0.68~0.78 | 0.74 | 78 |
R、 h、 q1分别表示水汽源地对暴雪的贡献率、 源地高度和比湿, q2表示暴雪区的比湿; 损失率为(q1平均-q2平均)/q1平均×100%; 其他表示红海、 里海南部及非洲马里北部的水汽 |
表3 塔额盆地暖区暴雪过程500 hPa高度水汽源地及其对暴雪的贡献Table 3 Water vapor source at 500 hPa height and its contribution to snowstorm process in the warm region of Taer basin |
| 水汽源地 | 轨迹数 | R/% | h/m | q1/(g·kg-1) | q2/(g·kg-1) | 损失率 /% | ||||
|---|---|---|---|---|---|---|---|---|---|---|
| 范围 | 平均 | 范围 | 平均 | 范围 | 平均 | 范围 | 平均 | |||
| 格陵兰 | 2 | 13~18 | 16 | 3829~5744 | 4787 | 0.51~1.82 | 1.17 | 0.52~0.57 | 0.55 | 53 |
| 大西洋 | 5 | 14~48 | 29 | 3306~4187 | 3781 | 1.90~2.98 | 2.28 | 0.40~1.08 | 0.66 | 71 |
| 地黑 | 3 | 32~49 | 40 | 2567~3425 | 3082 | 1.55~3.26 | 2.34 | 0.70~1.05 | 0.87 | 63 |
| 东西伯利亚 | 1 | 2 | 6647 | 1.13 | 0.30 | 73 | ||||
R、 h、 q1分别表示水汽源地对暴雪的贡献率、 源地高度和比湿, q2表示暴雪区的比湿; 损率失为(q1平均-q2平均)/q1平均×100% |
5.2 700 hPa水汽特征
图4 新疆北部暖区暴雪过程中心700 hPa上水汽轨迹的空间分布及高度变化图中数值代表轨迹数, 括号中的值为该条水汽轨迹对暴雪的贡献 Fig.4 Spatial distribution and height variation of 700 hPa water vapor transport channels during snowstorms in the northern of Xinjiang.The values in the figures represent the number of tracks, and the values in parentheses are the contributions of this vapor track to the snowstroms |
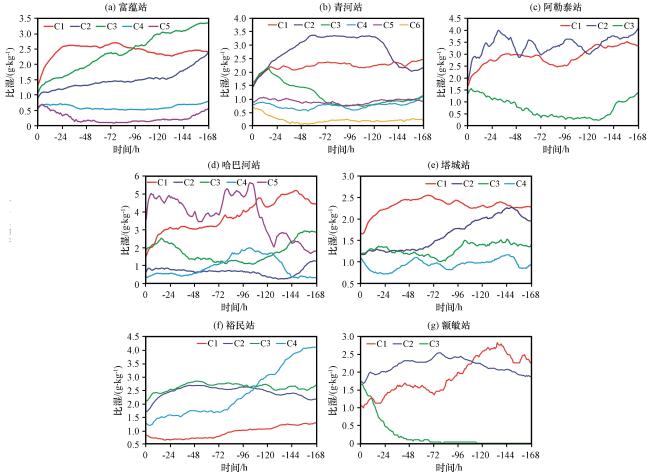
图5 新疆北部暖区暴雪过程中心700 hPa上水汽轨迹逐时比湿变化图中C1、 C2、 C3、 C4、 C5、 C6曲线分别对应图4中1、 2、 3、 4、 5、 6轨迹的比湿 Fig.5 The specific humidity of water vapor track at 700 hPa during snowstorms in the northern of Xinjiang.C1, C2, C3、 C4、 C5 and C6 curves in the figure correspond to the specific humidity of tracks 1, 2, 3、 4、 5 and 6 in Fig.4, respectively |
表4 阿勒泰地区暖区暴雪过程700 hPa高度水汽源地及其对暴雪的贡献Table 4 Water vapor source at 700 hPa height and its contribution to snowstorm process in the warm region of Altay region |
| 水汽源地 | 轨迹数 | R/% | h/m | q1/(g·kg-1) | q2/(g·kg-1) | 损失率 /% | ||||
|---|---|---|---|---|---|---|---|---|---|---|
| 范围 | 平均 | 范围 | 平均 | 范围 | 平均 | 范围 | 平均 | |||
| 北欧 | 3 | 18~29 | 22 | 3335~4122 | 3698 | 1.14~1.23 | 1.17 | 0.65~1.62 | 1.02 | 13 |
| 大西洋 | 4 | 21~26 | 24 | 2246~4776 | 3274 | 1.40~2.86 | 2.28 | 0.92~1.86 | 1.42 | 38 |
| 地黑 | 4 | 17~64 | 35 | 1006~2490 | 1909 | 2.42~4.43 | 3.38 | 1.08~1.69 | 1.41 | 58 |
| 西南亚 | 2 | 11~11 | 11 | 2129~2151 | 2140 | 1.77~4-10 | 2.94 | 1.90~3.57 | 2.74 | 7 |
| 新地岛 | 3 | 5~16 | 11 | 2604~5930 | 4126 | 0.23~0.93 | 0.65 | 0.57~0.90 | 0.72 | -11 |
| 其他Ⅰ | 3 | 3~24 | 14 | 1968~4646 | 3663 | 0.33~2.16 | 1.02 | 0.38~1.47 | 0.81 | 21 |
R、 h、 q1分别表示水汽源地对暴雪的贡献率、 源地高度和比湿, q2表示暴雪区的比湿; 损失率为(q1平均-q2平均)/q1平均×100%; 其他Ⅰ为咸海南岸、 东西伯利亚及格陵兰岛南部海域的水汽 |
表5 塔额盆地暖区暴雪过程700 hPa高度水汽源地及其对暴雪的贡献Table 5 Water vapor source at 700 hPa height and its contribution to snowstorm process in the warm region of Taer basin |
| 水汽源地 | 轨迹数 | R/% | h/m | q1/(g·kg-1) | q2/(g·kg-1) | 损失率 /% | ||||
|---|---|---|---|---|---|---|---|---|---|---|
| 范围 | 平均 | 范围 | 平均 | 范围 | 平均 | 范围 | 平均 | |||
| 北欧 | 2 | 29~79 | 54 | 3253~3933 | 3593 | 1.33~1.88 | 1.61 | 0.85~1.74 | 1.3 | 19 |
| 大西洋 | 3 | 11~31 | 19 | 2040~3246 | 2573 | 1.95~4.12 | 2.77 | 1.07~1.28 | 1.18 | 57 |
| 地黑 | 2 | 22~49 | 36 | 2528~2868 | 2698 | 2.28~2.72 | 2.5 | 1.66~2.12 | 1.89 | 24 |
| 中亚 | 2 | 8~33 | 21 | 2455~4163 | 3309 | 0.95~2.19 | 1.57 | 1.08~1.73 | 1.41 | 10 |
| 其他II | 2 | 11~12 | 12 | 3550~7860 | 5705 | 0.00~1.41 | 0.71 | 1.19~1.67 | 1.43 | -101 |
R、 h、 q1分别表示水汽源地对暴雪的贡献率、 源地高度和比湿, q2表示暴雪区的比湿; 损失率为(q1平均-q2平均)/q1平均×100%; 其他II为喀拉海东北部及格陵兰岛西南部的水汽 |
5.3 850 hPa水汽特征
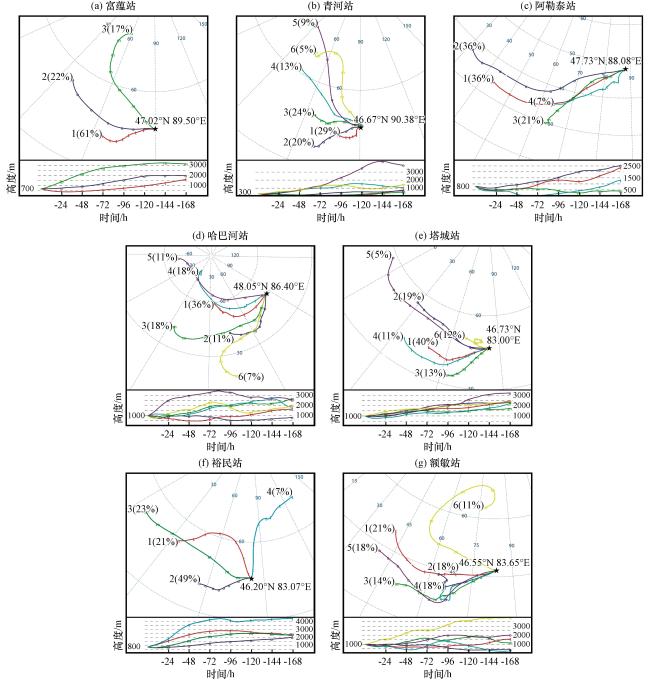
图6 新疆北部暖区暴雪过程中心850 hPa上水汽轨迹的空间分布及高度变化(单位: m)图中数值代表轨迹数, 括号中的值为该条水汽轨迹对暴雪的贡献 Fig.6 Spatial distribution and height variation of 850 hPa water vapor transport channels during snowstorms in the northern of Xinjiang.The values in the figures represent the number of tracks, and the values in parentheses are the contributions of this vapor track to the snowstroms |
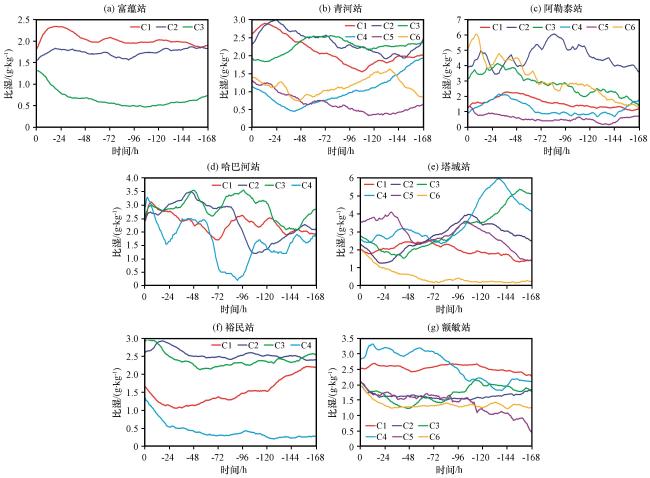
图7 新疆北部暖区暴雪过程中心850 hPa上水汽轨迹逐时比湿变化图中C1、 C2、 C3、 C4、 C5、 C6曲线分别对应图6中1、 2、 3、 4、 5、 6轨迹的比湿 Fig.7 The specific humidity of water vapor track at 850 hPa during snowstorms in the northern of Xinjiang.C1, C2, C3、 C4、 C5 and C6 curves in the figure correspond to the specific humidity of tracks 1, 2, 3, 4, 5, and 6 in Fig.6, respectively |
表6 阿勒泰地区暖区暴雪过程850 hPa高度水汽源地及其对暴雪的贡献Table 6 Water vapor source at 850 hPa height and its contribution to snowstorm process in the warm region of Altay region |
| 水汽源地 | 轨迹数 | R/% | h/m | q1/(g·kg-1) | q2/(g·kg-1) | 损失率/% | ||||
|---|---|---|---|---|---|---|---|---|---|---|
| 范围 | 平均 | 范围 | 平均 | 范围 | 平均 | 范围 | 平均 | |||
| 北欧 | 5 | 5~36 | 19 | 1078~1981 | 1596 | 0.87~1.94 | 1.51 | 0.90~1.55 | 1.24 | 18 |
| 地黑 | 3 | 11~36 | 22 | 837~2642 | 2005 | 1.30~3.47 | 2.29 | 2.45~3.90 | 3.16 | -38 |
| 西南亚 | 5 | 7~36 | 18 | 408~2336 | 1339 | 1.05~2.85 | 2.06 | 2.33~5.15 | 3.09 | -50 |
| 新地岛 | 2 | 9~17 | 13 | 3129~3870 | 3500 | 0.64~0.73 | 0.69 | 1.31~1.32 | 1.32 | -91 |
| 中亚 | 3 | 24~61 | 38 | 485~1601 | 948 | 1.91~2.37 | 2.09 | 1.83~2.62 | 2.13 | -2 |
| 格陵兰 | 1 | 11 | 2541 | 0.7 | 1.3 | -86 | ||||
R、 h、 q1分别表示水汽源地对暴雪的贡献率、 源地高度和比湿, q2表示暴雪区的比湿; 损失率为(q1平均-q2平均)/q1平均×100% |
表7 塔额盆地暖区暴雪过程850 hPa高度水汽源地及其对暴雪的贡献Table 7 Water vapor source at 850 hPa height and its contribution to snowstorm process in the warm region of Taer basin |
| 水汽源地 | 轨迹数 | R/% | h/m | q1/(g·kg-1) | q2/(g·kg-1) | 损失率 /% | ||||
|---|---|---|---|---|---|---|---|---|---|---|
| 范围 | 平均 | 范围 | 平均 | 范围 | 平均 | 范围 | 平均 | |||
| 大西洋 | 2 | 5~23 | 14 | 2385~3220 | 2803 | 0.45~2.53 | 1.49 | 2.10~2.91 | 2.51 | -68 |
| 地黑 | 4 | 11~21 | 18 | 1561~2223 | 2000 | 1.36~2.19 | 1.77 | 1.66~3.56 | 2.52 | -42 |
| 中亚 | 6 | 12~49 | 25 | 138~2421 | 1416 | 1.26~5.10 | 2.95 | 1.96~2.75 | 2.45 | 17 |
| 其他III | 4 | 7~19 | 13 | 1772~4349 | 3100 | 0.23~1.84 | 1.03 | 1.35~2.06 | 1.84 | -79 |
R、 h、 q1分别表示水汽源地对暴雪的贡献率、 源地高度和比湿, q2表示暴雪区的比湿; 损失率为(q1平均-q2平均)/q1平均×100%; 其他III为来自东西伯利亚沿岸、 阿富汗西南、 西西伯利亚北部及白俄罗斯北部的水汽 |
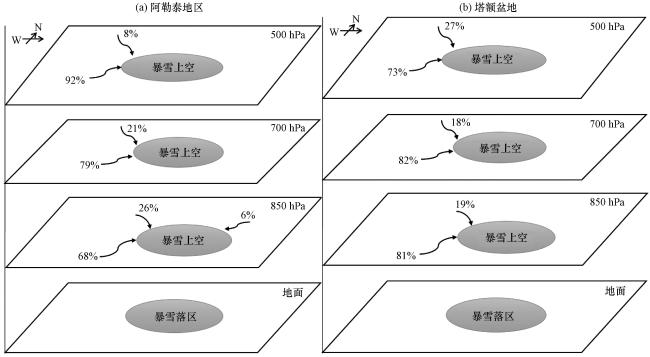