Analysis on Precipitation Extremes and Characteristics of the Rainstorm Event in the West of Hexi Corredor

  • Junxia ZHANG ,
  • Wubin HUANG ,
  • Yicheng WANG ,
  • Yanqin ZHAO ,
  • Jixin WANG
Expand
  • 1. Key Laboratory of Ari Climate and Reducing Disaster of Gansu Province,Lanzhou 730020,Gansu,China
    2. Lanzhou Central Meteorological observatory,Lanzhou 730020,Gansu,China
    3. Jinta Meteorological Bureau,Jinta 735300,Gansu,China

Received date: 2022-11-30

  Revised date: 2023-04-18

  Online published: 2024-01-11

Abstract

An extremely heavy rainstorm occurred 20:00 on 12 to 20:00 (Beijing Time) on 13 August 2022 in Jinta, Gansu Province, the 24 hours cumulative precipitation and hourly precipitation at Jinta station broke the historical extreme values.Based on the minutely, hourly and daily precipitation observation data, as well as the CMA Multi-source Merged Precipitation Analysis System (CMPAS) hourly precipitation data, the precipitation characteristics and extremity of the torrential rain event were analyzed.The results show that the extremely torrential rain event is characterized by large cumulative precipitation, strong locality, strong short-term precipitation and obvious convection.The main precipitation period is night and the rainstorm center is located in Jinta county, Jiuquan city.There are 11 stations reached the maximum since the station establishment, among which, the maximum appeared in Jinta station, reaching 88 mm, which is the second largest observed of all national stations in Jiuquan city, exceeding 58% of the historical average of the flood season in 62 years (from 1961 to 2022).There are 13 stations’s hourly precipitation reached the maximum since the station establishment and the maximum hourly precipitation of Jinta station was 56.2 mm, ranking the first among all the stations in Jiuquan, nearly three times of the average rainfall in August in Jinta Station in the past 62 years, showing obvious historical extremes.There are three precipitation periods in Jinta Station, and the heavy precipitation mainly occurs in the second period, with strong minutely precipitation intensity and long duration.The heavy precipitation center first appeared in the southeast of Jinta station, and then moved to the northwest, with the range of heavy precipitation expanding.After three hours, the precipitation intensity weakened and moved out to the southeast, and the precipitation process in the rainstorm area ended.

Cite this article

Junxia ZHANG , Wubin HUANG , Yicheng WANG , Yanqin ZHAO , Jixin WANG . Analysis on Precipitation Extremes and Characteristics of the Rainstorm Event in the West of Hexi Corredor[J]. Plateau Meteorology, 2024 , 43(1) : 156 -165 . DOI: 10.7522/j.issn.1000-0534.2023.00036

1 引言

IPCC(2021)报告指出, 气候变暖正在影响全球各地的极端天气。随着气候变暖的持续, 极端暴雨事件在未来可能会更频繁和强烈(Donat et al, 2016; Min et al, 2011; 景丞等, 2017), 极端降水量也会进一步增加(Sillmann et al, 2013; Kharin et al, 2013)。对于中国而言, 气温每升高一度, 预计强降水事件将加剧6.52%(Zhang and Zhou, 2019)。
中国因暴雨灾害造成的直接经济损失和死亡人数均超过其他气象灾害(景丞等, 2017)。北方地区年平均暴雨日数远少于东南地区(郑国光等, 2019), 但因其复杂地质条件, 暴雨极易诱发洪涝等灾害, 且致灾性强。如河南“75·8”特大暴雨造成惨重的人员伤亡和巨大经济损失(丁一汇等, 1978; 丁一汇, 2015), 2021年“21·7”河南暴雨, 导致河南省多个城市发生严重内涝(杨浩等, 2022; 张霞等, 2022), 2022年7月14日发生在甘肃省庆阳市的极端暴雨过程, 造成重大经济损。
中国极端暴雨降水量对总降水量贡献率呈增长趋势, 极端暴雨级别的降水强度呈增强趋势, 且季节性差异明显(陈海山等, 2009; 高荣等, 2018; 卢珊等, 2020)。东部夏季降水主要是极端暴雨事件造成的, 华南地区极端降水发生频率呈增加趋势, 长江流域则呈减少趋势(Cui et al, 2018)。极端降水频率从南向北呈递减, 但就变化趋势而言, 相对于湿润区, 干旱地区极端暴雨频率和相对强度的增长速度更快, 极端暴雨极值增加趋势更明显(Han et al, 2019)。降水极值由东南向西北逐渐减小, 区域性差异显著(Wen et al, 2015)。20世纪90年代以来华北地区持续性极端暴雨事件次数和平均极端降水量明显减少, 暴雨日数也趋于减少(周璇等, 2020; Zhou et al, 2017; 翟盘茂和潘晓华, 2003), 而西北大部分地区极端降水事件呈现明显增多趋势(翟盘茂和潘晓华, 2003)。
针对极端降水事件的历史变化趋势、 降水极值强度等方面统计研究, 便于认识某一区域气候尺度上极端降水事件的变化特征。对于某一次极端降水事件, 降水强度、 持续时间及强降水中心演变等特征, 同样值得研究。近几年发生在我国的几次影响巨大的极端暴雨天气, 累计降水量、 降水强度及持续时间均有明显历史极端性(高荣等, 2018; 杨浩等, 2022; 张芳华等, 2020; 陈涛等, 2020)。如河南2021年7月17 -22日特大暴雨过程, 持续时长达5天、 最大累计雨量达1122.6 mm、 郑州站小时降水量超过200 mm(杨浩等, 2022); 2022年7月14日发生在甘肃省庆阳市的特大暴雨过程, 24 h最大降水量达373.2 mm, 累计雨量、 小时雨强和短时强降水持续时间均突破历史极值(张君霞等, 2022)。深入研究暴雨过程中降水时空演变特征和极端性, 有助于认识强降水及其变化特征, 利于评估强降水的致灾性和防灾减灾决策服务。
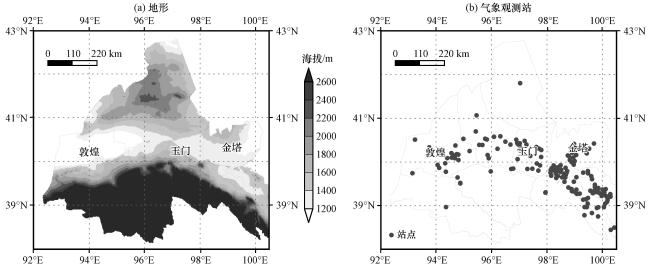
河西走廊属于极端干旱区, 是西北地区降水最少的地区之一(俞亚勋等, 2000; 黄玉霞等, 2004)。降水分布极不均匀, 且变率大, 夏季降水量占全年总降水量的70%~80%(李玲萍等, 2023), 暴雨天气属于小概率事件, 年均发生次数远不足1次(孔祥伟和陶健红, 2012), 地区特色明显(李红英等, 2013)。河西走廊西部地势南北高, 中间低, 南靠青藏高原、 北部为沙漠和戈壁, 中部为山地平原, 海拔低于2000 m[图1(a)]。近10年来, 河西走廊中西部极端暴雨事件频发, 且局地降水强度突破历史极值, 如2012年6月5日肃北站日降水量达93.8 mm, 2019年6月20日酒泉站日降水量84.4 mm。多位学者对河西走廊暴雨天气的天气系统配置、 水汽条件及中尺度特征等进行了研究(陶健红等, 2016; 孔祥伟等, 2015, 2021; 杨秀梅等, 2023), 但鲜有对暴雨过程中降水时空特征和极端性的研究分析。
图1 酒泉市、 张掖市西部地形(a, 阴影区, 单位: m)和气象观测站分布(b)

Fig.1 Distribution of terrain height (a, the shaded, Unit: m), meteorological stations (b) in Jiuquan and the west of Zhangye

2022年8月12日20:00(北京时, 下同)至13日20:00酒泉市金塔县、 肃州区及张掖市高台县、 肃南裕固族自治州西北部出现一次局地暴雨过程, 过程降水量大, 小时降水强度强, 给当地造成严重经济损失。本文利用不同时间分辨率的实况降水资料, 从降水强度特征及历史极端性、 强降水中心的时空演变特征等角度分析此次金塔县暴雨过程的降水特征, 以期为极端降水预报及防灾减灾决策提供参考信息。

2 资料来源与方法介绍

利用甘肃省气象信息与技术装备保障中心质控后的2022年8月12日20:00至13日20:00国家气象观测站(以下简称国家站)及区域气象观测站(以下简称区域站)逐分钟和逐小时实况降水观测数据, 酒泉市和张掖市西部国家站逐日(1961 -2022年)、 逐小时(2004 -2022年)及区域站建站以来逐日、 逐小时降水数据。研究区域内站点分布如图1(b)所示。格点实况降水资料采用国家信息中心研发的地面-雷达-卫星三源融合降水分析产品(CMA Multi-source Merged Precipitation Analysis System, CMPAS), 空间分辨率为0.01°×0.01°, 时间分辨率为1 h, 该降水分析产品质量优良, 能合理地反映中国地区降水空间分布(李显风等, 2017; 孙帅等, 2020)。
甘肃省河西地区24 h降水量超过30.0 mm为暴雨事件, 超过50.0 mm为大暴雨事件(孔祥伟等, 2015)。文中规定小时降雨量≥10 mm为短时强降水。文中涉及的地图是基于中华人民共和国自然资源部地图技术审查中心标准地图服务系统下载的审图号为GS(2020)4619号的中国地图制作, 底图无修改。

3 实况概况

2022年8月12日20:00至13日20:00, 河西走廊西部出现一次极端暴雨天气, 暴雨主要集中在酒泉市金塔县和张掖市高台县交界处(下文称为暴雨区), 金塔站和金塔县森林公园站24 h降水量分别为88 mm和71.1 mm, 达大暴雨。此次暴雨发生在西北太平洋副热带高压西北侧, 属于比较典型的副热带高压边缘型暴雨。暴雨发生前期, 河西走廊受副热带高压控制, 高温高湿。在500 hPa异常偏强的副热带高压稳定维持、 高空低槽东移南压过程中, 偏西北冷空气与副热带高压外围偏南暖湿气流交汇, 产生有利于暴雨发生的天气尺度环流背景; 700 hPa东南暖湿气流与高压系统底部冷的偏东风在暴雨区交汇, 使低层环境场不稳定度增大, 有利于对流产生; 700 hPa切变线、 地面冷锋及地面干线抬升触发对流, 冷锋与干线交叉点处发展为中-γ尺度深厚对流系统, 引起局地强降水。另外, 金塔南低北高的地形阻挡作用使水汽在此累积, 良好的对流条件及充沛的水汽条件使该地区产生强降水(傅朝等, 2022)。

4 降水特征及极端性

4.1 降水空间特征

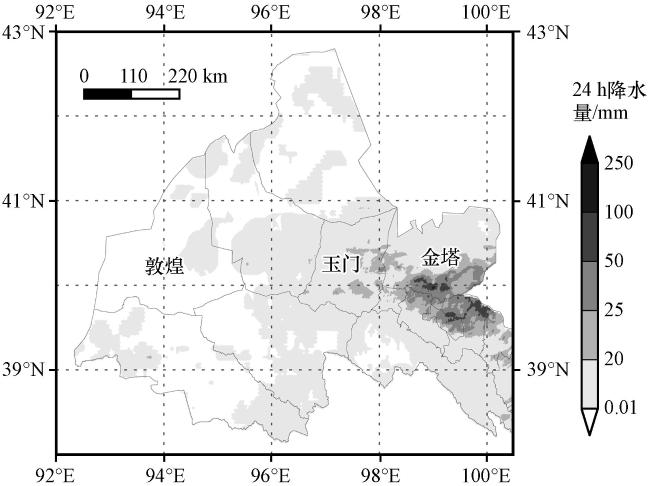
2022年8月12日20:00至13日20:00累计雨量大值区主要位于酒泉市金塔县东南部、 张掖市高台县(图2), 处于河西走廊山谷地形中[图1(a)]。有两个直径不超过40 km的暴雨中心, 分别位于金塔县和高台县, 局地性特征明显。据统计, 共有9站24 h降水量超过30 mm, 其中2站超过70 mm, 具有“单点暴雨”特征(栾晨等, 2012)。24 h降水量排名前5的气象观测站分别为金塔站(88 mm)、 金塔县森林公园站(71.1 mm)、 金塔县金鼎湖站(59.2 mm)、 金塔县三合站(50.7 mm)和高台县马尾湖站(56.8 mm)。
图2 2022年8月12日20:00至13日20:00 24 h降水量(单位: mm)

Fig.2 Distribution of accumulated precipitation from 20:00 on 12 to 20:00 on 13 August 2022.Unit: mm

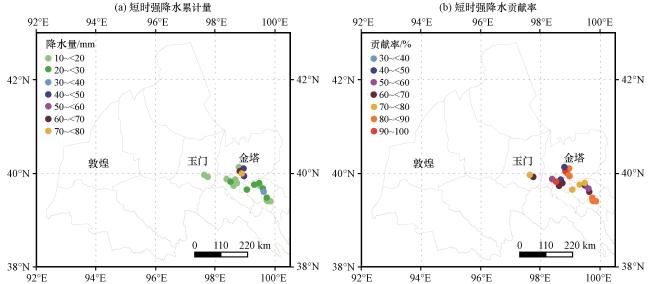
统计短时强降水(≥10 mm·h-1)累计量及其对24 h降水量的贡献率(百分比)。短时强降水(≥10 mm·h-1)累计量的空间分布与总降水量一致[图3(a)], 大值中心位于金塔县和高台县, 最大值出现在金塔站, 共32个站次短时强降水, 其中5个站短时强降水累计量超过30 mm。短时强降水累计量对24 h降水量的贡献率(百分比)如图3(b)所示, 其大值区与24 h降水量大值区基本一致[图3(b)]。短时强降水量贡献率超过60%的气象站主要分布于金塔县和高台县, 其中金塔站、 金塔县森林公园站和金鼎湖站超过80%。
图3 2022年8月12日20:00至13日20:00短时强降水累计量(a, 单位: mm)及同期短时强降水对总降水量的贡献率(b, 单位: %)

Fig.3 Spatial distribution of accumulated short-term strong rainfall (a, unit: mm) and the contribution rate of short-term strong rainfall to total precipitation (b, unit: %) from 20:00 on 12 to 20:00 on 13 August 2022

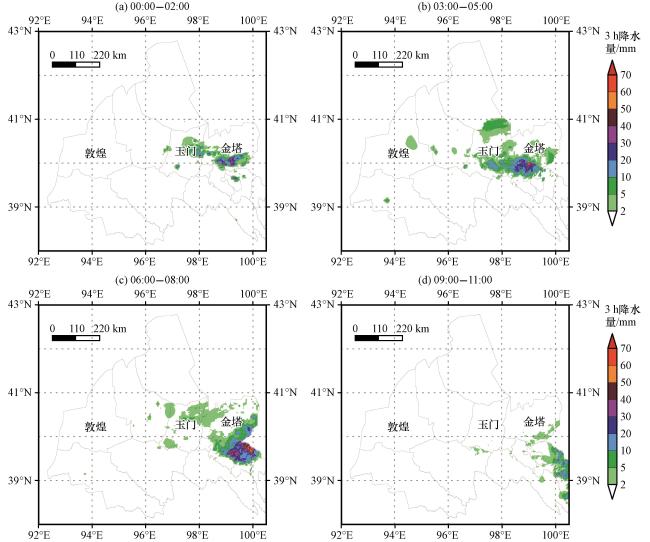
此次降水过程自2022年8月12日20:00从酒泉西部开始, 雨带缓慢东移, 13日11:00结束。酒泉市西部和中部为弱降水, 强降水主要发生在金塔县和高台县。13日00:00 -02:00, 降水区主要位于金塔县南部, 3 h降水量最大达到或超过30 mm [图4(a)]。13日03:00 -05:00, 降水区缓慢向南移动, 雨区范围较前一阶段扩大, 降水强度变化不明显[图4(b)]。13日06:00 -08:00强降水位于张掖市西部, 3 h最大雨量超过 30 mm, 金塔县南部降水减弱[图4(c)], 至13日09:00, 降水趋于结束[图4(d)]。
图4 2022年8月13日00:00 -11:00 3 h降水量分布(≥2 mm)

Fig.4 Spatial distribution of 3-hour cumulative precipitation (≥2 mm) from 21:00 on 12 August to 20:00 on August 2022

4.2 日降水量历史极端性

对比酒泉市及张掖市西部气象站历史降水资料发现, 此次强降水过程共1个国家站、 10个区域站24 h降水量突破建站以来的历史极值, 其中金塔站24 h降水量88 mm, 是该站有观测记录以来的日降水量最大值(2004年7月24日42.7 mm), 也是酒泉市所有国家站和张掖市西部国家站日降水量的次大值(最大值为2012年6月5日肃北气象站93.8 mm)。
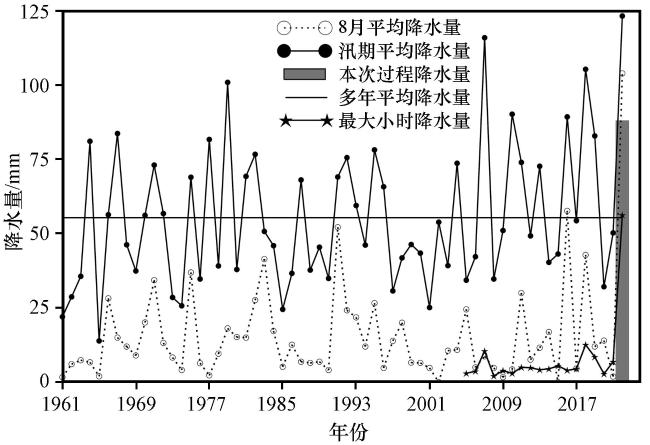
金塔站2022年汛期降水量123.1 mm(图5), 是历年汛期平均降水量(55.6 mm)的2倍多; 2022年8月总降水量达103.8 mm, 接近历年汛期平均降水量的2倍, 占2022年汛期降水量的84.3%。本次暴雨过程累计雨量超过历年汛期平均降水量的58%, 是2022年汛期降水量的71.5%, 约占8月总降水量的84.8%。以上数据均表明本次暴雨过程24 h降水量历史极端性特征明显。
图5 1961 -2022年金塔站汛期(5 -9月)降水量、 8月降水量、 1 h最大降水量逐年变化及本次暴雨过程24 h降水量

Fig.5 Annual variation of the cumulative precipitation in food season (May-September) and in August, the maximum precipitation in 1 h at Jinta station from 1961 to 2022 as a while as the cumulated precipitation in 24 hours during this rainstorm

统计1961 -2022年5 -9月酒泉市国家站、 张掖市西部国家站发生暴雨[≥30 mm·(24h)-1]、 大暴雨[≥50 mm·(24h)-1]的总次数及日降水量的极大值(表1)发现, 暴雨在该地区为小概率事件。1961 - 2022年62年来仅酒泉站、 肃北站暴雨次数达到或超过10次, 其余均少于7次。发生大暴雨事件的可能性更小, 10个国家站中仅5站发过大暴雨, 其中肃北站发生过4次大暴雨, 其余各站均出现1次大暴雨记录。尽管暴雨在该地区为小概率事件, 但在干旱区, 肃北、 金塔、 酒泉、 玉门站暴雨极大值分别达到93.8 mm、 88 mm、 84.4 mm和79.5 mm, 高台、 肃南、 马鬃山站极大值也超过了40 mm, 均超过相应气象站8月平均雨量。暴雨极大值占汛期平均降水量比例大, 金塔、 酒泉和玉门站分别达158.3%、 110.5%和156.8%, 其余为20.1%~93.2%, 反映了暴雨强度的极端性, 同时也反映出本次暴雨过程中金塔站暴雨强度的极端性。
表1 1961 -2022年5 -9月酒泉市、 张掖市西部国家站日降水极端性

Table 1 Extreme daily precipitation in Jiuquan city and the west of Zhangye city in flood season (from May to September) from 1961 to 2022

站名 ≥30 mm 次数/次 ≥50 mm 次数/次 极大值 /mm 出现日期 (年-月-日) “8·12”过程雨量 /mm 汛期平均降水量 /mm 8月平均雨量 /mm
金塔 3 1 88.0 2022-08-12 88.0 55.6 15.5
酒泉 10 1 84.4 2019-06-20 5.4 76.4 11.5
玉门 5 1 79.5 2012-06-05 3.1 54.9 7.5
马鬃山 2 0 42.5 1984-06-22 0 60.4 6.3
瓜州 2 0 31.8 2016-08-21 0.1 38.9 4.4
敦煌 2 0 31.3 2016-08-17 0 33.6 3.5
肃北 18 4 93.8 2012-06-05 0 106.3 11.0
鼎新 1 0 32.8 2018-08-20 5.5 49.5 7.5
高台 6 1 65.5 1974-07-30 3.7 93.2 15.8
肃南 4 0 46.7 2015-07-04 1.7 232.0 31.0

4.3 降水强度及极端性特征

此次暴雨过程共13个站小时雨强超过相应气象观测站有降水记录以来的极值, 其中金塔站小时降水量56.2 mm, 接近该站近62年来(1961 -2022年)8月平均雨量的3倍多, 超过近62年来5 -9月汛期平均雨量, 是该站有观测记录以来的最大值(次大值为2018年8月31日21:00的12.6 mm), 也是酒泉市和张掖市西部国家站有记录以来小时降水量的最大值, 小时降水强度具有明显极端性特征。
近19 年(2004 -2022年)来, 酒泉市、 张掖市西部国家站最大小时降水出现在金塔站(56.3 mm), 其次为肃南站(30.0 mm)。该地区除瓜州站外, 其余国家站均有小时降水量≥10 mm的记录, 但发生次数均少于10次, 酒泉、 玉门站次数最多, 分别为8次和7次。仅酒泉站、 金塔站和肃南站出现过20 mm·h-1以上的短时强降水, 其中酒泉站发生2次, 金塔站和肃南站各发生1次。近19年的统计中, 未同时出现2个及以上国家站小时降水量≥10 mm的情况, 与已有研究指出的河西走廊西部小时强降水区域性较差一致(孔祥伟等, 2015)。
表2 2004 -2022年5 -9月酒泉市、 张掖市西部国家站小时降水极端性

Table 2 Extreme hourly precipitation in Jiuquan city and the west of Zhangye city in flood season (from May to September) from 2004 to 2022

站名 极大值 /mm 出现时间 ≥10 mm·h-1次数/次 ≥20 mm·h-1次数/次
金塔 56.2 2022-08-13T01:00 5 1
酒泉 20.1 2019-06-20T18:00 8 2
玉门 17.6 2012-06-05T07:00 7 0
马鬃山 19.0 2017-08-07T13:00 5 0
瓜州 8.8 2007-07-10T21:00 0 0
敦煌 25.0 2018-06-19T20:00 2 1
肃北 18.5 2017-07-31T20:00 4 0
鼎新 15.4 2007-07-19T09:00 5 0
高台 12.9 2012-06-26T20:00 5 0
肃南 30.0 2015-07-04T03:00 4 1
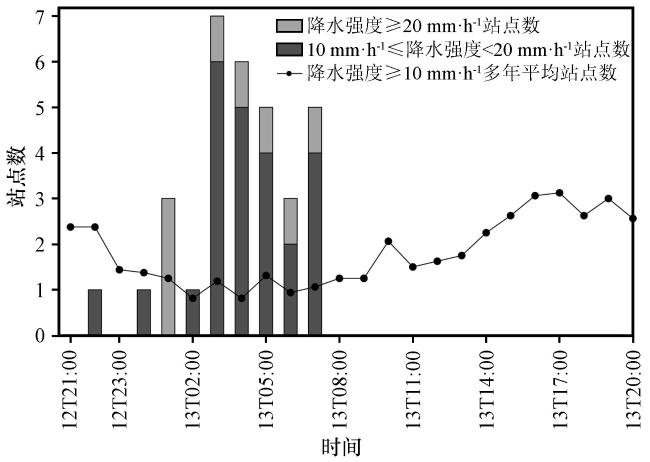
统计暴雨区(24个时次)逐时次小时雨强达到或超过10 mm·h-1和20 mm·h-1的气象站, 同时, 计算该地区近19年来5 -9月逐时次出现短时强降水的平均站数, 其日变化如图6所示。该地区小时雨强≥10 mm·h-1的气象站数日变化具有较明显的单峰结构, 15:00 -22:00是短时强降水易发时段, 23:00至次日12:00, 短时强降水最少, 平均少于2个站。此次暴雨过程共24(8)个站次≥10 mm·h-1(20 mm·h-1)的短时强降水, 站数大值主要出现在13日01:00 -07:00, 且均超过历史平均值。13日03:00共7个站出现短时强降水, 其中1个站小时雨强超过20 mm·h-1。此外, 13日04:00、 05:00和08:00分别有6、 5和5个站短时强降水, 且均有1个站小时雨强超过20 mm·h-1, 表明此次暴雨过程短时强降水频次高, 小时雨强较大。
图6 暴雨区短时强降水站数日变化

Fig.6 Diurnal variation of short-term strong rainfall stations in the rainstorm area

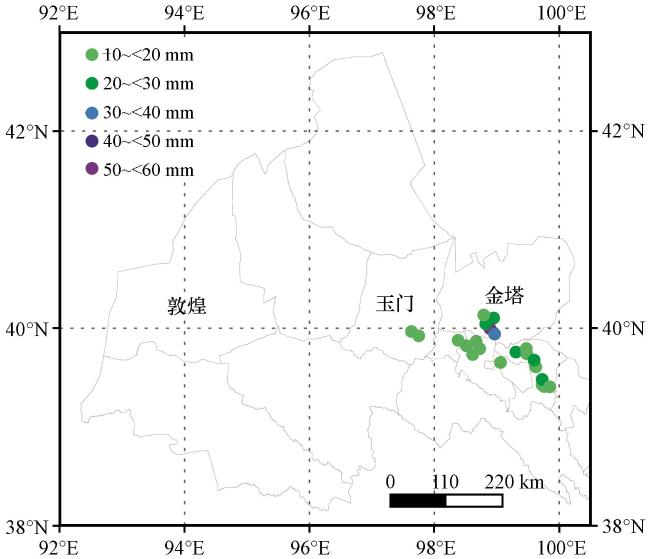
此次暴雨过程短强频次高, 强度强, 逐时次最大小时降水量空间分布与过程降水量大值区高度一致, 大值中心位于金塔县东南部, 其次是高台县(图7)。最大小时降水量≥10 mm的气象站分布范围较大, 玉门市、 肃州区及肃南裕固族自治县西北部均有分布, 最大小时降水量≥20 mm的气象站主要位于金塔县和高台县, 空间分布集中, 表明此次暴雨局地性特征明显。
图7 2022年8月12日20:00至13日20:00暴雨区逐时(24个时次)最大降水量分布(单位: mm)

Fig.7 Distribution of hourly maximum precipitation (24 hours) in the rainstorm area from 20:00 on 12 to 20:00 on 13 August 2022.Unit: mm

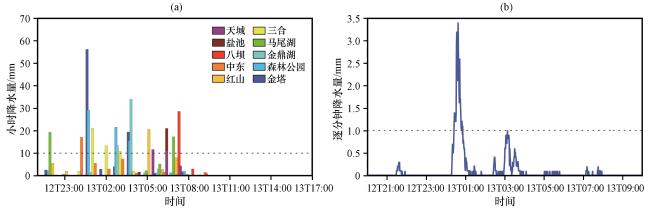
图8(a)给出了此次暴雨过程24 h降水量排名前10个气象站的逐时降水量演变, 金塔县5个站(金塔88 mm、 森林公园71.1 mm、 金鼎湖59.2 mm、 三合50.7 mm和中东38.2 mm)、 高台县5个站(马尾湖56.8 mm、 红山39.2 mm、 八坝32.6 mm、 盐池29 mm和天城28.5 mm)。降水主要发生在12日夜间至13日凌晨, 13日07:00之后, 降水强度急速减弱, 降水过程结束。10 mm·h-1以上量级降水主要集中在13日01:00 -07:00, 森林公园站和三合站均有3个时次出现≥10 mm·h-1降水, 金塔站、 森林公园站、 金鼎湖站、 八坝站、 三合站、 盐池站和红山站均出现≥20 mm·h-1的强降水。强降水期间对流性特征明显, 持续时间8 h, 因而累计雨量大。
图8 2022年8月12日20:00至13日17:00暴雨区代表站1 h降水量序列(a)及金塔站2022年8月12日20:00至13日10:00逐分钟降水量序列(b)

Fig.8 The variation of hourly precipitation of flash heavy rain at the typical representative stations from 20:00 on 12 to 17:00 on 13 August 2022 in rainstorm area (a) and minutely precipitation evolution of Jinta station from 20:00 on 12 to 10:00 on 13 August 2022

从小时降水量变化特征[图8(a)]表明, 金塔站13日01:00小时降水量最大, 为56.2 mm, 13日04:00为次大值时段, 小时降水量20.6 mm, 其余时段降水强度偏弱。为进一步分析金塔站降水随时间的演变特征, 图8(b)给出了金塔站主要降水时段内逐分钟降水序列, 从图中可见, 金塔站有3个降水时段, 分别为12日21:00 -22:00, 13日00:00 - 01:00, 13日02:00 -04:00。第一阶段以弱稳定性降水为主, 持续时间小于1 h, 最大分钟降水0.3 mm。第二阶段降水强度最强, 对流性特征明显, 0.5 mm·min-1≥降水持续时间长达39 min, 其中≥1.5 mm·min-1降水持续时间长达13 min, 最大分钟降水量3.4 mm。第三阶段降水强度较第二阶段减弱, 以<1 mm·min-1的降水为主, 最大分钟降水量1 mm, 但因降水持续时间长, 03:00 -04:00累计降水量20.6 mm。

4.4 强降水中心时空演变特征

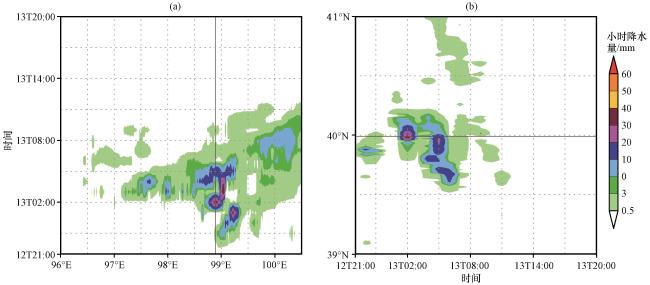
为了分析强降水中心的空间变化特征, 过暴雨中心(金塔站)做逐小时降水量时间-经度[图9(a)]和时间-纬度剖面[图9(b)]。从时间-经度剖面[图9(a)]可以看出, 12日22:00至13日00:00, ≥10 mm·h-1的强降水主要发生在金塔站东侧, 最大降水强度≥20 mm·h-1。13日00:00之后, 金塔站东侧降水强度明显减弱, 暴雨中心突发强降水, 强降水持续约1 h, 强降水中心略向东偏移, 暴雨中心降水强度断崖式减弱, 并持续2 h以上。在此期间, 暴雨中心西侧局地出现明显降水, 如图4(a)所示玉门市东部的降水。13日04:00, 暴雨中心及其东西两侧出现10 mm·h-1以上量级降水, 表明此阶段降水区域向东西两侧扩张[图4(b)]。05:00之后, 暴雨中心降水趋于结束, 但其东侧较大范围的弱降水仍持续, 如图4(c)中金塔东部降水。小时降水的南北方向演变特征表明, 暴雨中心降水强度随时间的变化与东西方向类似, 但南北方向偏移幅度较大[图9(b)]。暴雨中心发生强降水之前, 即12日22:00前后, 暴雨中心南部有持续时间很短的小范围降水。13日00:00 -04:00, 暴雨中心北部有较明显降水, 而南部降水强度偏弱, 13日04:00之后, 北部降水趋于结束, 南部降水增强, 范围扩大。强降水中心的空间演变表明, 暴雨区内较强降水开始于暴雨中心东南部, 暴雨中心降水强度经历了突然增强-减弱-增强-减弱结束的演变过程。
图9 2022年8月12日21:00至13日20:00逐小时降水量沿40°N的经度-时间剖面(a)和沿98.9°E的纬度-时间剖面(b)

Fig.9 The longitude-time section along 40°N (a) and latitude-time section along 98.9°E (b) of hourly precipitation from 21:00 on 12 to 20:00 on 13 August 2022

5 结论

利用2022年8月12日20:00至13日20:00酒泉市、 张掖市西部国家站和区域站逐分钟、 逐小时实况降水观测资料, 该地区区域站建站以来逐日和小时降水数据及1 h三源融合CMPAS降水资料, 分析金塔县此次暴雨过程降水特征及极端性, 结论如下:
(1) 暴雨中心位于金塔县、 高台县西部的山谷中, 日降水量大, 最大累计雨量88 mm, 局地性特征明显。对流性特征明显, 短时强降水站次多, 但空间分布集中, 有明显局地性分布特征; 强度强, 且持续时间较长, 其对总降水量的贡献超过60%, 个别站点超过80%。短时强降水主要出现在夜间。
(2) 日降水量和小时强降水量极端性特征明显。共1个国家站(金塔站)和10个区域站日降水量突破建站以来历史极值, 其中金塔站日降水量是酒泉市和张掖市西部国家站日降水量的最大值。13个站小时降水量达建站以来最大值, 其中金塔站为56.2 mm, 接近金塔站近62年来(1961 -2022年)8月平均雨量的3倍多, 是酒泉市和张掖市西部国家站有记录以来小时降水量的最大值。
(3) 金塔站逐分钟降水随时间演变显示, 该站降水主要分为3个时段, 每个时段降水强度、 持续时间差异明显。第一阶段为微弱降水, 第二阶段降水强度最强, 最大分钟降水3.4 mm, 0.5 mm·min-1降水持续超过39 min, 1 h累计雨量达56.2 mm。第三阶段较第二阶段弱, 以<1mm·min-1降水为主, 持续时间较长, 1 h累计雨量20.6 mm。
(4) 暴雨区内强降水开始于暴雨中心东南部, 然后向西北偏移, 最后向东南移出。暴雨中心降水强度经历了突然增强-减弱-增强-减弱结束的演变过程。

References

null
Cui D, Wang C, Santisirisomboon J, 2018.Characteristics of extreme precipitation over eastern Asia and its possible connections with Asian summer monsoon activity[J].International Journal of Climatology, 39: 711-723.DOI: 10.1002/joc.5837 .
null
Donat M G, Lowry A L, Alexander L V, et al, 2016.More extreme precipitation in the world’s dry and wet regions[J].Nature Climate Change, 6(5): 508-513.DOI: 10.1038/nclimate2941 .
null
Han J, Du H, Wu Z, et al, 2019.Changes in extreme precipitation over dry and wet regions of China during 1961-2014[J].Journal of Geophysical Research: Atmospheres, 124: 5847-5859.DOI: 10.1029/2018jd029974 .
null
IPCC, 2021.Climate Change 2021: the physical science basis.contribution of working group i to the sixth assessment report of the Intergovernmental Panel on Climate Change[M].Cambridge and New York, NY: Cambridge University Press.
null
Kharin V V, Zwiers F W, Zhang X, et al, 2013.Changes in temperature and precipitation extremes in the CMIP5 ensemble[J].Climate Change, 119(2): 345-357.DOI: 10.1007/s10584-013-0705-8 .
null
Min S K, Zhang X, Zwiers F W, et al, 2011.Human contribution to moreintense precipitation extremes[J].Nature, 470(7334): 378-381.DOI: org/10.1038/nature09763 .
null
Sillmann J, Kharin V V, Zwiers F W, et al, 2013.Climate extremes indices in the CMIP5 multimodel ensemble: part 2.future climate projections[J].Journal of Geophysical Research, 118(6): 2473-2493.DOI: 10.1002/jgrd.50188 .
null
Wen X, Fang G, Qi H, et al, 2015.Changes of temperature and precipitation extremes in China: past and future[J].Theoretical and Applied Climatology, 126(1/2): 369-383.DOI: 10.1007/s00704-015-1584-x .
null
Zhang W, Zhou T, 2019.Increasing impacts from extreme precipitation on population over China with global warming[J].Science Bulletin, 65: 243-252.DOI: 10.1016/j.scib.2019.12.002 .
null
Zhou X, Bai Z, Yang Y, 2017.Linking trends in urban extreme rainfall to urban flooding in China[J].International Journal of Climatology, 37(13): 4586-4593.DOI: 10.1002/joc.5107 .
null
陈海山, 范苏丹, 张新华, 2009.中国近 50 a 极端降水事件变化特征的季节差异[J].大气科学学报, 32(6): 744-751.
null
Chen H S, Fan X D, Zhang X H, 2009.Seasonal differences of variation characteristics of extreme precipitation events over China in the last 50 years[J].Transactions of Atmospheric Sciences, 32(6): 744-751.
null
陈涛, 张芳华, 于超, 等, 2020.2020年6-7 月长江中下游极端梅雨天气特征分析[J].气象, 46(11): 1415-1426.
null
Chen T, Zhang F H, Yu C, et al, 2020.Synoptic analysis of extreme Meiyu precipitation over Yangtze River Basin during June-July 2020[J].Meteorological Monthly, 46(11): 1415-1426.
null
翟盘茂, 潘晓华, 2003.中国北方近50年温度和降水极端事件变化[J].地理学报, 58(): 1-10.
null
Zhai P M, Pan X H, 2003.Change in extreme temperature and precipitation over northern China during the second half of the 20th century[J].Acta Geographica Sinica, 58(): 1-10.
null
丁一汇, 2015.论河南“75·8”特大暴雨的研究: 回顾与评述[J].气象学报, 73(3): 411-424.
null
Ding Y H, 2015.On the study of the unprecedented heavy rainfall in Henan Province during 4-8 August 1975: Review and assessment[J].Acta Meteorologica Sinica, 73(3): 411-424.
null
丁一汇, 蔡则怡, 李吉顺, 1978.1975年8月上旬河南特大暴雨的研究[J].大气科学, 2(4): 276-289.DingY H, CaiZ Y, LiJ S, 1978.Study on heavy rainstorm in Henan Province in early August 1975[J].Chinese Journal of Atmospheric Sciences, 2(4): 276-289.
null
傅朝, 刘维成, 宋兴宇, 2022.西北干旱区一次极端暴雨局地性增强的对流环境特征[J].干旱气象, 40(6): 909-921.
null
Fu Z, Liu W C, Song X Y, 2022.Local enhanced convective environment characteristics of an extreme rainstorm event in arid region of Northwest China[J].Journal of Arid Meteorology, 40(6): 909-921.
null
高荣, 宋连春, 钟海玲, 2018.2016 年汛期中国降水极端特征及与1998年对比[J].气象, 44(5): 699-703.
null
Gao R, Song L C, Zhong H L, 2018.Characteristics of Extreme Precipitation in China During the 2016 Flood Season and Comparison with the 1998 Situation[J].Meteorological Monthly, 44(5): 699-703.
null
黄玉霞, 李栋梁, 王宝鉴, 2004.西北地区近 40年年平均降水异常的时空分布特征[J].高原气象, 23(2): 245-252.
null
Huang Y X, Li D L, Wang B J, 2004.Analyses on temporal-spatial features of annual precipitation in northwest China in 1961-2000[J].Plateau Meteorology, 23(2): 245-252.
null
景丞, 陶辉, 王艳君, 等, 2017.基于区域气候模式 CCLM 的中国极端降水事件预估[J].自然资源学报, 32(2): 266-277.
null
Jing C, Tao H, Wang Y J, et al, 2017.Projection of extreme precipitation events in China based on Regional Climate Model CCLM[J].Journal of Natural Resources, 32(2): 266-277.
null
孔祥伟, 陶健红, 2012. 近 51a甘肃夏季气温和降水极端事件变化[J].干旱区研究, 29(6): 965-971.
null
Kong X W, Tao J H, 2012.Change of extreme temperature and precipitation events in Gansu Province in summer in recent 51 years[J].Arid Zone Research, 29(6): 965-971.
null
孔祥伟, 陶健红, 刘治国, 等, 2015.河西走廊中西部干旱区极端暴雨个例分析[J].高原气象, 34(1): 70-81.DOI: 10.7522/j.issn.1000-0534.2013.00138.Kong X W ,
null
Tao J H, Liu Z G, et al, 2015.Case analysis of extreme rainstorm in arid zone of the midwestern Gansu Corridor[J].Plateau Meteorology, 34(1): 70-81.DOI: 10.7522/j.issn.1000-0534.2013.00138 .
null
孔祥伟, 杨建才, 李红, 等, 2021.河西走廊西部干旱区一次极端暴雨天气的水汽特征分析[J].气象, 47(4): 412-423.
null
Kong X W, Yang J C, Li H, et al, 2021.Analysis on water vapor characteristics of an extreme rainstorm in the arid region of western Hexi Corridor[J].Meteorological Monthly, 47(4): 412-423.
null
李红英, 高振荣, 白松竹, 等, 2013.近51 年河西走廊西部极端强降水事件变化研究[J].干旱区资源与环境, 27(10): 100-106.
null
Li H Y, Gao Z R, Bai S Z, et al, 2013.Analysis on the extreme strong precipitation events change in western Hexi Corridor since recent 51 years[J].Journal of Arid Land Resources and Environment, 27(10): 100-106.
null
李玲萍, 王博, 李天江, 等, 2023.河西走廊夏季旱涝和典型暴雨的水汽特征[J].高原气象, 42(4): 1-11.DOI: 10.7522/j.issn.1000-0534.2022.00058.Li L P ,
null
Wang B, Li T J, et al, 2023.Water vapor characteristics of summer drought and flood and typical rainstorm in Hexi Corridor[J].Plateau Meteorology, 42(4): 1-11.DOI: 10.7522/j.issn.1000-0534.2022.00058 .
null
李显风, 周自江, 李志鹏, 等, 2017.基于江西省水文资料对中国融合降水产品的质量评估[J].气象, 43(12): 1534-1546.
null
Li X F, Zhou Z J, Li Z P, et al, 2017.Quality assessment of china merged precipitation product using hydrological data in Jiangxi Province[J].Meteorological Monthly, 43(12): 1534-1546.
null
卢珊, 胡泽勇, 王百朋, 等, 2020.近 56 年中国极端降水事件的时空变化格局[J].高原气象, 39(4): 683-693.DOI: 10.7522/j.issn.1000-0534.2019.00058.Lu S ,
null
Hu Z Y, Wang B P, et al, 2020.Spatio-temporal patterns of extreme precipitation events over China in recent 56 years[J].Plateau Meteorology, 39(4): 683-693.DOI: 10.7522/j.issn.1000-0534.2019.00058 .
null
栾晨, 宋敏红, 蔡英, 等, 2012.西北区西部夏半年强降水分布与变化特征[J].髙原气象, 31(3): 629-637.
null
Luan C, Song M H, Cai Y, et al, 2012.Distribution and change feature of intense precipitation in the west part of northwestern China during summer half years[J].Plateau Meteorology, 31(3): 629-637.
null
孙帅, 师春香, 潘旸, 等, 2020.中国区域三源融合降水产品的改进效果评估[J].水文, 40(6): 10-15.
null
Sun S, Shi C X, Pan Y, et al, 2020.The improved effects evaluation of three-source merged of precipitation products in China[J].Journal of China Hydrology, 40(6): 10-15.
null
陶健红, 孔祥伟, 刘新伟, 2016.河西走廊西部两次极端暴雨事件水汽特征分析[J].高原气象, 35(1): 107-117.DOI: 10.7522/ j.issn.1000-0534.2014.00144.Tao J H ,
null
Kong X W, Liu X W, 2016.Analysis on water vapor characteristics of two extreme rainstorm events in Western Gansu Corridor[J].Plateau Meteorology, 35(1): 107-117.DOI: 10.75225.issn.1000-0534.2014. 00144 .
null
杨浩, 周文, 汪小康, 等, 2022.“21·7”河南特大暴雨降水特征及极端性分析[J].气象, 48(5): 571-579.YangH, ZhouW, WangX K, et al, 2022.Analysis on extremity and characteristics of the "21·7" severe torrential rain in Henan Province[J].Meteorological Monthly, 48(5): 571-579.
null
杨秀梅, 孔祥伟, 王勇, 等, 2023.一次干旱区极端暴雨天气的中尺度特征分析[J].高原气象, 42(4): 1-15.DOI: 10.7522/j.issn.1000-0534.2022.00050.Yang X M ,
null
Kong X W, Wang Y, et al, 2023.Analysis on mesoscale characteristics of an extreme rainstorm in arid areas[J].Plateau Meteorology, 42(4): 978-992.DOI: 10.7522/j.issn.1000-0534.2022.00050 .
null
俞亚勋, 王宝灵, 董安祥, 2020. 西北地区大气水分和水汽平均输送特征.谢金南主编, 中国西北干旱气候变化与预测研究(一)[M].北京: 气象出版社, 201-227.
null
Yu Y X, Wang B L, Dong A X, 2020.Average transport characteristics of atmospheric water and water vapor in northwest China.X J N edit., Research on drought climate change and prediction in northwest China (1)[M].Beijing: China Meteorological Press, 201-227.
null
张芳华, 陈涛, 张芳, 等, 2020.2020年6-7 月长江中下游地区梅汛期强降水的极端性特征[J].气象, 46(11): 1405-1414.
null
Zhang F H, Chen T, Zhang F, et al, 2020.Extreme features of severe precipitation in Meiyu period over the middle and lower reaches of Yangtze River Basin in June-July 2020[J].Meteorological Monthly, 46(11): 1405-1414.
null
张君霞, 黄武斌, 杨秀梅, 等, 2022.陇东半干旱区一次特大暴雨事件的降水极端性分析[J].干旱气象, 40(6): 922-932.
null
Zhang J X, Huang W B, Yang X M, et al, 2022.Analysis on precipitation extremity of a torrential rain event in semi-arid region of eastern Gansu[J].Journal of Arid Meteorology, 40(6): 922-932.
null
郑国光, 矫梅燕, 丁一汇, 等, 2019.中国气候[M].北京: 气象出版社.Zheng G G, Jiao M Y, Ding Y H, et al, 2019.China Climate[M].Beijing: China Meteorological Press.
null
周璇, 孙继松, 张琳娜, 等, 2020.华北地区持续性极端暴雨过程的分类特征[J].气象学报, 78(5): 761-777.
null
Zhou X, Sun J S, Zhang L N, et al, 2020.Classification characteristics of continuous extreme rainfall events in North China[J].Acta Meteorologica Sinica, 78(5): 761-777.
Outlines

/

〈 〉